3630
Comparison of 2D- and 3D-generated Radiomics feature maps in glioblastoma tissue subtypes segmented from DCE perfusion MRI1Philips Innovation Campus, Bangalore, India, 2BIU, Philips Innovation Campus, Bangalore, India, 3BIU, Philips Innovation Campus, Gurugram, India, 4Center for Biomedical Engineering, Indian Institute of Technology Delhi, Bangalore, India, 5Department of Radiology and Imaging, Fortis Memorial Research Institute, Gurugram, India
Synopsis
Radiomics based feature value analysis and feature maps especially for first order and texture based features are being thoroughly investigated for diagnostic usability and relevance. Radiomics based feature map generation using 2D and 3D modes on different tumor sub-regions of glioblastoma were performed. 2D-based feature maps depicted accurately the texture variation with respect to other images from the slice of interest, whereas in 3D based maps anatomy and pathology of the neighboring slices induced influence resulting in over depiction of pathology.
Introduction
Radiomics is a computational approach to derive quantitative information from radiographic images to understand spatial heterogeneity present due to anatomical and pathological variations [1][2]. Data processing involved in Radiomics is obtaining a feature value for a given ROI and generating a feature map within the given ROI. The application of Radiomics analysis to translate the pathological information from the images especially using MRI, CT and PET-MRI into meaningful and diagnostically interpretable visualization maps is an active research today [1][2]. Voxel based feature computation within manually segmented regions demonstrated texture variation between normal and cancerous region when used with T2-weighted MRI images and ADC maps of prostate cancer [1]. Radiomics feature maps-based characterization of the subtle and intratumoral variations between the high and low risk subjects of medulloblastoma using MRI images has been attempted [3]. Interchangeably the 2D and 3D feature values found to be useful in several studies, with 3D features reported to be providing better pathology classification results in MRI breast lesion detection [5][6]. However, during slice-by-slice diagnostic investigation of the tumors, radiologist compares the current slice across the techniques including ADC maps, perfusion maps, FLAIR and other sequences. Radiomics feature maps generated need to depict the anatomical and pathological information pertaining to the current slice to accomplish the comparison. In this study, the Radiomics based feature maps computed using post contrast (T1GD) and FLAIR images in 2D and 3D modes are compared using Glioblastoma (GB) subjects in order to evaluate the ability of these modes to characterize the texture variations. Textural comparison of different tumor tissue types is also performed to analyze the feature values obtained from 2D and 3D modes within the tumor sub-regions ROIMethods
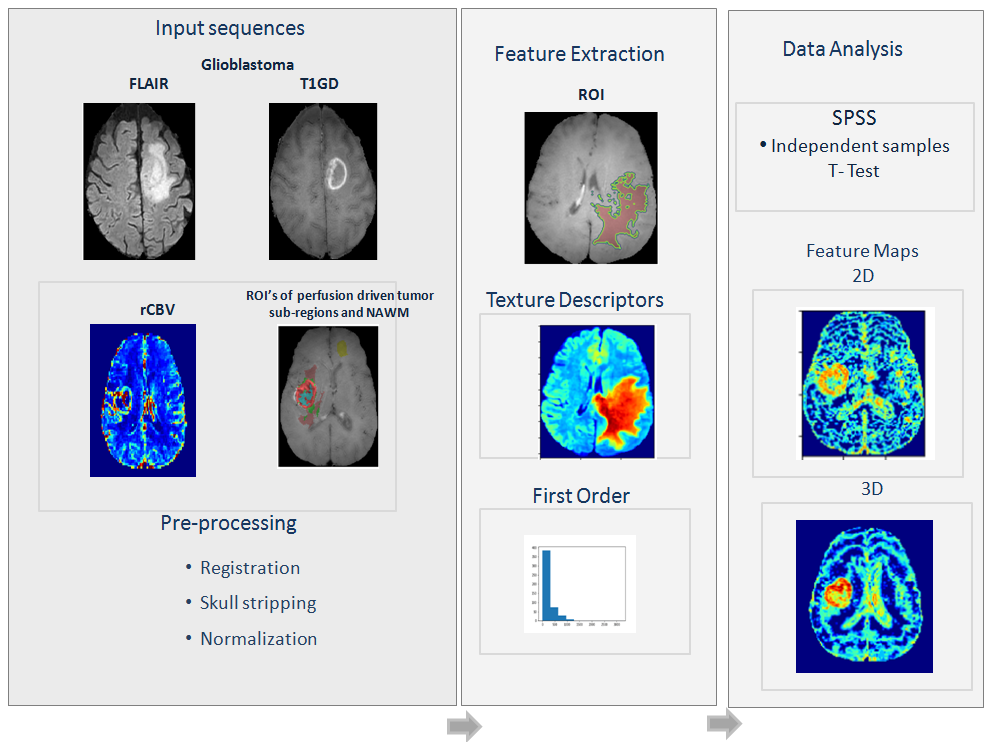
In the current study 96 surgery naïve Glioblastoma (GB) subjects which were histologically proven used. Image acquisition was performed on Philips Ingenia 3T scanner with a 15-channel head coil. Acquired sequences include FLAIR, T1-TSE and T1GD. Radiomics features were computed using, tumor sub-region masks namely, contrast enhancing tumor (ET), necrosis (NEC), non-enhancing tumor (NET) and edema (ED) which were obtained as described with T1-perfusion based perfusion maps, T1GD and FLAIR images [7]. Feature extraction was implemented using PyRadiomics 2.2.0 library to extract 93 features (first order and texture) [8]. T1GD and FLAIR images were registered with T1-TSE and then the skull was stripped followed by normalization using min–max approach [9]. To generate feature maps voxel-based approach is implemented with an ROI sizes of (3, 3, 1)(2D) and (3, 3, 3)(3D). Results using T1GD images are presented here. Area under curve (AUC) was computed across tumor sub-regions for the statistically significant features [10][11]. The implementation in this study is depicted in Figure 1Results
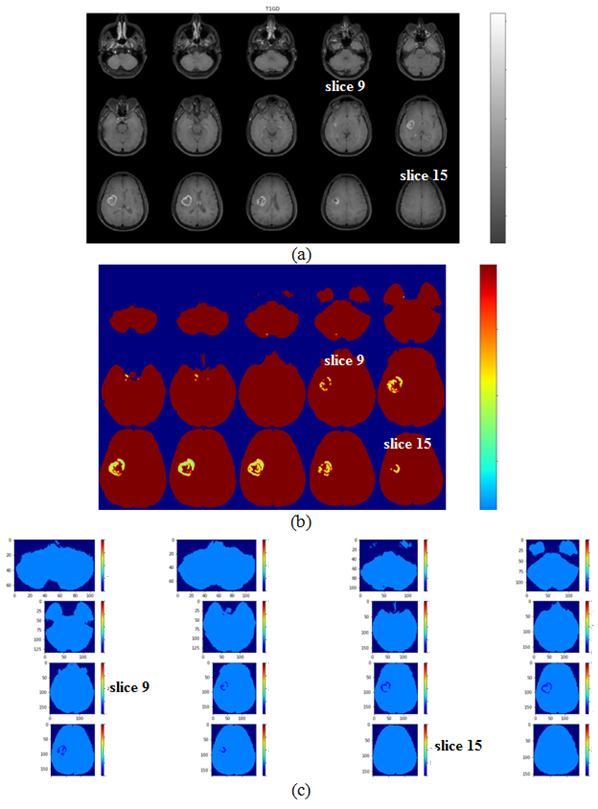
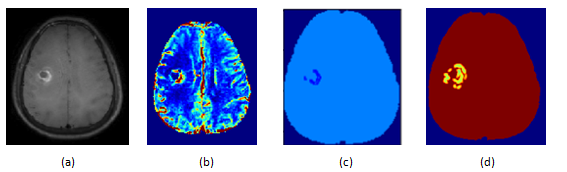
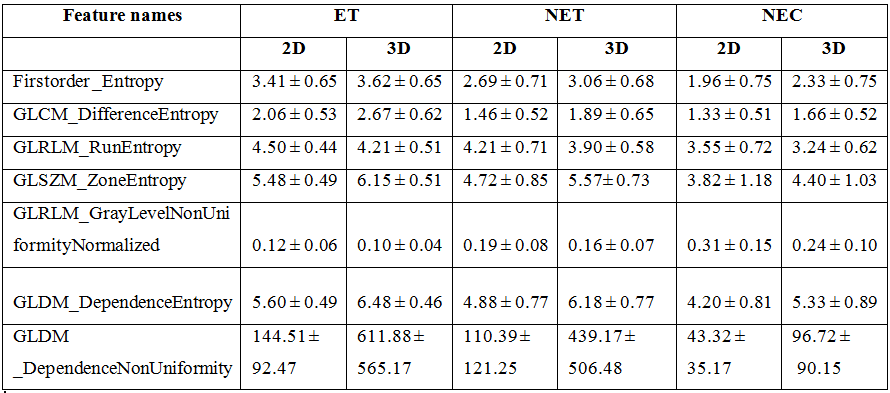
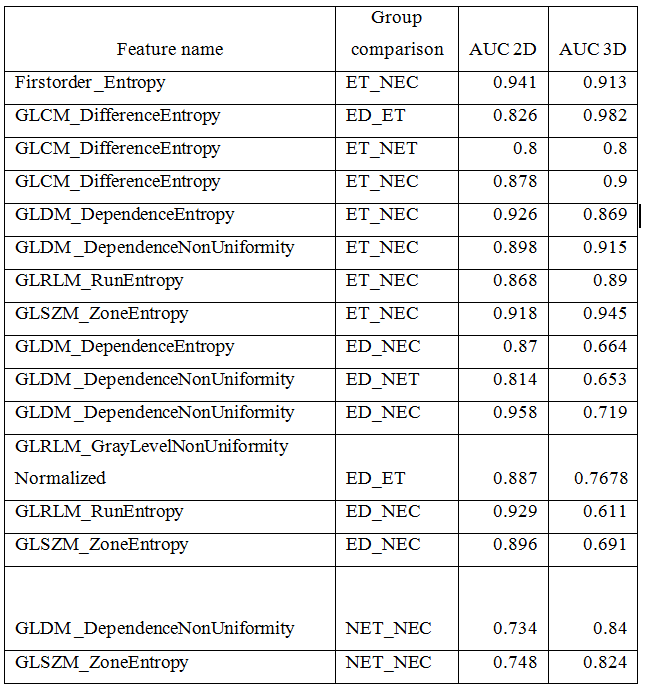
Among 93 features, 7 were statistically significant across individual tumor sub-regions out of which 6 were common among the 2D and 3D, while 1 feature was exclusive to 2D (table 1). AUC values of 2D features were found to be better than the 3D with consistently above 0.7 (table 2). The gray level run length matrix GrayLevelNonUniformityNormalized (GLRLM) feature maps obtained using 2D and 3D based approaches are depicted in the Figure 2. In (b), slight over representation of the texture value as seen from the slice 9, in contrast it could be seen there is under representation in texture value. Similarly, in slice 15 it could be observed that in case of 3D feature map there is over texture representation, while in 2D there has no texture representation. Single slice comparison of T1GD, rCBV, 2D feature map and 3D feature map is shown in the Figure 3. The 2D feature map in the (c) is observed to closely resemble the tumor region in the current slice, whereas the 3D feature map in (d) shows the over representationDiscussion
Results obtained in this study emphasize that the comparison of 2D and 3D Radiomics feature values and feature map generation is necessary to understand variabilities induced by the two extraction modes, as they tend to influence the preceding stages including segmentation of tissues. Same features except one extra feature from 2D found to be significant in both the modes. High numbers of common features indicate that the features are consistent w.r.t., both the modes of extraction; however subtle variations in AUC values do exist. On evaluation of feature maps, the 2D based map was clearly found to resemble the morphology of the lesion seen on conventional and perfusion MRI of the depicted slice, whereas the 3D based map seems to be sensitive to the texture variation from the slice above and below the current slice. This is due to the computation mechanism of the two approaches. In 2D case, the neighborhood is from the current slice with each voxel subjected to 8-neighbors, while in 3D approach the neighborhood is from current slice, as well as from the slice above and below within 26 – neighbors thereby influencing texture variation. Hence, 3D feature maps tend to be influenced by the two neighboring slices which may impact the diagnostic investigation being carried in a slice of interest. Careful selection of the mode of feature extraction seems to be imperative depending on the clinical investigationAcknowledgements
No acknowledgement found.References
1.Gillies, Robert J., Paul E. Kinahan, et al. Radiomics: images are more than pictures, they are data, Radiology 2016,278(2), 563-577.
2. Colen, R.R., Rolfo, C., Ak, M., Ayoub et al. Radiomics analysis for predicting pembrolizumab response in patients with advanced rare cancers, Journal for immunotherapy of cancer 2021,9(4).
3. Kong, Z., Jiang, C., Zhu, R, et al. 18F-FDG-PET-based radiomics features to distinguish primary central nervous system lymphoma from glioblastoma, NeuroImage: Clinical,2019, 23: 101912.
4. Yan, J., Zhang, S., Li, K.K.W, et al. Incremental prognostic value and underlying biological pathways of radiomics patterns in medulloblastoma, EBioMedicine 2020, 61 : 103093.
5. Chen, W., Giger, M.L., Li, H, et al. Volumetric texture analysis of breast lesions on contrast‐enhanced magnetic resonance images. Magnetic Resonance in Medicine: An Official Journal of the International Society for Magnetic Resonance in Medicine, 2007, 58(3): 562-571.
6. Salunkhe, S., Bachute, M., Gite, S, et al. "Classification of Alzheimer’s Disease Patients Using Texture Analysis and Machine Learning." Applied System Innovation 2021,4(3): 49.
7. Sengupta A, Agarwal S, Gupta PK et al., On differentiation between vasogenic edema and non-enhancing tumor in high-grade glioma patients using a support vector machine classifier based upon pre and post-surgery MRI images, Eur. J. Radiol., 2018: 106, 199–208, doi: 10.1016/j.ejrad.2018.07.018.
8. Van Griethuysen JJM, Fedorov A, Parmar C, et al., Computational Radiomics System to Decode the Radiographic Phenotype. Cancer Research, 2017: 77(21), e104–e107,. doi: 10.1158/0008-5472.CAN-17-0339
9. Smith, Stephen M. Fast robust automated brain extraction, Human brain mapping,2002, 17(3) : 143-155.
10. Bradley, A P. The use of the area under the ROC curve in the evaluation of machine learning algorithms, Pattern recognition 1997,30(7): 1145-1159. Hanley, J.A. and McNeil, B.J., The meaning and use of the area under a receiver operating characteristic (ROC) curve. Radiology, 1982,143(1), pp.29-36
Figures