3628
Multiparametric MR radiomics in brain glioma: models comparation to predict biomarker status1Tianjin Medical University Graduate School, Tianjin, China, 2Department Of Imaging Diagnosis, Affiliated Hospital Of Inner Monglia Medical University, Hohhot, China, 3MR Scientific Marketing, Siemens Healthineers, Shanghai, China, 4GE Healthcare, Shanghai, China, 5Inner Monglia Medical University, Hohhot, China
Synopsis
Objective:To compare the performance of clinical model, radiomics model, and combined model in predicting biomarker status (IDH, MGMT, TERT, 1p/19q) of glioma.Methods: 81 glioma patients confirmed by histology were enrolled in this study. The predictive performance of each model was validated by receiver operating characteristic curve (ROC) analysis and decision curve analysis (DCA).Results: The mixed model showed the highest performance in each genic phenotype (IDH AUC = 0.93, MGMT AUC=0.88, TERT AUC=0.76, 1p/19q AUC=0.71).Conclusion: The mixed model is an effective tool to distinguish genic phenotype of brain glioma which have highest diagnostic efficiency than other models.
Abstract
Objective To compare the performance of clinical features(age, sex, WHO grade etc.), radiomics features about conventional MR image(T2WI, T1WI, DWI, ADC, CE-MRI (contrast enhancement)), and a combined multiple features model in predicting biomarker status (IDH, MGMT, TERT, 1p/19q) of glioma.Methods In this retrospective analysis, 81 glioma patients confirmed by histology were enrolled in this study. Differences in the clinical and imaging characteristics between groups of each genic phenotype were evaluated using the independent samples t test, the Mann-Whitney U test, and the chi-squared or Fisher’s exact tests, as appropriate. Automatic preprocessing was standardized for each case involving intensity normalization, resampling, and discretization. Tumor segmentation was performed manually on every slice that the tumor was visualized using T2WI images by ITK-snap software. A VOI was generated encompassing the entire region of T2WI hyperintensity and overlaid onto coregistered T1W, T1W+c, DWI and ADC datasets for radiomics texture analysis. A total of 107 radiomics features were extracted from each sequence on Pyradiomics software. Then, univariate analysis and LASSO regression model were used to data dimension reduction, feature selection, and radiomics signature building. Significant features (p < 0.05) by multivariate logistic regression were retained to establish a clinical model, combined radiomics model. The combined radiomics model included T2WI, T1WI, DWI, ADC and CE-MRI radiomics features. Clinical features were combined with a radiomics features to establish a mixed model. The predictive performance was validated by receiver operating characteristic curve (ROC) analysis and decision curve analysis (DCA).
Results The demographic data including age, sex, tumor grade, and enhancement status are grouped based on biomarker mutation status and summarized in Table 1.Clinical and morphological characteristics have statistical significance of each biomarker are summarized in Table 2(Using univariate analysis, the characteristics of P <0.05 were retained). The mixed model showed the highest performance in each genic phenotype (IDH AUC = 0.93, MGMT AUC=0.88, TERT AUC=0.76, 1p/19q AUC=0.71) (Fig.1,2). The performance of the combined radiomics model was higher than the clinical model in the most of genic phenotypes, including MGMT, TERT, 1p/19q (Fig.1,2). Decision curve analysis showed the mixed model can better identify each genic phenotype of glioma (Fig.3).
Conclusion The mixed model is an effective tool to distinguish genic phenotype of brain glioma which have highest diagnostic efficiency than other models.
Acknowledgements
I am grateful to my wife and colleagues for their great support to my research work.
References
[1]Ostrom Q T,Gittleman H,Liao P, et al. CBTRUS statistical report: primary brain and central nervous system tumors diagnosed in the United States in 2007-2011.Neuro Oncol.2014;16(Suppl 4):iv1-63.
[2]Pandith A A,Qasim I,Zahoor W, et al. Concordant association validates MGMT methylation and protein expression as favorable prognostic factors in glioma patients on alkylating chemotherapy (Temozolomide).Sci Rep.2018;8(6704.
[3]Clarke J,Butowski N,Chang S. Recent advances in therapy for glioblastoma.Arch Neurol.2010;67(3):279-283.
[4]Berghoff A S,Kiesel B,Widhalm G, et al. Correlation of immune phenotype with IDH mutation in diffuse glioma.Published online.2017;19(11):1460–1468.
[5]Han S,Liu Y,Cai S J, et al. IDH mutation in glioma: molecular mechanisms and potential therapeutic targets.Br J Cancer.2020;122(11):1580-1589.
[6]Yan H,Parsons D W,Jin G, et al. IDH1 and IDH2 Mutations in Gliomas.N Engl J Med.2009 360(8):765–773.
[7]Nobusawa S,Watanabe T,Kleihues P, et al. IDH1 mutations as molecular signature and predictive factor of secondary glioblastomas.Clin Cancer Res.2009;15(19):6002-6007.
[8]Weller M,Bent M v d,Preusser M, et al. EANO guidelines on the diagnosis and treatment of diffuse gliomas of adulthood.Nat Rev Clin Oncol.2021;18(3):170-186.
[9]A M,Al-Obaide I,Arutla V, et al. Genomic Space of MGMT in Human Glioma Revisited: Novel Motifs, Regulatory RNAs, NRF1, 2, and CTCF Involvement in Gene Expression.Int J Mol Sci.2021;22(5):2492.
[10]Bent M J v d,Brandes A A,Taphoorn M J B, et al. Adjuvant Procarbazine, Lomustine, and Vincristine Chemotherapy in Newly Diagnosed Anaplastic Oligodendroglioma: Long-Term Follow-Up of EORTC Brain Tumor Group Study 26951.J Clin Oncol.2013;31(3):344-350.
[11]Brat D J,Verhaak R G W,dape K D A-, et al. Comprehensive, Integrative Genomic Analysis of Diffuse Lower-Grade Gliomas.N Engl J Med.2015;372(26):2481–2498.
[12]Fan Z,Sun Z,Fang S, et al. Preoperative Radiomics Analysis of 1p/19q Status in WHO Grade II Gliomas.Front Oncol.2021;11(616740.
[13]Patel B,Taiwo R,Kim A H, et al. TERT, a promoter of CNS malignancies.Neurooncol Adv.2020;2(1):vdaa025.
[14]Killela P J,Reitman Z J,Jiao Y, et al. TERT promoter mutations occur frequently in gliomas and a subset of tumors derived from cells with low rates of self-renewal.Proc Natl Acad Sci U S A.2013;110(15):6021–6026.
[15]Heidenreich B,Rachakonda P S,Hosen I, et al. TERT promoter mutations and telomere length in adult malignant gliomas and recurrences.oncotarget.2015;6(12):10617-10633.
[16]van Griethuysen J J M,Fedorov A,Parmar C, et al. Computational Radiomics System to Decode the Radiographic Phenotype.Cancer Research.2017;77(21):e104–e107.
[17]Tibshirani R. Regression shriknage and selectino via the lasso.J R Stat Soc Ser B.1996;58(1):267-288.
[18]DeLong E R,DeLong D M,Clarke-Pearson D L, et al. Comparing the areas under two or more correlated receiver operating characteristic curves: a non-parametric approach.Biometrics.1988;44(3):837-845.
[19]Yan J,Zhang B,Zhang S, et al. Quantitative MRI-based radiomics for noninvasively predicting molecular subtypes and survival in glioma patients.NPJ Precis Oncol.2021;5(72):doi: 10.1038/s41698-41021-00205-z.
[20]Zhou H,Chang K,Bai H X, et al. Machine learning reveals multimodal MRI patterns predictive of isocitrate dehydrogenase and 1p/19q status in diffuse lowand high-grade gliomas.J Neurooncol.2019;142(2):299–307.
[21]Kihira S,Tsankova N M,Bauer A, et al. Multiparametric MRI texture analysis in prediction of glioma biomarker status: added value of MR diffusion.Neurooncol Adv.2021;3(1):vdab051.
[22]Huang L E,Cohen A L,Colman H, et al. IGFBP2 expression predicts IDH-mutant glioma patient survival.Oncotarget.2017;8(1):191–202.
[23]Houillier C,Wang X,Kaloshi G, et al. IDH1 or IDH2 mutations predict longer survival and response to temozolomide in low-grade gliomas.Neurology.2010;75(17):1560-1566.
[24]Li S,Chou A P,Chen W, et al. Overexpression of isocitrate dehydrogenase mutant proteins renders glioma cells more sensitive to radiation.neuro Oncol.2013;15(1):57-68.
[25]Hartmann C,Hentschel B,Simon M, et al. Long-term survival in primary glioblastoma with versus without isocitrate dehydrogenase mutations.clin Cancer Res.2013;19(18):5146-5157.
[26]Hegi M E,Diserens A-C,Gorlia T, et al. MGMT gene silencing and benefit from temozolomide in glioblastoma.N Engl J Med.2005;352(10):997-1003.
[27]Nonoguchi N,Ohta T,Oh J-E, et al. TERT promoter mutations in primary and secondary glioblastomas.Acta Neuropathol.2013;126(6):931-937.
[28]Engelhard H H,Ana Stelea A M. Oligodendroglioma and anaplastic oligodendroglioma: clinical features, treatment, and prognosis.Surg Neurol.2003;60(5):443-456.
[29]Yao J,Hagiwara A,Raymond C, et al. Human IDH mutant 1p/19q co-deleted gliomas have low tumor acidity as evidenced by molecular MRI and PET: a retrospective study.Sci Rep.2020;10(11022.
[30]Feraco P,Bacci A,Ferrazza P, et al. Magnetic Resonance Imaging Derived Biomarkers of IDH Mutation Status and Overall Survival in Grade III Astrocytomas.Diagnostics (Basel).2020;10(4):247.
[31]Zhang J,Peng H,Wang Y-L, et al. Predictive Role of the Apparent Diffusion Coefficient and MRI Morphologic Features on IDH Status in Patients With Diffuse Glioma: A Retrospective Cross-Sectional Study. .Front Oncol.2021;11(640738.
[32]Eoli M,Menghi F,Bruzzone M G, et al. Methylation of O6-methylguanine DNA methyltransferase and loss of heterozygosity on 19q and/or 17p are overlapping features of secondary glioblastomas with prolonged survival.Clin Cancer Res.2007;13(9):2606-2613.
[33]Suh C H,Kim H S,Jung S C, et al. Clinically Relevant Imaging Features for MGMT Promoter Methylation in Multiple Glioblastoma Studies: A Systematic Review and Meta-Analysis.AJNR Am J Neuroradiol.2018;39(8):1439-1445.
Figures
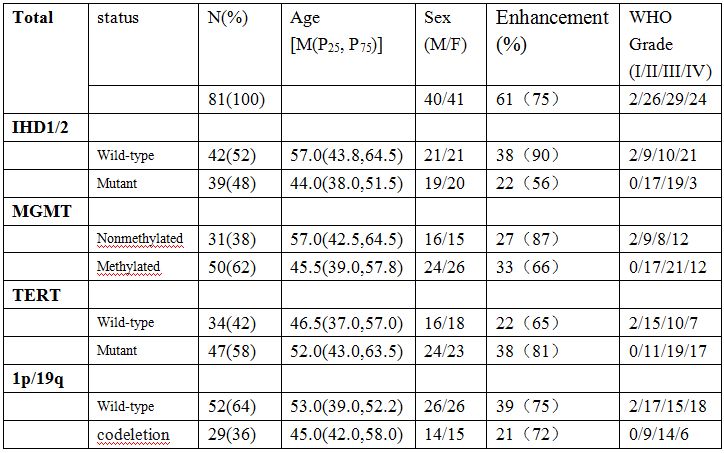
Table 1 Demographic Data for Each Glioma Biomarker
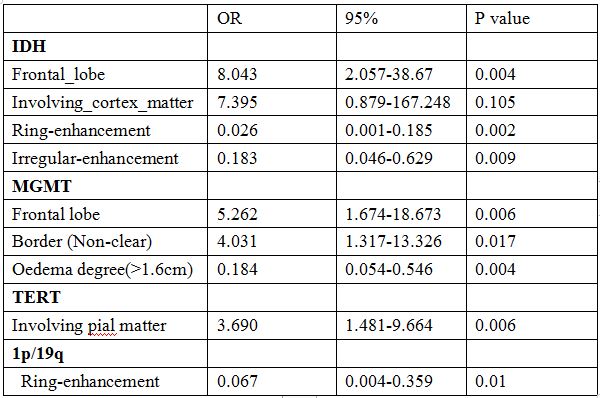
Table 2 Multivariate logistic regression analysis for each Glioma Biomarker
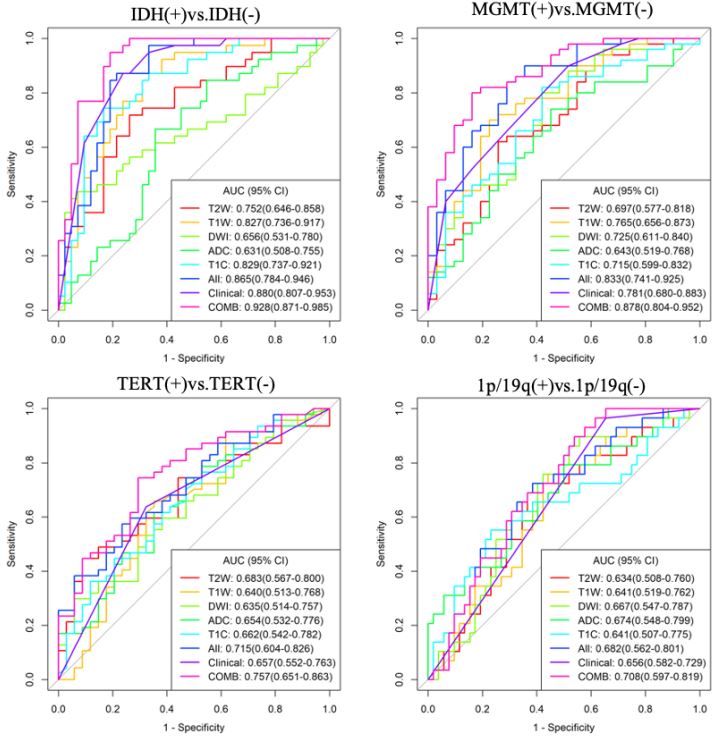
Figure 1. Receiver-operating characteristic (ROC) curves for prediction of each biomarker status. Combined model (COMB) which integrate clinical (clinical model, which combined clinical and imaging morphological characteristics) and radiomics features (all, combined radiomics model) shows significant improvement in predicting each biomarker status, especially in the group of IDH (0.928) and MGMT (0.878).
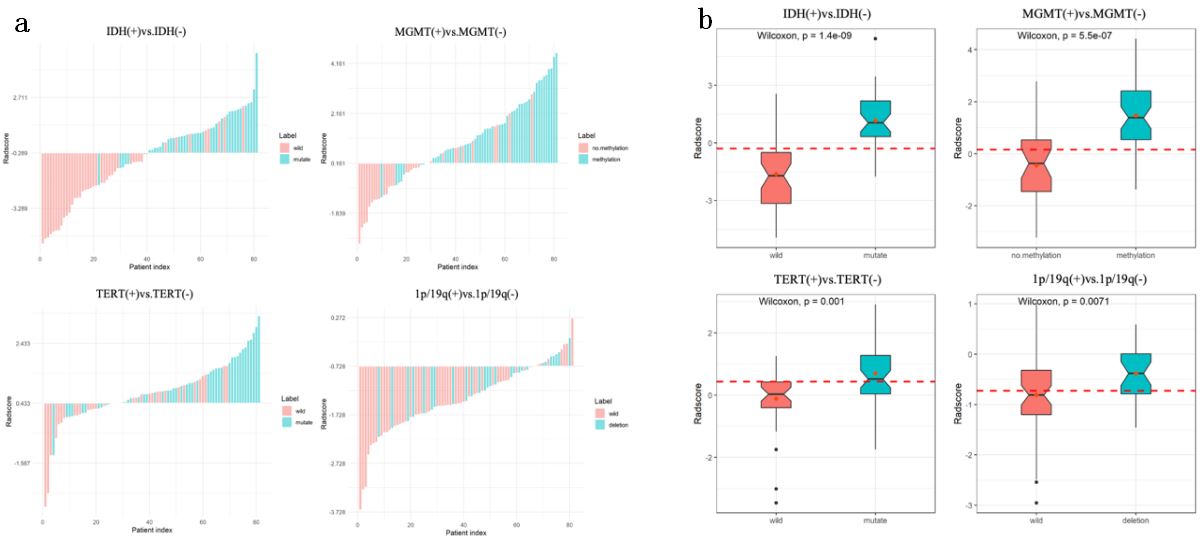
Figure 2. The bar (a)and box(b) chart of Radscore. The two charts showed a better performance in predicting each biomarker status, especially in group of IDH and MGMT.
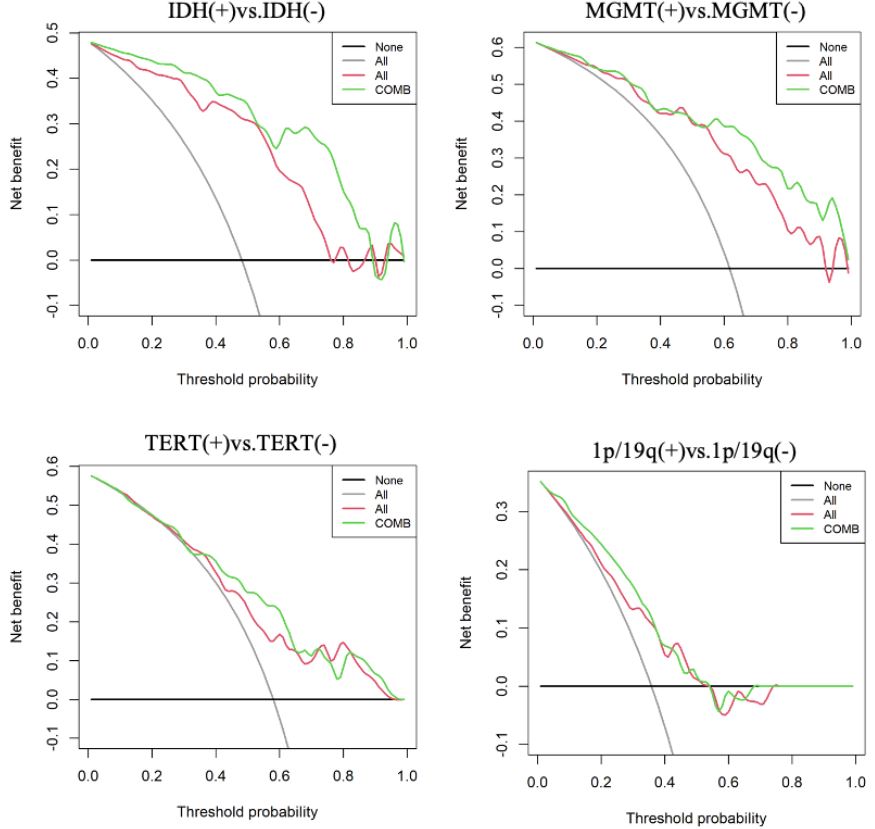
Figure 3. The decision curve analysis for combined radiomics model (all, combined all radiomic features from each sequence) and combined model (COMB, combined clinical and radimics features). The Y-axis represents the net benefit.