3626
Radiomics based characterization of peritumoral edema segmented from DCE MRI to differentiate glioblastoma from solitary brain metastasis1Philips Innovation Campus, Bangalore, India, 2Department of Radiology and Imaging, Fortis Memorial Research Institute, Gurugram, India, 3Indian Institute of Technology Delhi, Delhi, India, 4Department of Biomedical Engineering, Indian Institute of Technology Delhi, Delhi, India, 5Fortis Memorial Research Institute, Gurugram, India, 6SRL Diagnostics, Fortis Memorial Research Institute, Gurugram, India, 7Radiation Oncology, Fortis Memorial Research Institute, Gurugram, India, 8Department of Neurosurgery, Fortis Memorial Research Institute, Gurugram, India, 9BIU, Philips Innovation Campus, Bangalore, India
Synopsis
Edema in GB is characterized by the presence of tumor cells infiltration as compared to brain metastasis with only pure edema. Radiomics features extracted using FLAIR images in GB and BM are found to be exhibiting variation in some of the entropy and non-uniformity-based features, which could be used as signature to differentiate GB from brain metastasis.
Introduction
Differentiation of glioblastoma from solitary brain metastasis (BM) is challenging due to their similar appearance on MRI [1]. Glioblastoma (GB) originates in vivo from the brain parenchyma while metastasis seeds into the brain parenchyma from rest of the body. Both of these pathologies usually produce extensive peritumoral edema, central necrosis and variable hemorrhage. GB shows enhancing and non-enhancing components and tumor cells are seen with the edema apparent on imaging and have been validated on histopathology while metastatic lesions are not infiltrative with localized boundary defined by the post contrast study [2][3][4]. Differentiating edematous tissue (EDT) from non-enhancing-tumor tissue (NET) and identifying the clear peritumoral boundaries of EDT are some of the major challenges that are critical to their differentiation and management [5]. Conventional MRI is not yet successfully able to delineate EDT, especially in GB. Combination of FLAIR and DCE-MRI has, to some extent, segmented the EDT and NET tissue [6][7][8]. However, EDT segmented by this approach still demonstrates infiltration of tumor cells on histopathology. We hypothesize that certain radiomics features of edema seen in metastasis should be specific to differentiate peritumoral edema with infiltrating tumor cells from metastasis with no tumor cell infiltration within edema. Radiomic features of edema from subjects with meningioma were used as a baseline for understanding EDT having no tumor cell infiltrationsMethods
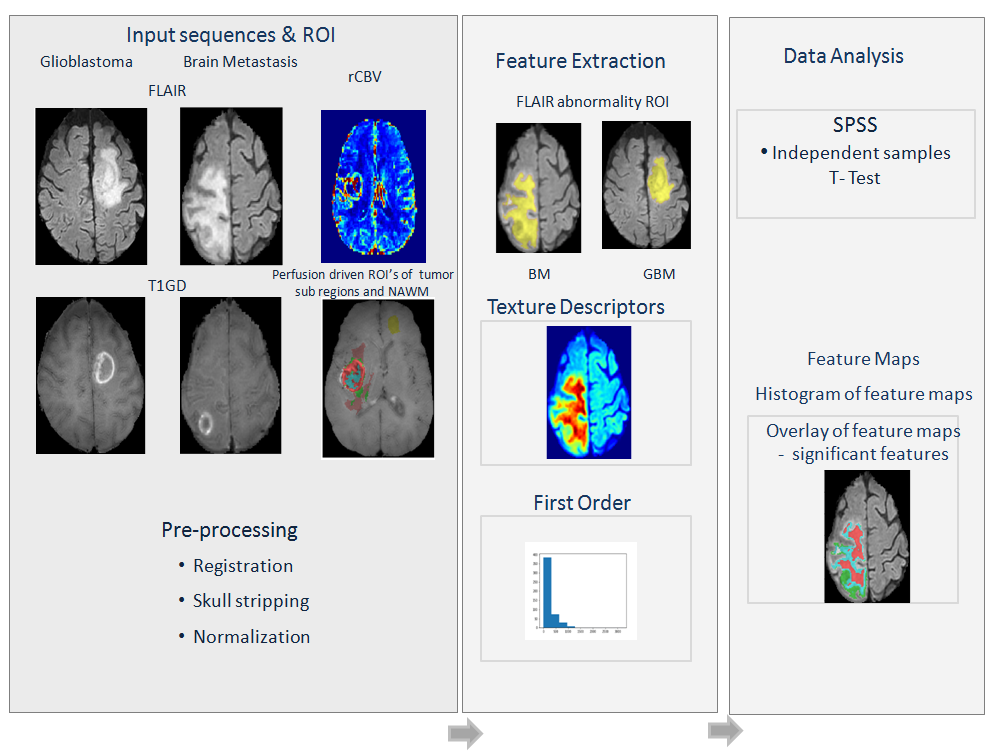
In this study 48 surgery naïve histologically proven GB and 21 BM subjects were evaluated. 6 subjects with meningioma were also considered for the purpose of characterizing pure edema seen in adjacent brain parenchyma. Subjects which didn’t have EDT segmented by the perfusion parameters were excluded in the study. Multimodal image acquisition was performed on Philips Ingenia 3T scanner with a 15-channel head coil, T1-weighted, FLAIR, T1-DCE MRI and post contrast T1GD images were acquired. DCE T1-perfusion MRI data analysis was carried using in-house code to generate perfusion parameters and kinetic parameters [8]. Respective demographics such as age span (AS) and male to female ratio (MFR) of the subjects are as follows; for meningioma AS (34-72 years), MFR (4:2), BM - AS (33-70 years), MFR (14:7) and GB - AS (34-71), MFR (30:18). The distribution pertaining to origin of BM from various cancers are as follows, lung carcinoma -12, breast -5, gastroenterology - 1, endometrial -2 and pancreatic -1. T1 perfusion parameters (CBF, rCBV etc.,) were computed which were used to generate tissue specific segmentation masks with the aid of SVM classifier [8]. Tumor sub-regions namely contrast enhancing tumor (ET) and necrosis (NEC) were delineated using post contrast (T1GD) sequence. Whereas, NET and EDT were delineated using FLAIR images and trained SVM model [8]. Subsequently, a 2D binary mask was extracted from the normal appearing white matter (NAWM) region on FLAIR image. Radiomics based feature extraction was implemented using PyRadiomics 2.2.0 library [8]. Radiomics features were extracted from the EDT ROI for subjects belonging to GB, BM and meningioma using FLAIR images. Same texture features were also extracted from the NAWM [9]. Statistical significance was computed for Radiomics features from EDT extracted between BM and meningioma and also computed for features between GB and BM – meningioma combined as one group [10]. The pipeline of the work implemented in this study is demonstrated in Figure 1Results
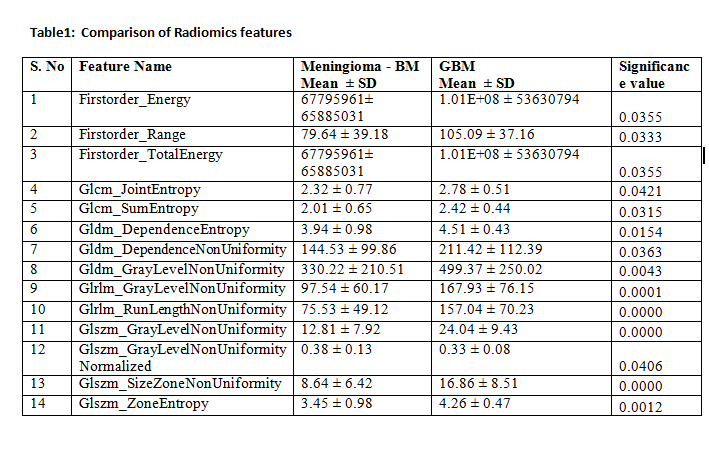
The input sequences and feature maps of representative images are shown in Figure 2. Comparison of Radiomics features across GB, BM - meningioma resulted in 14 significant features (Table 1). Radiomics features were statistically insignificant in the EDT regions between meningioma and BM and hence were combined as one group for its differentiation from GB edema. Radiomics features from EDT representing GB had higher values than BM and meningioma except for one feature. The representative feature map of one of the significant feature GLRM-Run length non-uniformity (GLRLM-RLNU) is depicted in the Figure 2Discussion
Results in this study indicate that Radiomics features were able to differentiate the texture variation across NAWM and EDT in GB, BM and meningioma. EDT features in BM and meningioma found to be insignificant. This might be due to the fact that there exists commonality in EDT across these two tumor types. Some of Radiomics features were significant to differentiate the EDT of GB from BM. This further substantiate that the EDT in GB has infiltrating tumor cells and differ from peritumoral edema seen in BM. Most of the significant features belonged to either entropy or non-uniformity categories. High entropy and non-uniformity in the GB features also may be aiding in the understanding of EDT in the GB which is known to contain tumor cells as compared to BM which is devoid of tumor cell infiltration in the perilesional edema. The histogram of the feature map obtained using EDT ROI indicates that the GB has feature values spread whereas in the case of BM the feature values seems to be skewed. These specific texture features may be of value in differentiating GB from solitary BM based on the edema features by demonstrating infiltration in GBAcknowledgements
No acknowledgement found.References
1. Lah T, Jiao X, Novak M et al., An update on glioblastoma biology, genetics, and current therapies: Novel inhibitors of the G protein-coupled receptor CCR5, Int. J. Mol. Sci., 2021: 22(9), 4464 doi: 10.3390/ijms22094464.
2. You SH, Yun TJ, Choi HJ et al., Differentiation between primary CNS lymphoma and glioblastoma: qualitative and quantitative analysis using arterial spin labeling MR imaging, Eur. Radiol., 2018: 28( 9), 3801–3810, doi: 10.1007/s00330-018-5359-5.
3. A. Sarkar and E. A. Chiocca, Glioblastoma and Malignant Astrocytoma, Brain Tumors, 2012, 384–407, doi: 10.1016/B978-0-443-06967-3.00021-1.
4. Blumenthal DT, Artzi M, Liberman G et al., Classification of high-grade glioma into tumor and nontumor components using support vector machine, Am. J. Neuroradiol., 2017:38 (5), 908–914, , doi: 10.3174/ajnr.A5127.
5. A. Lasocki and F. Gaillard, Non-Contrast-Enhancing Tumor: A New Frontier in Glioblastoma Research, Am. J. Neuroradiol., 2019: 40(5), 758–765, doi: 10.3174/ajnr.A6025.
6. Price SJ, Jena R, Burnet NG et al., Improved delineation of glioma margins and regions of infiltration with the use of diffusion tensor imaging: An image-guided biopsy study, Am. J. Neuroradiol., 2006: 27(9),1969–1974, doi: 10.1016/s0513-5117(08)79144-0.
7. T. R. Jensen and K. M. Schmainda, Computer-aided detection of brain tumor invasion using multiparametric MRI, J. Magn. Reson. Imaging, vol. 30, no. 3, pp. 481–489, 2009, doi: 10.1002/jmri.21878.
8. Sengupta A, Agarwal S, Gupta PK et al., On differentiation between vasogenic edema and non-enhancing tumor in high-grade glioma patients using a support vector machine classifier based upon pre and post-surgery MRI images, Eur. J. Radiol., 2018: 106, 199–208, doi: 10.1016/j.ejrad.2018.07.018.
9. Van Griethuysen JJM, Fedorov A, Parmar C, et al., Computational Radiomics System to Decode the Radiographic Phenotype. Cancer Research, 2017: 77(21), e104–e107,. doi: 10.1158/0008-5472.CAN-17-0339 10. Field, Andy. Discovering statistics using IBM SPSS statistics . say, 2013.
Figures