3625
Advanced diffusion-weighted imaging for differentiating between glioblastoma and primary central nervous system lymphoma1Radiology, Kagoshima University, Kagoshima, Japan, 2Neurosurgery, Kagoshima University, Kagoshima, Japan, 3Radiological Technology, Kagoshima University Hospital, Kagoshima, Japan, 4Siemens Healthcare GmbH, Erlangen, Germany, 5Siemens Healthcare K.K., Tokyo, Japan
Synopsis
To determine whether time-dependent DWI parameters and microscopic diffusion anisotropy (μFA) are useful for differentiating between glioblastoma and primary central nervous system lymphoma (PCNSL), 51 patients with glioblastoma and 13 with PCNSL were examined. In addition to ADC at two different diffusion times, ADC difference (ΔADC) and ADC change ratio (rcADC) were significantly different between the two tumor types, while no difference was shown for μFA. rcADC showed the best diagnostic performance followed by ΔADC.
INTRODUCTION
Preoperative differentiation between glioblastoma and primary central nervous system lymphoma (PCNSL) is problematic as they often show similar findings on conventional MR images. It has been well documented that lower ADC on diffusion-weighted imaging (DWI) helps diagnose PCNSL which is characterized by high cell density. Recently, more advanced DWI techniques have become available. Oscillating gradient spin-echo (OGSE) sequences1 allow for DWI with a short diffusion time, enabling time-dependent diffusion analysis which provides specific information regarding restricted diffusion. Double-diffusion-encoding (DDE) pulse sequences encode diffusion twice, along two directions, and enable quantification of microscopic fractional anisotropy (μFA) independent of orientation dispersion.2 Previous studies have suggested that μFA provides information regarding tumor cell morphology.3 Our purpose for this study was to determine whether these advanced DWI techniques are useful for differentiating between glioblastoma and PCNSL.METHODS
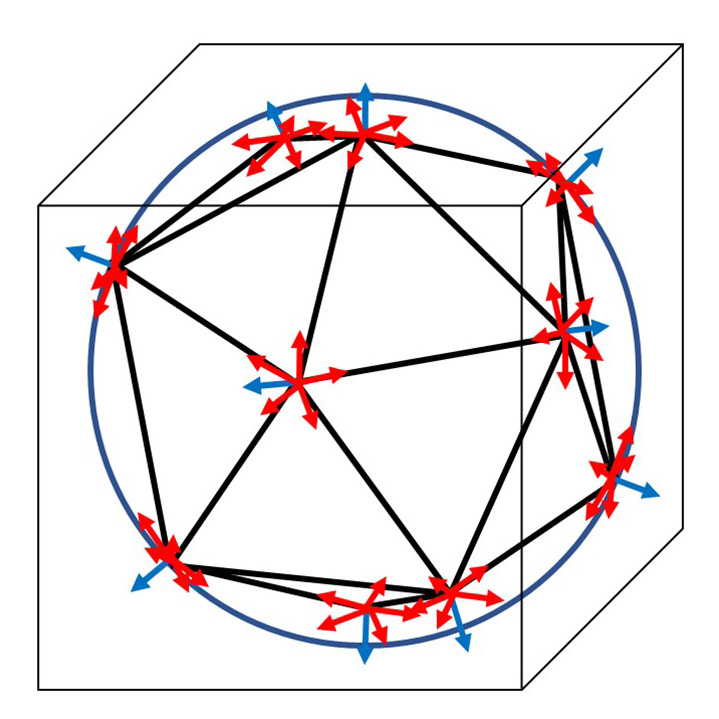
A retrospective study was performed on data acquired for 51 patients with glioblastoma (mean age, 68.3 ± 12.8 years) and 13 patients with PCNSL (mean age, 70.4 ± 10.7 years). All patients underwent preoperative MR imaging using a 3T system (MAGNETOM Prisma; Siemens Healthcare, Erlangen, Germany) with a 20-channel head/neck coil. Time-dependent DW images were acquired using a prototype DWI sequences with OGSE1 and pulsed gradient preparation (PGSE) (effective diffusion time [Δeff]: 8.5 ms and 44.5 ms, respectively) at b-values of 0 and 1500 s/mm2. ADC difference maps were generated to estimate the difference in ADC values between OGSE and PGSE sequences: ΔADC = ADC8.5ms - ADC44.5ms. ADC relative change maps were generated to estimate the ratio of change in ADC values between OGSE and PGSE sequences: rcADC = (ADC8.5ms - ADC44.5ms)/ADC44.5ms × 100 (%). μFA images were extracted from data acquired using a prototype single-shot echo planar DWI sequence with DDE. For the motion probing gradient directions, the double pulsed field diffusion gradient (d-PFG) 5-design (Fig 1) was used.4 The number of directions for b = 1000 s/mm2 was 72, including 12 parallel and 60 orthogonal combinations. The μFA was calculated according to the equation of Yang G et al.5 Instead of obtaining an additional standard diffusion tensor imaging dataset, we determined the ADC and fractional anisotropy (FA) using b = 0 s/mm2 and a part of b = 1000 s/mm2 of the d-PFG dataset corresponding to the parallel wave vectors. The mean values of ADC44.5ms, ADC8.5ms, ΔADC, rcADC, FA, and μFA in the enhancing tumor were compared between glioblastomas and PCNSLs using the Mann-Whitney U test. In addition, the diagnostic performances of the parameters were evaluated using receiver operating characteristic (ROC) curve analysis. The area under ROC curve (AUC) was compared using DeLong’s method. P < 0.05 was considered as statistically significant.RESULTS
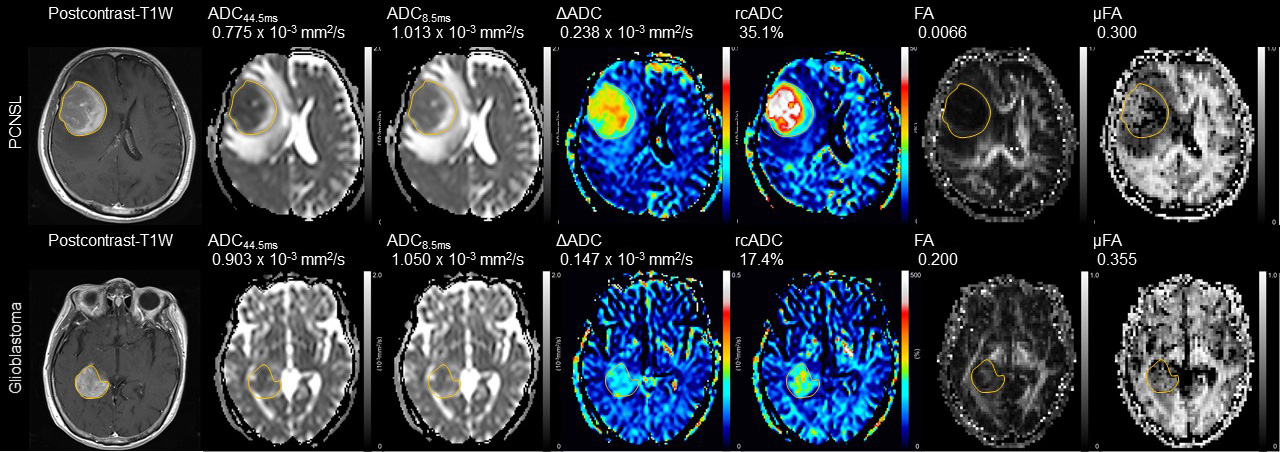
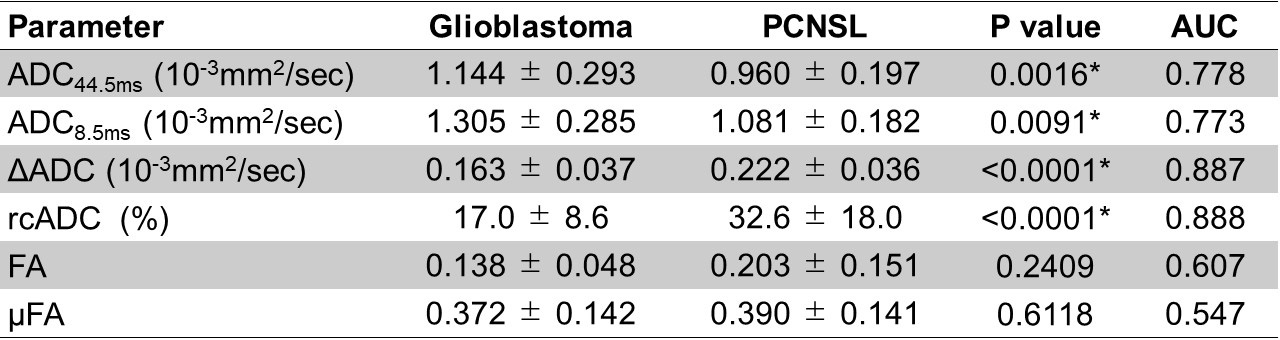
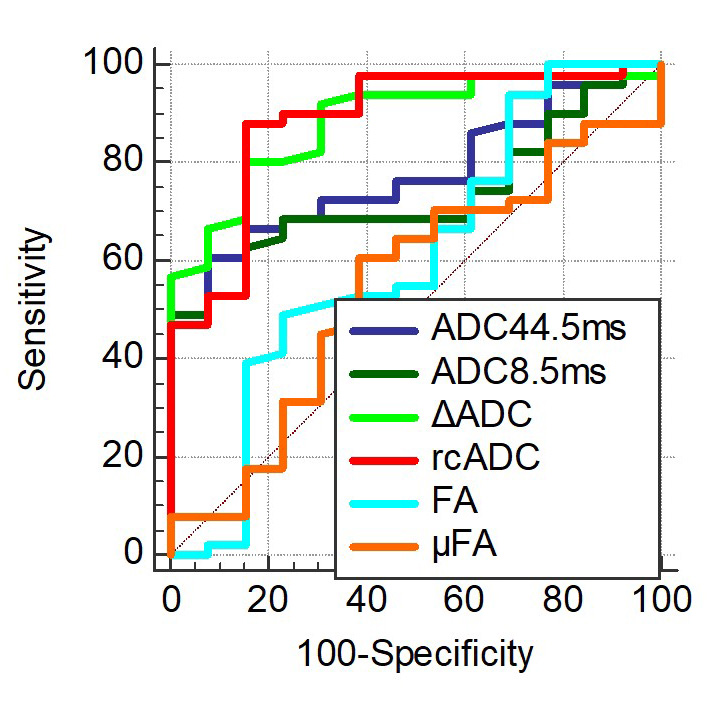
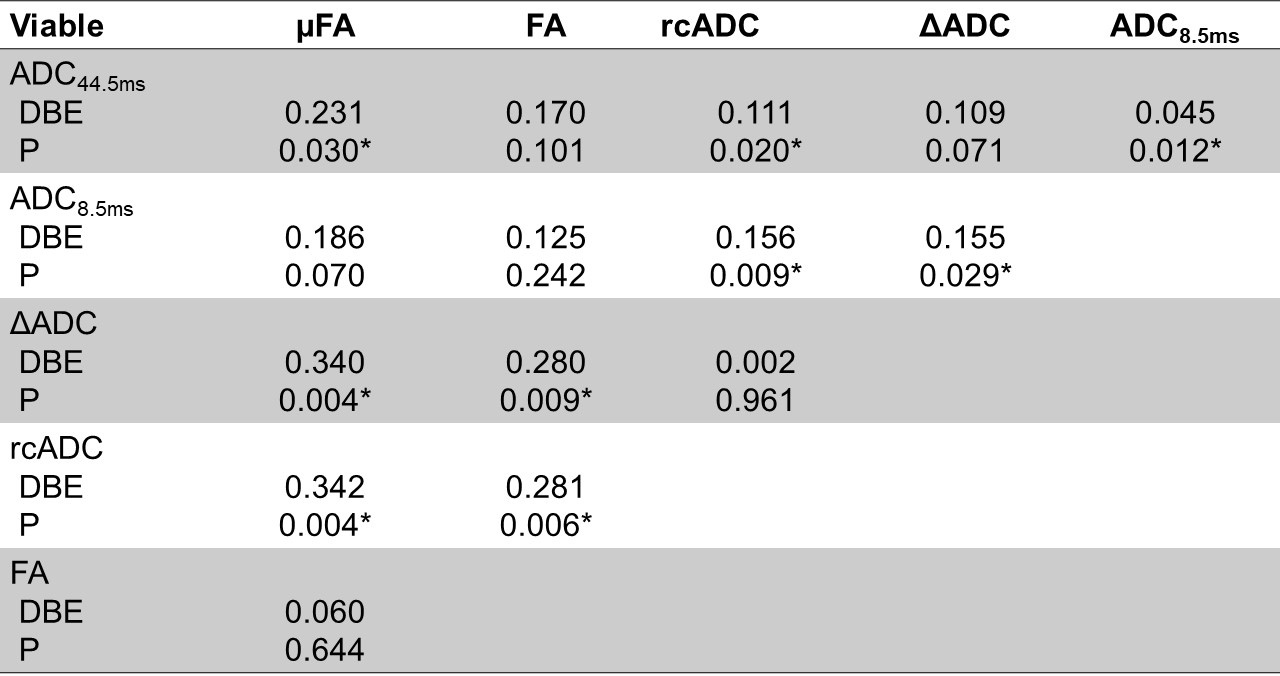
Representative cases and statistical results are shown in Fig 2 and Figs 3-5, respectively. The ADC44.5ms and ADC8.5ms (x10-3 mm2/s) of PCNSLs were significantly lower than those of glioblastomas (0.960 ± 0.197 vs. 1.144 ± 0.293; P = 0.0016, 1.081 ± 0.182 vs. 1.305 ± 0.285; P = 0.0091). The ΔADC (x10-3 mm2/s) and rcADC (%) of PCNSLs was significantly higher than those of glioblastomas (0.222 ± 0.036 vs. 0.163 ± 0.037; P < 0.0001, 32.6 ± 18.0 vs. 17.0 ± 8.6; P < 0.0001). There was no significant difference for FA and μFA between PCNSLs and glioblastomas (0.203 ± 0.151 vs. 0.138 ± 0.048; P = 0.2409, 0.390 ± 0.141 vs. 0.372 ± 0.142; P = 0.6118). The ROC curve analysis showed significance for ADC44.5ms, ADC8.5ms, ΔADC and rcADC (AUC = 0.778, 0.773, 0.887, 0.888; P <0.0001, 0.0003, <0.0001, <0.0001; respectively), but not for FA and μFA (AUC = 0.607, 0.547; P = 0.2855, 0.6123; respectively). The AUC for rcADC was significantly greater than that for ADC44.5ms, ADC8.5ms, FA and μFA (P = 0.020, 0.009, 0.006, 0.004; respectively), but not than that for ΔADC (P = 0.961). The AUC for ΔADC was not significantly different from that for ADC44.5ms (P = 0.071).DISCUSSION
The lower ADC44.5ms and ADC8.5ms in PCNSLs than those in glioblastomas are consistent with previous reports,6, 7 and likely reflect higher cell density in PCNSLs. The higher ΔADC and rcADC in the PCNSLs than those in glioblastomas indicates that restricted diffusion is more dominant in PCNSLs than in glioblastomas presumably due to abundant cell membrane of densely packed tumor cells in PCNSLs, which may result in stronger diffusion time dependency in ADC. The diagnostic performance of rcADC in differentiating between glioblastomas and PCNSLs was the highest with a significantly higher AUC than those of ADC44.5ms and ADC8.5ms, while the AUCs for rcADC and ΔADC were similar. These observations suggest that rcADC and ΔADC are useful DWI markers for distinguishing glioblastomas and PCNSLs. Lack of significant difference in μFA between PCNSLs and glioblastomas was somewhat unexpected. Difference in cell morphology between the two tumor types (irregular and pleomorphic cells in glioblastomas vs. homogeneously round cells in PCNSLs) was not reflected in μFA. Possible explanation for this negative result is relative preservation of background neuronal fibers in PCNSLs, which might have been associated with increased μFA, while destruction of neuronal fibers is more common in glioblastomas.CONCLUSION
Time-dependent DWI parameters, specifically rcADC and ΔADC are useful for differentiating between glioblastoma and PCNSL.Acknowledgements
No acknowledgement found.References
1. Schachter M, Does MD, Anderson AW, et al. Measurements of restricted diffusion using an oscillating gradient spin-echo sequence. J Magn Reson. 2000;147:232–237.
2. Shemesh N, Jespersen SN, Alexander DC, et al. Conventions and nomenclature for double diffusion encoding NMR and MRI. Magn Reson Med 2016;75:82–87.
3. Szczepankiewicz F, Lasic S, van Westen D, et al. Quantification of microscopic diffusion anisotropy disentangles effects of orientation dispersion from microstructure: applications in healthy volunteers and in brain tumors. NeuroImage 2015;104:241–252.
4. Ozarslan E. Compartment shape anisotropy (CSA) revealed by double pulsed field gradient MR. J Magn Reson 2009;199:56–67.
5. Yang G, Tian Q, Leuze C, et al. Double diffusion encoding MRI for the clinic. Magn Reson Med 2018;80:507–520.
6. Kickingereder P, Wiestler B, Sahm F,et al. Primary central nervous system lymphoma and atypical glioblastoma: multiparametric differentiation by using diffusion-, perfusion-, and susceptibility-weighted MR imaging. Radiology. 2014;272:843–850.
7. Choi YS, Lee HJ, Ahn SS, et al. Primary central nervous system lymphoma and atypical glioblastoma: differentiation using the initial area under the curve derived from dynamic contrast-enhanced MR and the apparent diffusion coefficient. Eur Radiol. 2017;27:1344–1351.
Figures