3623
The shared and disorder-specific temporal dynamics in degree centrality for patients with obsessive-compulsive disorder and schizophrenia
Yaxuan Wang1, Lekai Luo1, Qian Li1, Wanfang You1, Yuxia Wang1, Qian Zhang1, Su Lui1, Qiyong Gong1, and Fei Li1
1Huaxi MR Research Center (HMRRC), Department of Radiology, West China Hospital of Sichuan University, Chengdu 610041, Sichuan, P.R. China., Chengdu, China
1Huaxi MR Research Center (HMRRC), Department of Radiology, West China Hospital of Sichuan University, Chengdu 610041, Sichuan, P.R. China., Chengdu, China
Synopsis
Temporal dynamics in degree centrality (DC) were measured to detect alterations of dynamic topological organization in patients with obsessive-compulsive disorder (OCD) and schizophrenia (SZ). We found both patients with OCD and SZ showed decreased occurrence of a state manifested as the highest centrality in sensory systems. Moreover, we observed common and specific alteration of temporal variability of DC in some brain regions, which correlated with symptom severity of patients, respectively.
Introduction
OCD and SZ are both severe psychiatric disorders characterized by social disability and structural and functional disruption in brain networks. Though these two disorders have distinct typical symptoms, previous studies confirmed the partial polygenic overlap between them, and comorbid OCD is diagnosed in 7.8%–26% of patients with SZ1. However, few studies have explored the shared and disorder-specific brain function underlying the neural pathophysiology of the two disorders. DC, a graph theory based metric, measures the importance of nodes in a network2. Considering the brain is a highly dynamic system with rapidly changing activities, in the present study we focus on whether the DC dynamics were common or specific for the two disorders.Methods
Thirty-one patients with OCD, 49 patients with SZ, and 45 healthy controls (HCs) with matched age, sex, and education years were recruited (Table 1). The neuroimaging data of resting-state functional magnetic resonance imaging were collected using a 3T GE scanner (TR/TE=2000ms/30ms, flip angle=90°, slice thickness=5mm with no gap, voxel size=3.75×3.75×5mm3). After preprocessing, group independent component analysis was used to obtain 100 independent components (ICs) and 55 ICs were characterized as meaningful and sorted into eight functional networks (Fig. 1A). We used sliding-window approach (window size=22TR, step=1TR) to generate dynamic functional connectivity (dFC) matrices3. For each windowed dFC matrix, we calculated the DC for each IC. Then the time-varying DC patterns were clustered into three reoccurring states, and state transition metrics were obtained. We further explored the regional temporal variability of DC for each IC measured by coefficient of variation across all windows. One-way ANOVA and post-hoc tests with Bonferroni correction were used to assess group differences of all brain dynamic measures. Significance was set at P<0.05 with false discovery rate (FDR) correction for ANOVA, and false positive adjustment4 for temporal variability of DC. Finally, we explored the relationship between altered dynamic metrics and clinical measures (nominal significance P<0.05).Results
We found three time-varying DC states across all subjects: state 1 occurred most frequently (43.5%), characterized by the highest DC in default mode network; state 2 occurred in a moderate proportion (30.4%) and showed high DC in salience network (SAN) and executive control network; state 3 occurred in a low proportion (26.1%) and showed high DC in sensorimotor network (SMN) and auditory network (AUD) (Fig. 2). For state transition metrics, both patients with OCD and SZ showed decreased fractional time (P=0.002, Pcorrected=0.005; P=0.049, Pcorrected=0.147, respectively) and dwell time in state 3 (P=0.003, Pcorrected=0.008; P=0.005, Pcorrected=0.014, respectively) compared with HCs. We did not find significant group differences in other state transition metrics.For regional temporal variability of DC, both patients with OCD (P = 0.003, Pcorrected=0.009) and SZ (P=0.034, Pcorrected=0.102) showed significantly decreased temporal variability of DC in IC 38, which located in the superior frontal gyrus and belonged to SAN. Patients with SZ showed significant lower temporal variability compared with HCs (P=0.032, Pcorrected=0.096) and patients with OCD (P=0.009, Pcorrected=0.027) in IC 76, which located in the inferior occipital gyrus (IOG) and belonged to SMN. Moreover, we observed significant correlation between temporal variability of DC for IC 38 and obsessive-compulsive score in OCD (r = -0.489, P=0.030), and correlation between temporal variability of DC for IC 76 and Positive and Negative Syndrome Scale (PANSS) positive symptom score in SZ (r =0.433, P=0.008).
Discussion
For DC state analysis, we found both patients with OCD and SZ spent less time in state 3 featuring highest DC in sensory system (e.g., SMN, AUD). Consistently, previous studies have found decreased connectivity between sensorimotor/auditory areas and other brain regions in OCD and SZ5-7. Therefore, we speculate that our present finding that a lower occurrence of state 3 might underlie the decreased connectivity between SMN/AUD and other brain regions for the two disorders.For temporal variability of DC, both the two groups showed decreased dynamics of DC in superior frontal gyrus (belonged to SAN), but patients with OCD showed increased dynamics of DC in IOG (belonged to SMN) compared with controls and patients with SZ. Interestingly, previous researches suggested both patients with OCD and SZ exhibited decreased dFC involving areas of SAN8, 9, a crucial region for detecting salient stimuli and orienting attention to them; thus, the present result suggested that decreased dynamic interaction between regions of SAN and other brain areas may contribute to impaired behavioral flexibility and poor insight, resulting in core symptom of OCD and SZ9-11. Regarding the dynamics of DC in IOG, it can be served as a potential imaging marker to distinguish the two disorders. Moreover, we found altered dynamic DC correlated with clinical scores of patients with OCD and SZ, respectively, which further suggested dynamics of these brain regions could be treated as makers for symptom severity.
Conclusion
Both of patients with OCD and SZ showed decreased occurrence of a state manifested as the highest centrality in sensory systems. Moreover, we observed common and specific alteration of regional DC dynamics, which correlated with symptom severity of patients. Our study provided evidence of tight association of the two disorders on the psychopathological level as well as potential imaging markers to distinguish the two disorders.Acknowledgements
No acknowledgement found.References
- Meier, S.M., et al., Obsessive-Compulsive Disorder as a Risk Factor for Schizophrenia A Nationwide Study. Jama Psychiatry. 71(11),1215-1221 (2014).
- Zuo, X.N., et al., Network centrality in the human functional connectome. Cereb Cortex. 22(8),1862-75 (2012).
- Allen, E.A., et al., Tracking whole-brain connectivity dynamics in the resting state. Cereb Cortex. 24(3),663-76 (2014).
- Fornito, A., et al., General and specific functional connectivity disturbances in first-episode schizophrenia during cognitive control performance. Biol Psychiatry. 70(1),64-72 (2011).
- Mayer, A.R., et al., Proactive response inhibition abnormalities in the sensorimotor cortex of patients with schizophrenia. J Psychiatry Neurosci. 41(5),312-21 (2016).
- Zhang, X., et al., Disrupted structural covariance network in first episode schizophrenia patients: Evidence from a large sample MRI-based morphometric study. Schizophr Res. 224,24-32 (2020).
- Cui, G., et al., Altered Global Brain Functional Connectivity in Drug-Naive Patients With Obsessive-Compulsive Disorder. Front Psychiatry. 11,98 (2020).
- Luo, L., et al., Altered brain functional network dynamics in obsessive-compulsive disorder. Hum Brain Mapp2021).
- Supekar, K., et al., Dysregulated Brain Dynamics in a Triple-Network Saliency Model of Schizophrenia and Its Relation to Psychosis. Biol Psychiatry. 85(1),60-69 (2019).
- Menon, V., Large-scale brain networks and psychopathology: a unifying triple network model. Trends Cogn Sci. 15(10),483-506 (2011).
- Fan, J., et al., Resting-state functional connectivity between right anterior insula and right orbital frontal cortex correlate with insight level in obsessive-compulsive disorder. Neuroimage Clin. 15,1-7 (2017).
Figures
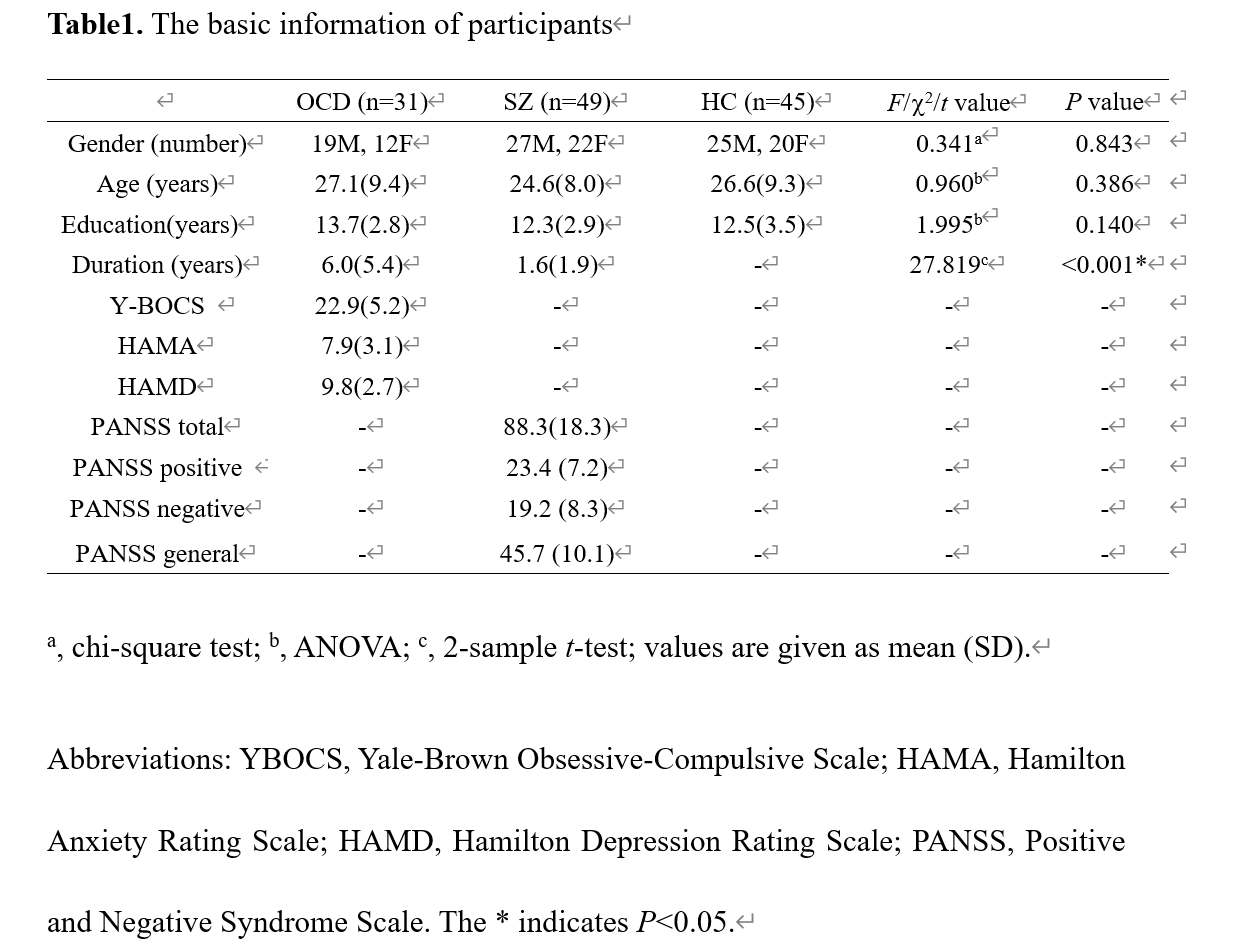
Table1.
The basic information of participants.
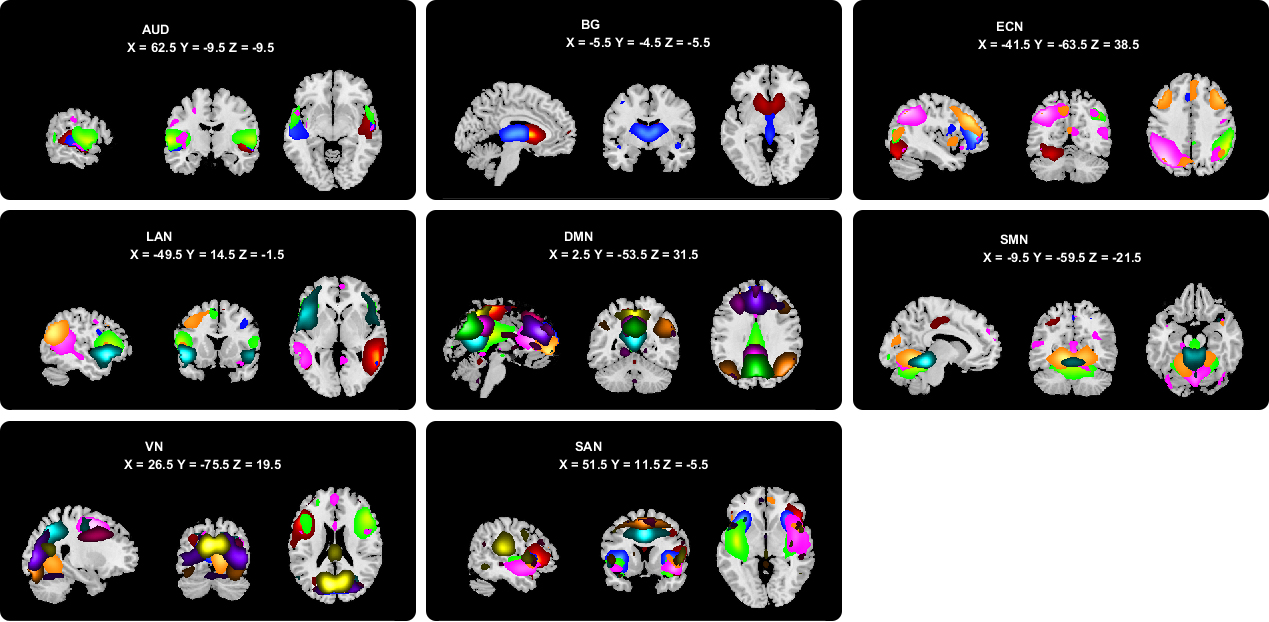
Fig.1 The 55 independent components (ICs) were divided
into eight functional networks: auditory
network (AUD), default mode network (DMN), executive control network (ECN), language
network (LAN), salience network (SAN), subcortical network (SC), sensorimotor
network (SMN), and visual network (VN).
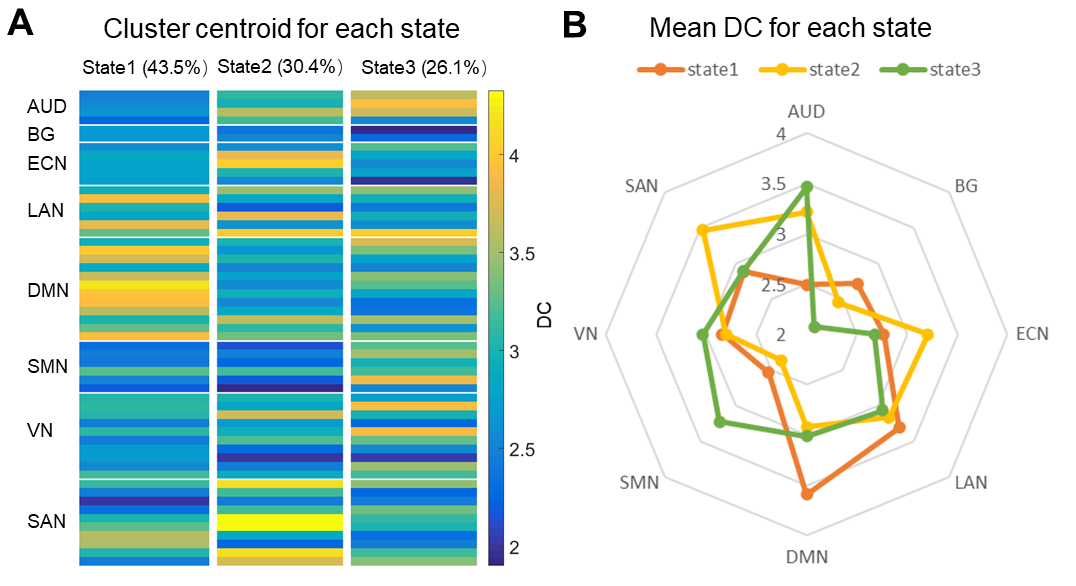
Fig. 2.
A. Cluster centroids of time-varying degree centrality (DC) patterns. B.
The radar map of mean DC of each network for three states.
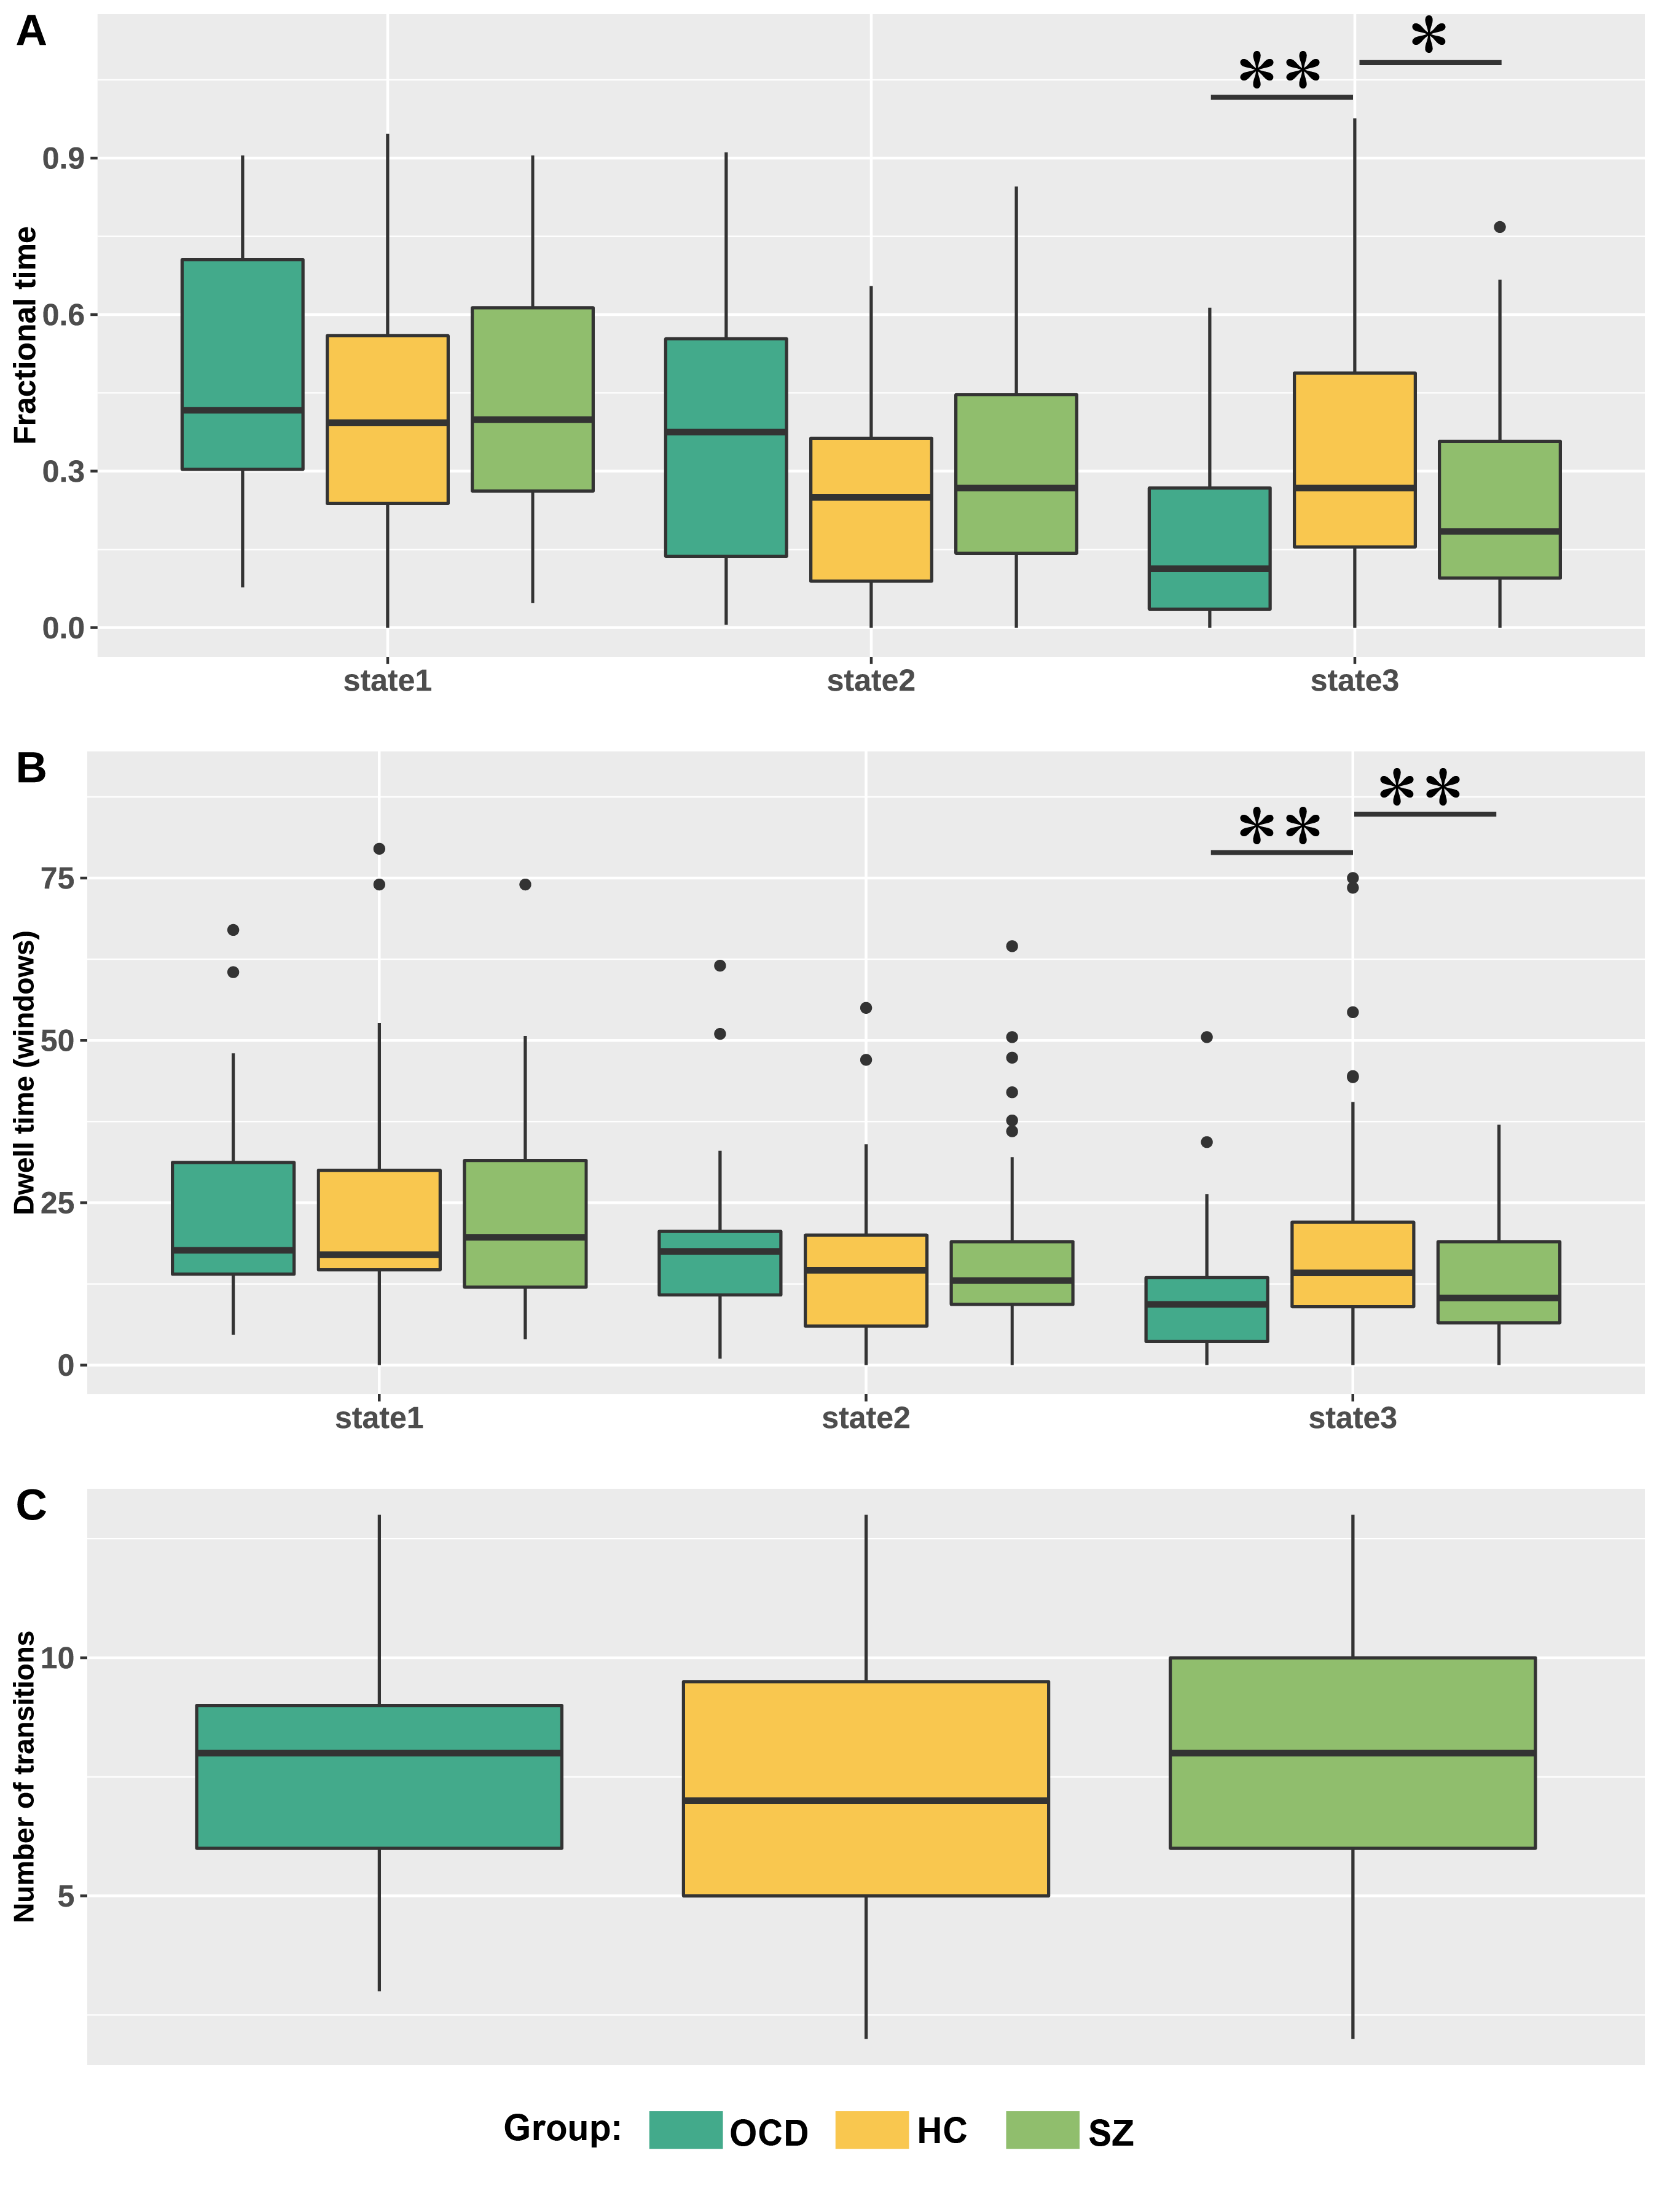
Fig. 3. Group comparisons of state
transition metrics. A. Patients with OCD and SZ showed decreased
fractional time in state 3 compared with HCs. B. Patients with OCD and
SZ showed dwell time in state 3 compared with HCs. C. No significant
group difference of number of transitions. The * represents P<0.05 and the ** represents corrected P < 0.05.
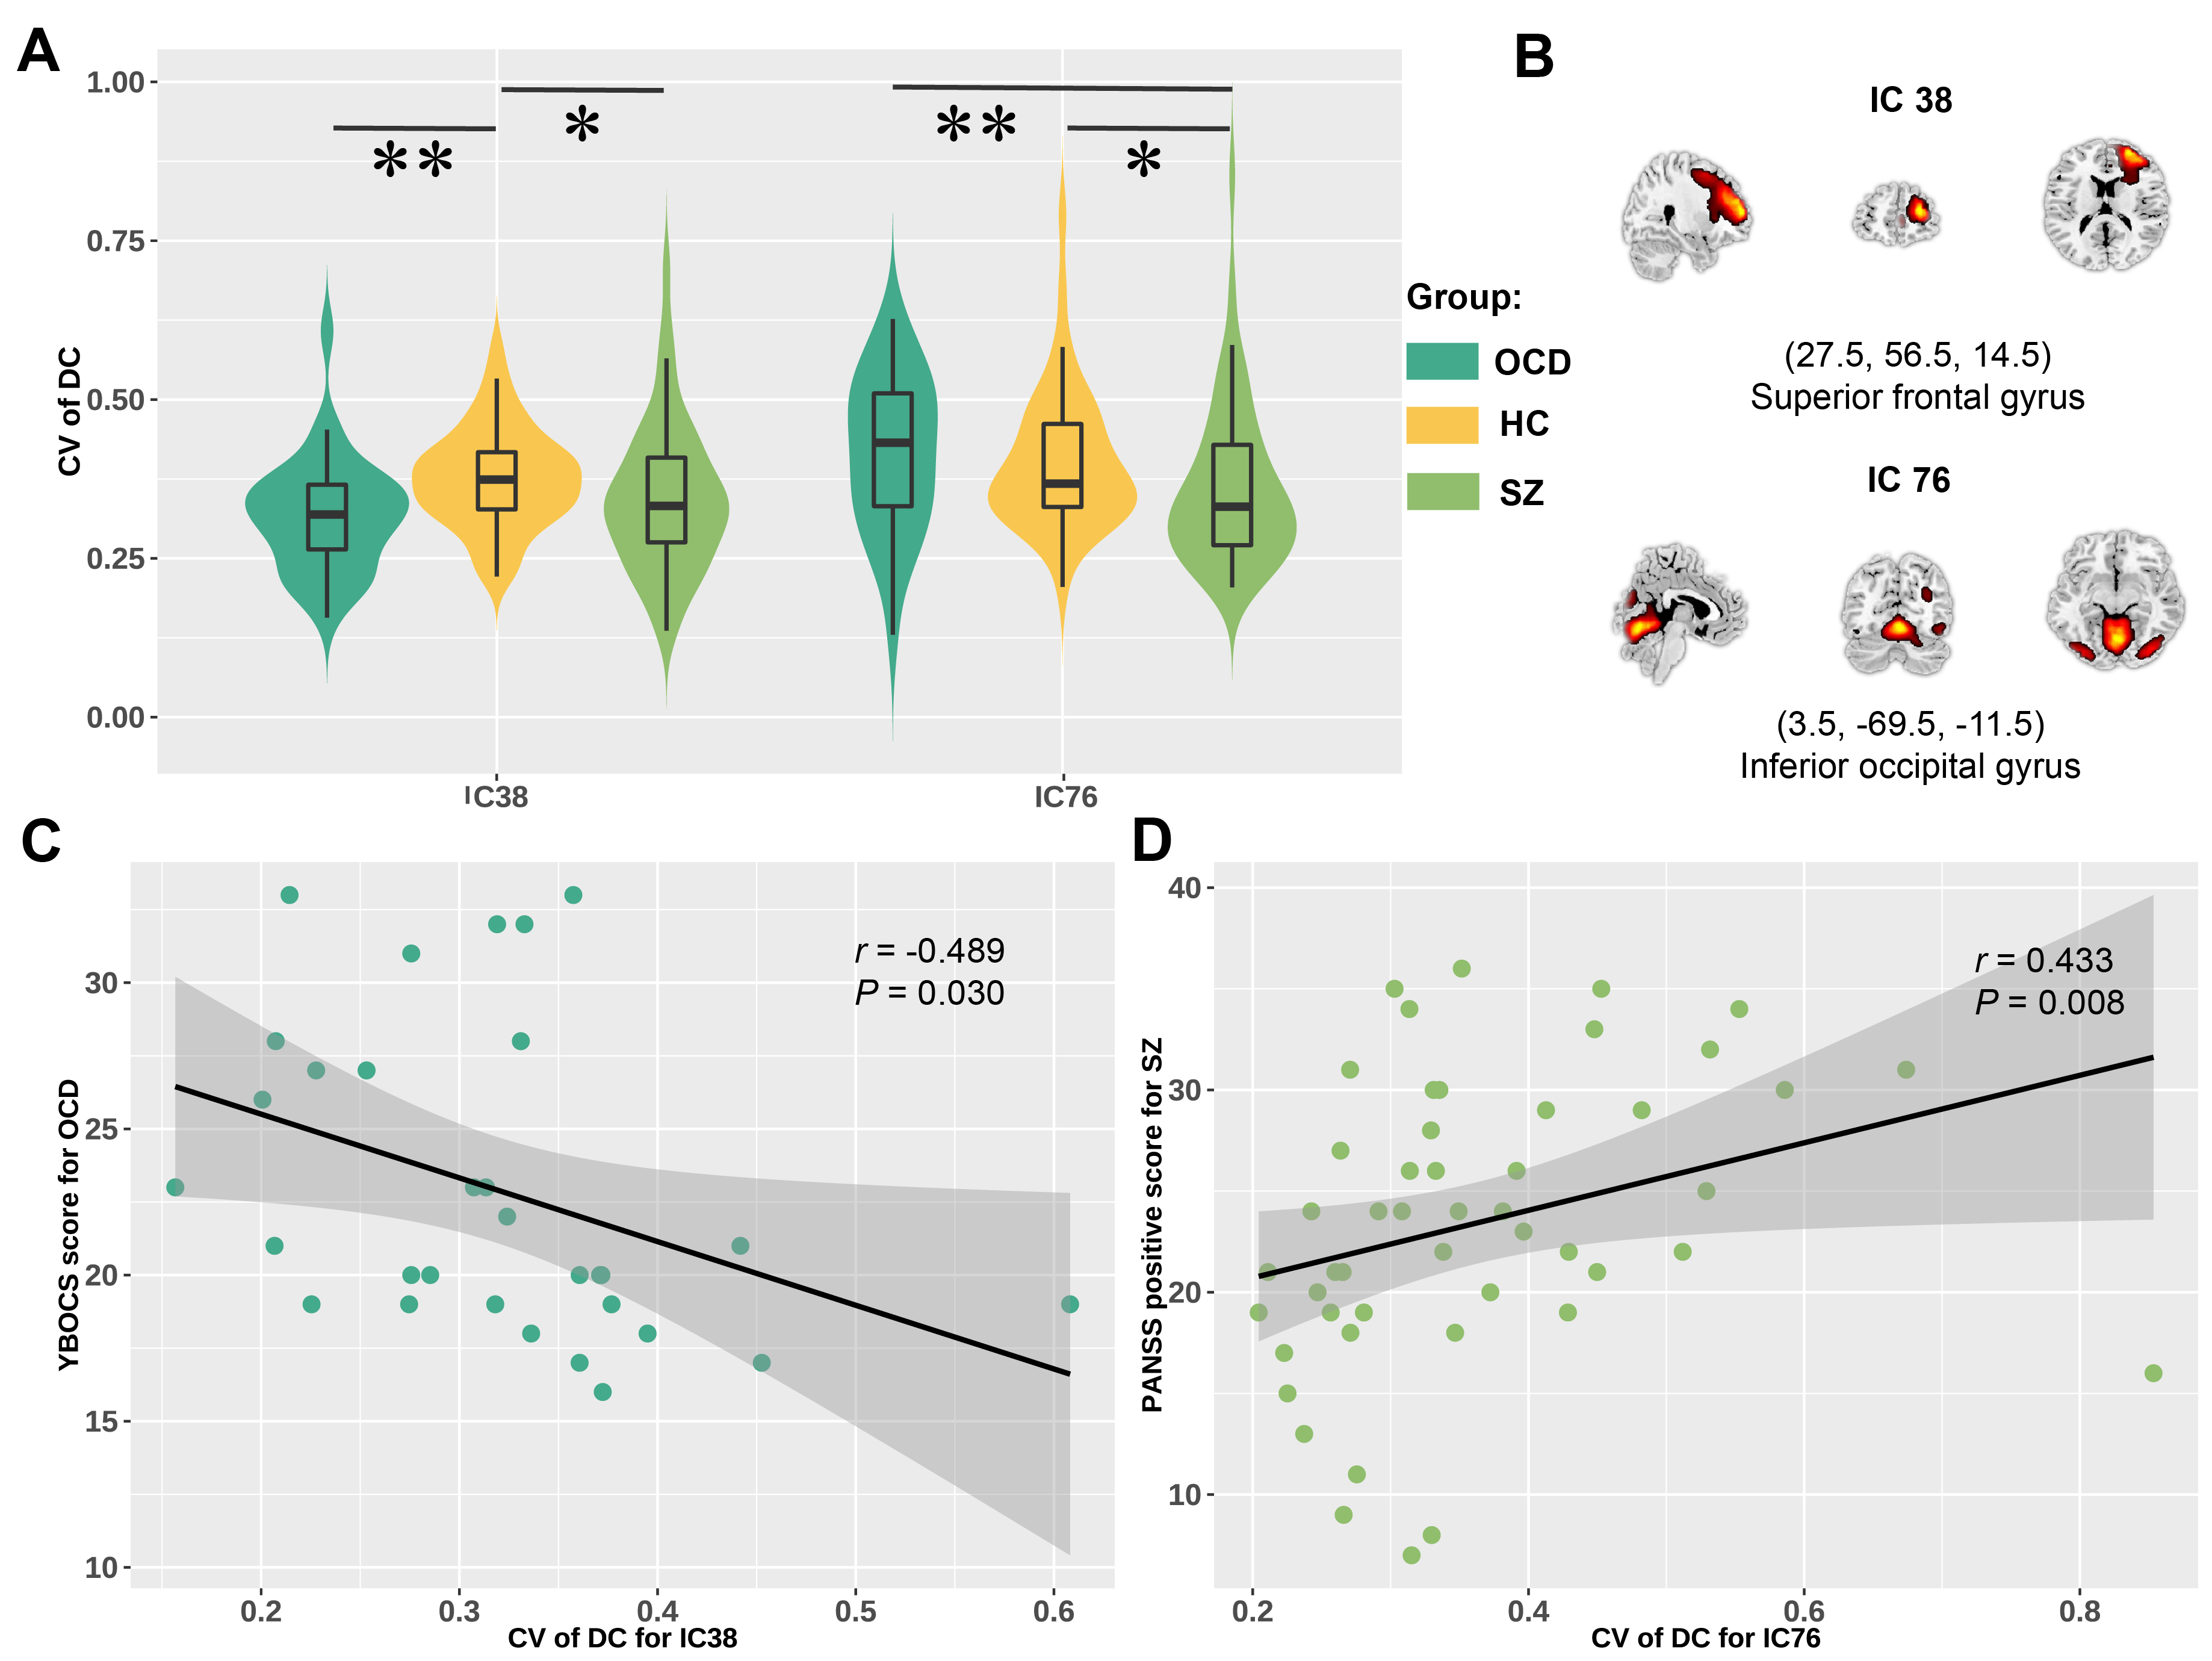
Fig. 4. A. Group
comparisons of temporal variability of DC. B. Spatial maps of IC 38 and
IC 76. C. Significant correlations between temporal variability of DC
for IC 38 and obsessive-compulsive score in OCD. D. Significant
correlation between temporal variability of DC for IC 76 and PANSS positive
symptom score in SZ. The * represents P<0.05 and the ** represents
corrected P < 0.05.
DOI: https://doi.org/10.58530/2022/3623