3620
Differentiation of hormone secretion related pituitary macroadenomas using Amide Proton Transfer weighted imaging1Department of Magnetic Resonance,Lanzhou University Second Hospital, Lan Zhou, China, 2Philips Healthcare, Xi'an, China
Synopsis
Advanced radiological modalities such as Amide Proton Transfer weighted imaging (APTw) may be useful in probing biological tissue properties of pituitary adenomas. The objective of the present study was to examine APTw derived APT value to noninvasively and quantitatively measuring pituitary adenomas. Moreover, the correlation analysis was performed between ATP value and hormone secretion to validate the efficiency of ATP value in differentiate hormone secretion related pituitary adenomas.
Introduction
It is very important to differentiate different types of pituitary macroadenomas because they frequently lead to the presence of chiasmatic syndrome. The classification of pituitary tumors is based on the staining properties of the cell cytoplasm viewed by light microscopy and immunocytochemistry revealing the secretory pattern of the adenoma1. Due to hormonal levels, pituitary macroadenomas can be classified as hyper-secreting, non-secreting, hypo-secreting subtypes. Noninvasive radiological biomarkers that can predict pituitary adenoma hormone secretion is useful for predicting the extent of hormonal secretion, and identifying cases in which transcranial surgery may be appropriate. Amide proton transfer weighted (APTw) imaging is a novel molecular MRI technique to detect endogenous mobile proteins and peptides through chemical exchange saturation transfer noninvasively. In this preliminary study, we aimed to quantitative evaluating whether APT value can be used as a reliable index to differentiate different types of pituitary adenomas. Correlation analysis was further performed between APT value and hormone secretion.Methods
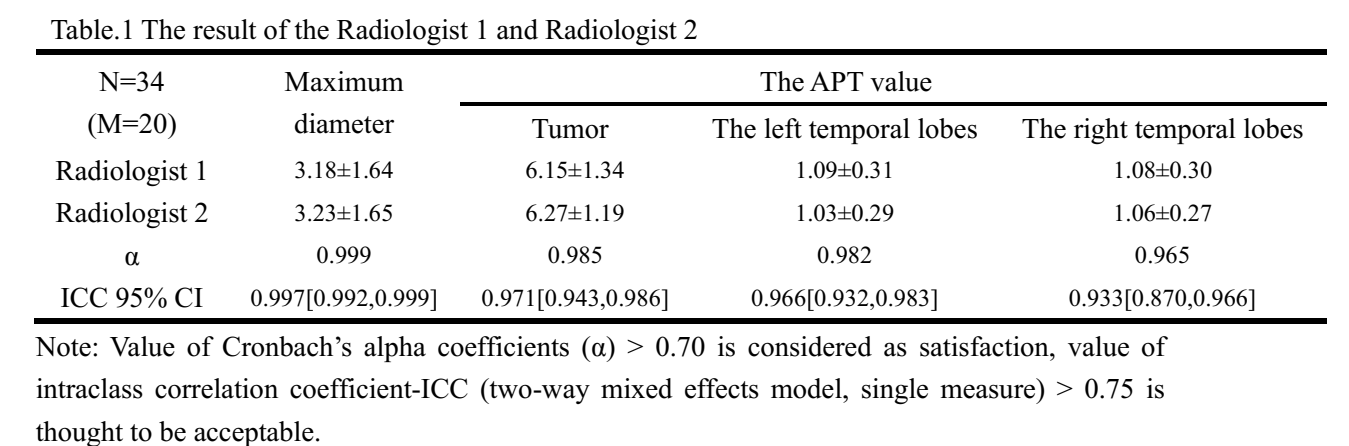
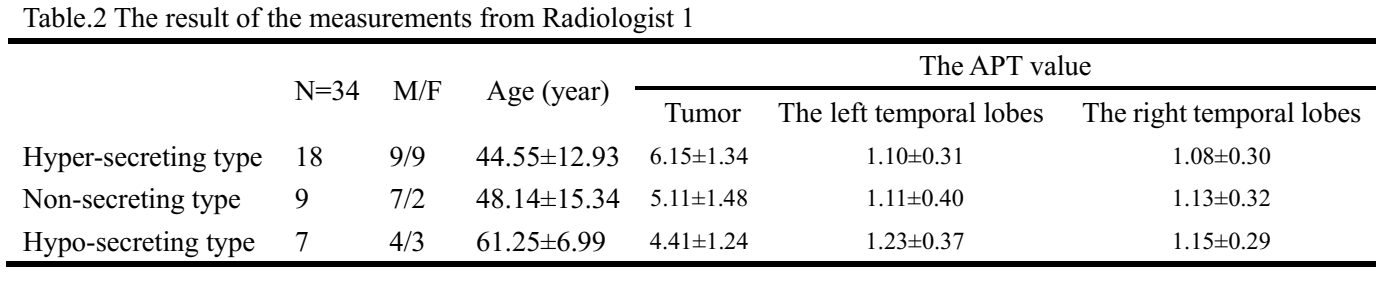
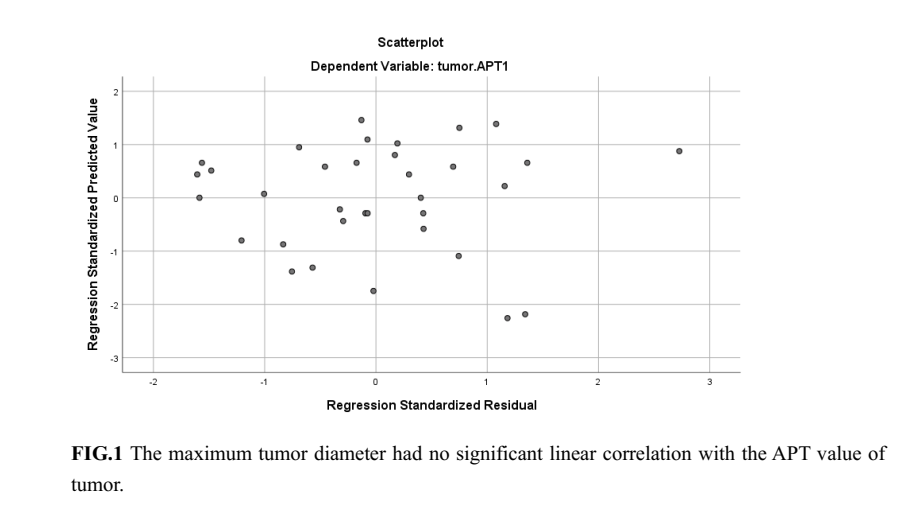
Thirty-four preoperative patients with pituitary adenomas were recruited. Patients were scanned using a 3.0 T MR scanner (Ingenia CX, Philips Healthcare, the Netherlands) with a 32-channel head coil. Then all patients were divided into three groups: 18 subjects with hyper-secreting type (9 males; mean age ± standard deviation: 44.55±12.93 years), 9 subjects with non-secreting type (7 males; 48.14±15.34 years), 7 subjects with hypo-secreting type (4 males; 61.25±6.99 years). All participants hormone profile were assessed by biochemical detection. Imaging of the sellar region included the following sequences: coronal pre-contrast two-dimensional (2D) T2-weighted turbo spin-echo (TSE) imaging (repetition time [TR] /echo time [TE] = 3000/90 ms, matrix = 276 × 235, FOV = 170 × 180 mm2, slice thickness/gap = 2.5/0.25 mm). Coronal APT imaging using 3D TSE-DIXON sequence (TR/TE = 6515/8.8ms, matrix = 100×100, FOV = 180×180 mm2, flip angle=90°, slice thickness/gap = 4/0 mm). APT value was obtained through Philips Intellispace Portal. Two board-certified radiologists (both > 5 years’ experience) localized the pituitary on coronal pre-contrast 2D T2-weighted images and APTw images. they manually measured the maximum tumor diameter of the pituitary macroadenoma on the coronal pre-contrast 2D T2-weighted TSE images using a distance measurement function of a PACS workstation. Regions of interest (ROIs) were drawn over the tumor on the coronal slice of maximum lesion on the APT image conservatively to avoid tumor boundaries and minimize partial volume effects. Areas with increased signal distortion were excluded from ROI measures to reduce the role of air-tissue interface artifacts. Equivalent ROIs were placed in the gray matter of the left and right temporal lobes on the slice with the greatest tumor cross-sectional area to accommodate for any B0 field inhomogeneity. Internal consistency was measured by the Cronbach's alpha coefficient (α) and the stability of the questionnaire was evaluated by estimating interclass correlation coefficient (ICC). The association between the APT value and the maximum tumor diameter was evaluated by using simple linear regression analysis.Results
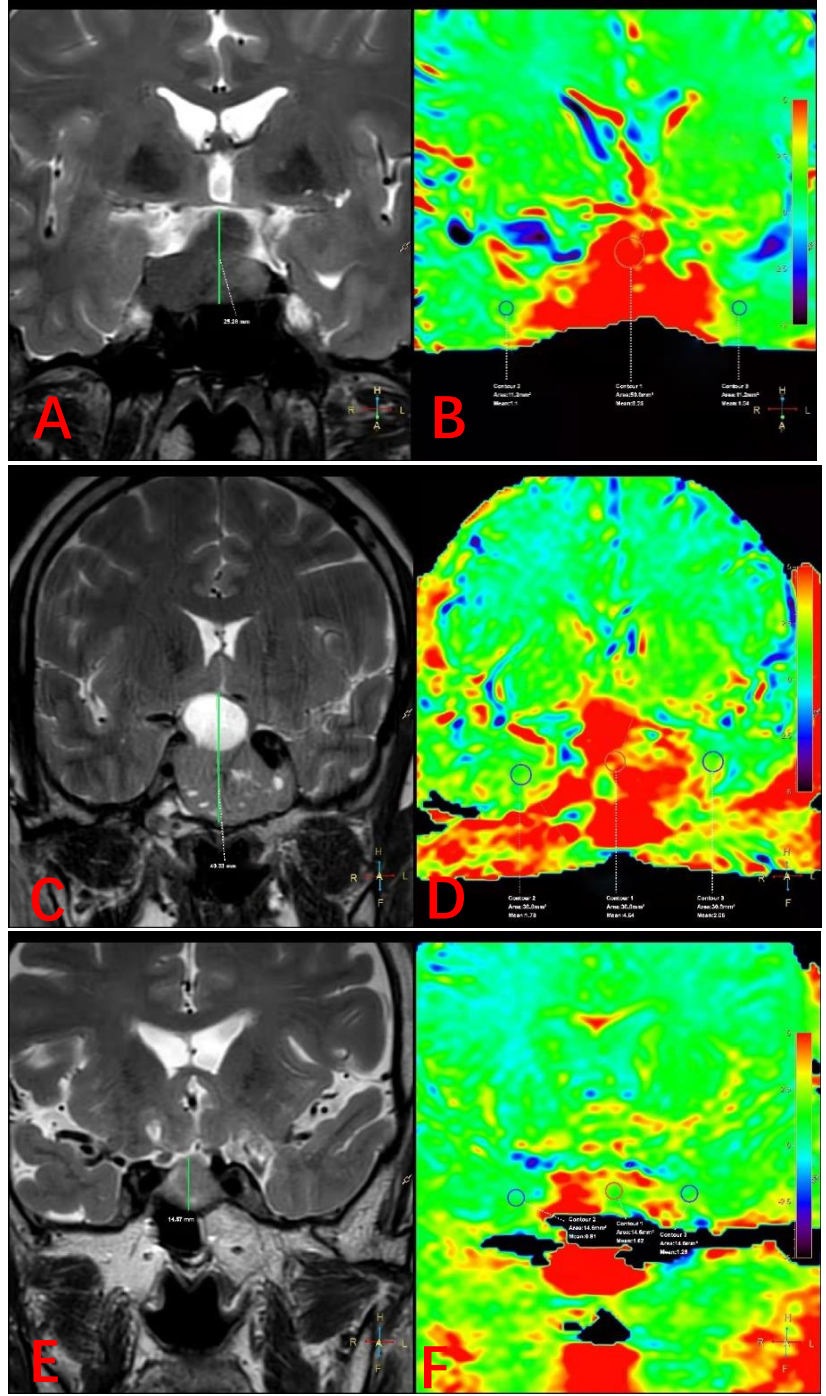
For both radiologists, the agreement between the MRI-based localization and the intraoperative findings increased after referring to the APT value and the maximum tumor diameter of the pituitary macroadenoma (Table 1). The APT value of hyper-secreting type pituitary macroadenoma was significantly higher than the hypo-secreting ones (P = 0.001) (Table 2). The APT value between hyper-secreting type and non-secreting type, non-secreting type and hypo-secreting type pituitary macroadenoma showed no statistically significant, respectively (P = 0.196, P = 0.182). The maximum tumor diameter had no significant linear correlation on the APT value of tumor (R Square=0.006, unstandardized coefficients B=-0.085, P=0.662, P>0.05) (Fig.1). The APT value of the gray matter of the left and right temporal lobes on the slice with the greatest tumor cross-sectional area lower than pituitary macroadenoma in three groups, respectively. Figure 2 showed three typical patients with different subtype pituitary macroadenoma.Discussion
In our study, we determined that APT imaging is able to predict the hormone secretion of pituitary macroadenoma. As a result of the normal pituitary gland itself produces hormones and have high proteins and peptides, The circulating hormone’s negative feedback of Hypothalamic–Pituitary–Gonadal (HPG) axis can stimulate pituitary hyperplasia or atrophy. Hyper-secreting type and hypo-secreting type pituitary macroadenoma may tend to be the non-secreting type shape. The APT value between hyper-secreting and non-secreting type, non-secreting and hypo-secreting type pituitary macroadenoma shows no significant statistically differences, respectively. However, Hyper-secreting pituitary macroadenomas are highly cellular secretory function and have a higher cellular content of proteins and peptides than the hypo-secreting pituitary macroadenoma. The APT value between hyper-secreting type and hypo-secreting pituitary macroadenoma shows significantly statistical difference. It also revealed by MRI-guided proteomics and in vivo MR spectroscopy,2,3 and it has been assumed that amide proteins of endogenous mobile proteins and peptides in the cytoplasm are the major source of the APT signals4. Linear relationship does not exist between the APT value of pituitary macroadenoma and the tumors size. It maybe further indicates that the APT value is related to hormone secretion of tumor cells in pathology.Conclusion
This study demonstrated the APT imaging can be used to differentiate hormon-related pituitary adenoma. The APT value may provide early imaging biomarkers for the early evaluation in pituitary adenoma diagnosis and treatment.Acknowledgements
No acknowledgement found.References
1.Chanson P, Salenave S. Diagnosis and treatment of pituitary adenomas. Minerva Endocrinol. 2004;29(4):241-275.
2. Hobbs, S. K. et al. Magnetic resonance image-guided proteomics of human glioblastoma multiforme. J Magn Reson Imaging 18,530–536, https://doi.org/10.1002/jmri.10395 (2003).
3. Howe, F. A. et al. Metabolic profiles of human brain tumors using quantitative in vivo H-1 magnetic resonance spectroscopy. Magnet Reson Med 49, 223–232, https://doi.org/10.1002/mrm.10367 (2003).
4. Zhou, J., Lal, B., Wilson, D. A., Laterra, J. & van Zijl, P. C. Amide proton transfer (APT) contrast for imaging of brain tumors. Magn Reson Med 50, 1120–1126, https://doi.org/10.1002/mrm.10651 (2003).
Figures