3619
Diffusion-Relaxation Correlation Spectrum Imaging for the Assessment of Pituitary Macroadenomas Consistency: A Preliminary Study1Department of Radiology, The First Affiliated Hospital of Nanjing Medical University, Nanjing, China, 2United Imaging Healthcare, Shanghai, China
Synopsis
Preoperative evaluation of the consistency of pituitary macroadenomas plays a significant role in the determination of the surgical strategy. However, previous studies concerning the assessment of tumor consistency of macroadenomas were controversial1-4. Diffusion-relaxation correlation spectrum imaging (DR-CSI), which provides a correlation spectrum of both water molecular diffusion and T2 relaxation, could be used to resolve the information of tissue compositions, compartments, and heterogeneity at a sub-voxel level. The purpose of our study is to evaluate the utility of DR-CSI in assessing the consistency of pituitary macroadenomas.
Introduction
Pituitary adenomas (PA) are the most common lesions of the sella turcica5. Most pituitary macroadenomas are soft and easily resectable by the endoscopic transsphenoidal technique; while about 10% of pituitary macroadenomas may be fibrous and firm. Macroadenomas with hard components cannot be successfully removed with the endoscopic technique, and may require a second-stage operation, stereotactic radiosurgery, or a transcranial approach6-7. Therefore, preoperative evaluation of the consistency of macroadenomas is quite important for the surgical approach planning and the avoidance of over surgical procedures.As a non-invasive imaging modality, MRI has been considered as an effective routine method to assess PA, although tumor consistency of pituitary macroadenoma remains controversary. Conventionally, T2-weighted imaging (T2WI) and diffusion weighted imaging (DWI) are the most common sequences used to assess PA. Some researchers reported that hard tumors resulted in hypointensity on T2WI1-2, whereas others found no correlation between the consistency of PA and their conventional MRI appearances3. Moreover, Pierallini et al1 reported that adenomas with a harder consistency at surgery had higher ADC values, while Su CQ et al4 reported the opposite results. Therefore, the utility of MRI in assessing tumor consistency of pituitary macroadenoma has not yet been established.
The diffusion-relaxation correlation spectrum imaging (DR-CSI) based on two-dimensional data points obtained by echo-planar imaging (EPI) sequence with a combination of TE and b-values has been proved to successfully resolve information of tissue compositions, compartments, and heterogeneity at a sub-voxel level 8-9. In this work, we aimed to evaluate DR-CSI for the determination of the consistency of pituitary macroadenomas.
Methods
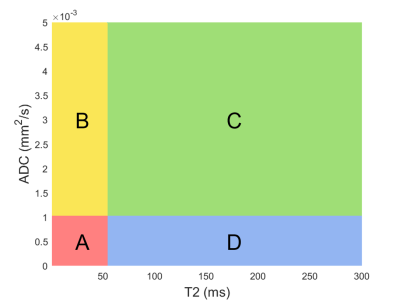
Twenty-one patients with pituitary macroadenoma (10 men, 11 women; mean age, 49.4±14.6 years; range, 23~73 years) were included. All MRI examinations were performed on a 3.0 T MR scanner (uMR 770, United Imaging Healthcare, Shanghai, China). MR sequences included: T1-weighted image (T1WI), T2WI, contrast-enhanced T1WI, and DWI. DR-CSI was performed based on EPI sequence with 36 data points, i.e., a combination of TE and b-value (TE=107,137,167,197,227,257 ms; b-value = 01,1001,2001,4001,8002, 20003 s/mm2). The subscripts denoted the number of averages. Other protocols are: repetition time TR=2500 ms, FOV=220×230 mm, slice number=3, slice thickness=5 mm, slice gap=1 mm, matrix=207×216.Consistency of macroadenomas was evaluated by two neurosurgeons after surgical treatment, and was classified into soft or hard groups. Regions of interests (ROIs) were manually delineated in the macroadenomas on EPI images with TE=167 ms, b=800 s/mm2. The ranges of ADC and T2 for DR-CSI spectrum were (0~5×10⁻³ mm2/s) and (0~300 ms), respectively. Specifically, all spectrums were segmented into four regions, A(low ADC, short T2), B(high ADC, short T2), C(high ADC, long T2) and D(low ADC, long T2), with the boundaries of ADC=1×10⁻³ mm2/s and T2=50 ms, indicating four distinct tissue components or compartments (Figure 1). Volume fractions of each region were calculated separately. Differences between fractions of the four regions were assessed using two-sided t tests, and Receiver operating characteristic (ROC) analysis was adopted to evaluate the performance of volume fractions in differentiating the two groups.
Results
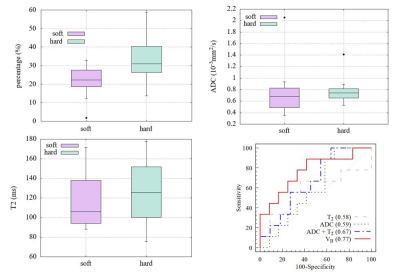
Among the twenty-one patients, tumor consistencies confirmed by surgery were hard macroadenoma in 9 patients and soft macroadenoma in 11 patients. For the four regions categorized by DR-CSI, the difference of region B volume fraction was marginally significant (p=0.042) between soft (mean value 21.71±8.14%) and hard adenomas (mean value 32.5±12.13%), while that of ADC (soft 0.75±0.43 ×10⁻³ mm2/s, hard 0.79±0.24×10⁻³ mm2/s, p=0.82) and T2 (soft 115±25 ms, hard 125±34 ms, p=0.48) were not significant. The area under the curve (AUC) was 0.77 (Figure 2), better than ADC (0.59), T2 (0.58) and ADC+T2 (0.67). Two typical cases of soft and hard consistencies were shown in Figure 3 and 4, respectively. Corresponding volume fraction maps for the four regions demonstrated the spatial distribution of different kinds of components, while conventional ADC and T2 maps could not provide such information. Moreover, VB map clearly visualized the spatial presence of consistency-related components and provided its volume fraction.Discussion
The challenge of non-invasive evaluation for consistency of PA could be mainly attributed to the complexity of tumor composition. As such, DR-CSI is a good choice for tissue microstructure imaging, as it could resolve tissue heterogeneity by disentangling the coupled ADC and T2 of different tissue components, and hence, differentiating distinct tissue components, on a spectra-imaging way. According to the preliminary results, the consistency of PA showed a strong correlation with the components of high ADC and short T2. For tissues with complex composition, conventional ADC/T2 values could only represent an average result from wide diversity of components in a voxel. Vital changes of specific components, correlated to important properties of concern such as PA consistency, are easy to be merged due to the irregular distribution of other components. This might lead to the confusing contradiction of relationship between conventionally measured ADC/T2 and PA consistency, reported by previous studies1-4.This preliminary study demonstrates the remarkable potential of DR-CSI in assessing tumor consistency of pituitary macroadenomas. Further, DR-CSI could serve as a promising tool to probe tissue heterogeneity in tumor.
Conclusion
In conclusion, DR-CSI has shown its ability to determine the consistency of macroadenomas. Moreover, the potential of DR-CSI to probe tissue composition, compartments or heterogeneity is expected in future study.Acknowledgements
NoneReferences
1. Pierallini A, Caramia F, Falcone C, et al. Pituitary macroadenomas: Preoperative evaluation of consistency with diffusion-weighted MR imaging-initial experience. Radiology 2006;239:223–231.
2. Smith KA, Leever JD, Chamoun RB. Prediction of consistency of pituitary adenomas by magnetic resonance imaging. J Neurol Surg B Skull Base 2015;76:340–343.
3. Thotakura AK, Patibandla MR, Panigrahi MK, et al. Is it really possible to predict the consistency of a pituitary adenoma preoperatively? Neurochirurgie 2017;63:453–457.
4. Su CQ, Zhang X, Pan T,et al. Texture Analysis of High b-Value Diffusion-Weighted Imaging for Evaluating Consistency of Pituitary Macroadenomas. J Magn Reson Imaging. 2020;51(5):1507-13.
5. Alimohamadi M, Sanjari R, Mortazavi A, et al. Predictive value of diffusion-weighted MRI for tumor consistency and resection rate of nonfunctional pituitary macroadenomas. Acta Neurichir 2014;156: 2245–2252.
6. Van Gerven L, Qian Z, Starovoyt A, et al. Endoscopic, Endonasal Transsphenoidal Surgery for Tumors of the Sellar and Suprasellar Region: A Monocentric Historical Cohort Study of 369 Patients. Front Oncol. 2021;11:643550.
7. Youssef AS, Agazzi S, van Loveren HR. Transcranial surgery for pituitary adenomas. Neurosurgery 2005;57(1 Suppl):168–175.
8. Benjamini D, Basser PJ. Multidimensional correlation MRI. NMR Biomed. 2020;33(12):e4226.
9. Kim D, Doyle EK, Wisnowski JL, Kim JH, Haldar JP. Diffusion-relaxation correlation spectroscopic imaging: A multidimensional approach for probing microstructure. Magn Reson Med. 2017;78(6):2236-49.
Figures

