3616
Highly reliability resting-state networks in common marmoset brains.1Laboratory for Marmoset Neural Architecture, RIKEN CBS, Saitama, Japan, 2Graduate School of Human Health Sciences, Tokyo Metropolitan University, Tokyo, Japan, 3Live Animal Imaging Center, Central Institute for Experimental Animals, Kanagawa, Japan, 4Department of Physiology, Keio University School of Medicine, Tokyo, Japan, 5Division of Regenerative Medicine, The Jikei University School of Medicine, Tokyo, Japan
Synopsis
We identified the resting-state networks in common marmoset brains with a larger amount of rsfMRI data (60 hours). The group-ICA and single subject-ICA were performed in this study. As a results, 18 networks were detected with highly reliability. It included the default mode network, a network most likely involved with visual pathways, and the limbic network. In addition, our data suggests that the resting-state networks in marmoset may be similar to that in human and macaque monkey. Therefore, our study shows that the evaluation of the functional effects of the neurodegenerative diseases using common marmosets is highly useful.
INTRODUCTION
Several previous studies have attempted to identify the resting-state networks (RSNs) in common marmoset brains (Callithrix jacchus), a non-human primate.1-5 However, it is necessary to identify their RSNs with highly reliability by analysis using a larger amount of data. The purpose of this study is to identify their RSNs and to examine the brain regions that constitute these RSNs with a larger amount of rsfMRI data.METHODS
Animal Care and Use CommitteesThis study was approved by the Animal Experiment Committees at RIKEN Center for Brain Science (CBS) and was conducted in accordance with the Guidelines for Conducting Animal Experiments of RIKEN CBS.
Animals
Seven healthy common marmosets (4 males; 4.29 ± 1.31 years old) were used as subjects. The training was conducted to familiarize the subjects with the experimental environment. After training, all subjects scored 1 or 2 on the behavioral assessment scale6 in the rsfMRI scan environment.
Data acquisition
All scans were performed using a 9.4-T MRI unit (Bruker, Biospec94/30). We used an 8-channel phase-array receiver coil for the common marmoset. The rsfMRI, T2WI and the images of spin-echo EPI for TOPUP correction were scanned in each subject. The total rsfMRI data for all subjects was 108,000 time-course image volumes (60 hours). Although there have been several similar studies, none have examined the scale of rsfMRI data used in this study.
Image preprocessing
The rsfMRI data preprocessing were performed (TOPUP, realignment, slice timing correction, normalization and smoothing, denoising).7-12 To assess the quality of the rsfMRI data, temporal SNR was calculated.13
Resting-state networks analysis
Figure 1 shows the methods of evaluating the reliability of RSNs. To examine the RSNs of the common marmoset, independent component analysis (ICA) was performed using FSL.10 In this analysis, group-ICA was performed using all rsfMRI data and single subject-ICA was performed using the rsfMRI data of each subject (Fig. 1B and C). Next, we excluded components considered to be noise from the 25 components of group-ICA and single subject-ICA (Fig. 1B' and C').14 The reliability of RSNs was evaluated with the results of these ICAs (Fig. 1D-F). We defined the RSNs with highly reliability as those components of group-ICA that were found to be similar in the majority of single subject-ICA.
RESULTS
Evaluation of the quality of rsfMRI dataFigure 2 shows the tSNR maps measured in 1 session averaged over 12 sessions for each subject. According to the previous study,13 to detect activation with an effect size of 0.5 (0.1) % to a threshold of P = 5×10⁻¹⁰ with our rsfMRI data, tSNR of approximately 200 (1000) are required according to the theory. In our rsfMRI data, almost all voxels in the whole brain of all subjects had a tSNR of more than 200. In addition, the tSNR was more than 1000 in a large number of voxels in all subjects. Therefore, our rsfMRI data used for ICA has sufficiently high tSNR required to detect activation.
Resting-state networks in common marmoset brains
Based on the results of these ICAs, we identified 18 RSNs with highly reliability as follows; 5 visual networks, 4 networks containing temporal lobe regions, 2 somatomotor networks, 2 frontal cortices networks, a default mode network, a salience-like network, a basal ganglia network, a limbic network, and a cerebellum network. Figure. 3 shows the z-score maps of group-ICA. Figure. 4 shows the spatial locations of the merged single subject-ICA. Figure. 5 shows the results of the matching group-ICA and merged single subject-ICA.
DISCUSSION
Many of the RSNs detected in this study were similar to those reported as RSNs in human and macaque monkey.15-23 Among the RSNs detected in this study, default mode network (RSN7) and lateral visual network (RSN6) were interesting RSNs.Default mode network
The DMN is an important and interesting RSN, particularly for those investigating resting-state brain function. DMN was defined as being composed of the parietal, prefrontal, and temporal cortices,24 and the composition of RSN7 was consistent with it. The PFC of the RSN7 that we detected had the A6DR as the major region, and the A8aD contained only the caudal part. In agreement with our data and previous studies,1-3 A6DR is definitely included in the constitutive domain of the DMN in common marmoset brains.
Lateral visual network
The lateral visual network (RSN6) had features not found in the lateral visual network in previous studies, including not only lateral parts of visual cortices, but also some subcortical cortices such as the SC and LGN and pulvinar. Previous studies on the visual system of the common marmoset by tracer injection showed that visual cortices are structurally associated with the LGN and pulvinar.25 Therefore, it is possible that RSN6 is significantly involved in their visual pathway.
CONCUSION
Our data detected marmoset’s RSNs reported in previous studies with highly reliability, and we have presented new findings into their brain function. In addition, results suggested that many of the RSNs may be close in spatial distribution to the RSNs in humans and macaques. Therefore, our study shows that the evaluation of the functional effects of those diseases using common marmosets is highly useful in examining the effects of those diseases on human brain function.Acknowledgements
We thank Kawabata Yoshihiko at Takashima Seisakusho Co., Ltd, for support with the MRI coil systems. We thank Araki Rikita, Koichiro Takahashi, and Hishinuma Takashi, Bruker Japan, for support with MRI systems. We are grateful to Yuri Shinomoto and Chihoko Yamada for support with animal care.
This work was supported by the program for Brain Mapping by Integrated Neurotechnologies for Disease Studies (Brain/MINDS) from the Japan Agency for Medical Research and Development (AMED) (Grant Number JP21dm0207001 to H.O.), JSPS KAKENHI (Grant Number JP20H03630 to J.H.), and by “MRI platform” as a program of Project for Promoting public Utilization of Advanced Research Infrastructure of the Ministry of Education, Culture, Sports, Science and Technology (MEXT), Japan
References
- Annabelle M. Belcher, Cecil C. Yen, Haley Stepp, et al. Large-Scale Brain Networks in the Awake, Truly Resting Marmoset Monkey. J. Neurosci. 2013;33:16796-16804.
- Liu C, Yen CC, Szczupak D, et al. Anatomical and functional investigation of the marmoset default mode network. Nat Commun. 2019;10:1975.
- Schaeffer DJ, Gilbert KM, Hori Y, et al. Integrated radiofrequency array and animal holder design for minimizing head motion during awake marmoset functional magnetic resonance imaging. Neuroimage. 2019;193:126-138.
- Maryam Ghahremani, R. Matthew Hutchison, Ravi S. Menon, et al. Frontoparietal Functional Connectivity in the Common Marmoset. Cerebral Cortex. 2017;27:3890–3905.
- Buckner RL, Margulies DS. Macroscale cortical organization and a default-like apex transmodal network in the marmoset monkey. Nat Commun. 2019;10:1976.
- Silva AC, Liu JV, Hirano Y, et al. Longitudinal functional magnetic resonance imaging in animal models. Methods Mol Biol. 2011;711:281-302.
- Andersson JL, Skare S, Ashburner J. How to correct susceptibility distortions in spin-echo echo-planar images: application to diffusion tensor imaging. Neuroimage. 2003;20:870-888.
- Smith SM, Jenkinson M, Woolrich MW, et al. Advances in functional and structural MR image analysis and implementation as FSL. Neuroimage. 2004;23:S208-219.
- K. Friston, J. Ashburner, S. Kiebel, et al. Statistical Parametric Mapping: The Analysis of Functional Brain Images. Academic Press. London. 2007.
- Jenkinson M, Beckmann CF, Behrens TE, et al. FSL. Neuroimage. 2012;62:782-790.
- Chen Z, Calhoun V. Effect of Spatial Smoothing on Task fMRI ICA and Functional Connectivity. Front Neurosci. 2018;12:15.
- Power JD, Mitra A, Laumann TO, et al. Methods to detect, characterize, and remove motion artifact in resting state fMRI. Neuroimage. 2014;84:320-341.
- Murphy K, Bodurka J, Bandettini PA. How long to scan? The relationship between fMRI temporal signal to noise ratio and necessary scan duration. Neuroimage. 2006;34:565-574.
- Griffanti L, Douaud G, Bijsterbosch J,et al. Hand classification of fMRI ICA noise components. Neuroimage. 2017;154:188-205.
- Chen X, Liu J, Wang J, et al. Altered resting-state networks may explain the executive impairment in young health immigrants into high-altitude area. Brain Imaging Behav. 2021;15:147-156.
- McIntosh RC, Lobo JD, Yang A, et al. Brainstem network connectivity with mid-anterior insula predicts lower systolic blood pressure at rest in older adults with hypertension. J Hum Hypertens. 2021.
- Damoiseaux JS, Rombouts SA, Barkhof F, et al. Consistent resting-state networks across healthy subjects. Proc Natl Acad Sci USA. 2006;103:13848-13853.
- Smith SM, Fox PT, Miller KL, et al. Correspondence of the brain's functional architecture during activation and rest. Proc Natl Acad Sci USA. 2009;106:13040-13045.
- Beckmann CF, DeLuca M, Devlin JT, et al. Investigations into resting-state connectivity using independent component analysis. Philos Trans R Soc Lond B Biol Sci. 2005;360:1001-1013.
- Guedj C, Monfardini E, Reynaud AJ, et al. Boosting Norepinephrine Transmission Triggers Flexible Reconfiguration of Brain Networks at Rest. Cereb Cortex. 2017;27:4691-4700.
- Yacoub E, Grier MD, Auerbach EJ, et al. Ultra-high field (10.5 T) resting state fMRI in the macaque. Neuroimage. 2020;223:117349.
- Lucas-Jiménez O, Ojeda N, Peña J, et al. Altered functional connectivity in the default mode network is associated with cognitive impairment and brain anatomical changes in Parkinson's disease. Parkinsonism Relat Disord. 2016;3:58-64.
- Hutchison RM, Leung LS, Mirsattari SM, et al. Resting-state networks in the macaque at 7 T. Neuroimage. 2011;56(3):1546-1555.
- Raichle ME.The brain's default mode network. Annu Rev Neurosci. 2015;38:433-447.
- Huo BX, Zeater N, Lin MK, et al. Relation of koniocellular layers of dorsal lateral geniculate to inferior pulvinar nuclei in common marmosets. Eur J Neurosci. 2019;50:4004-4017.
Figures
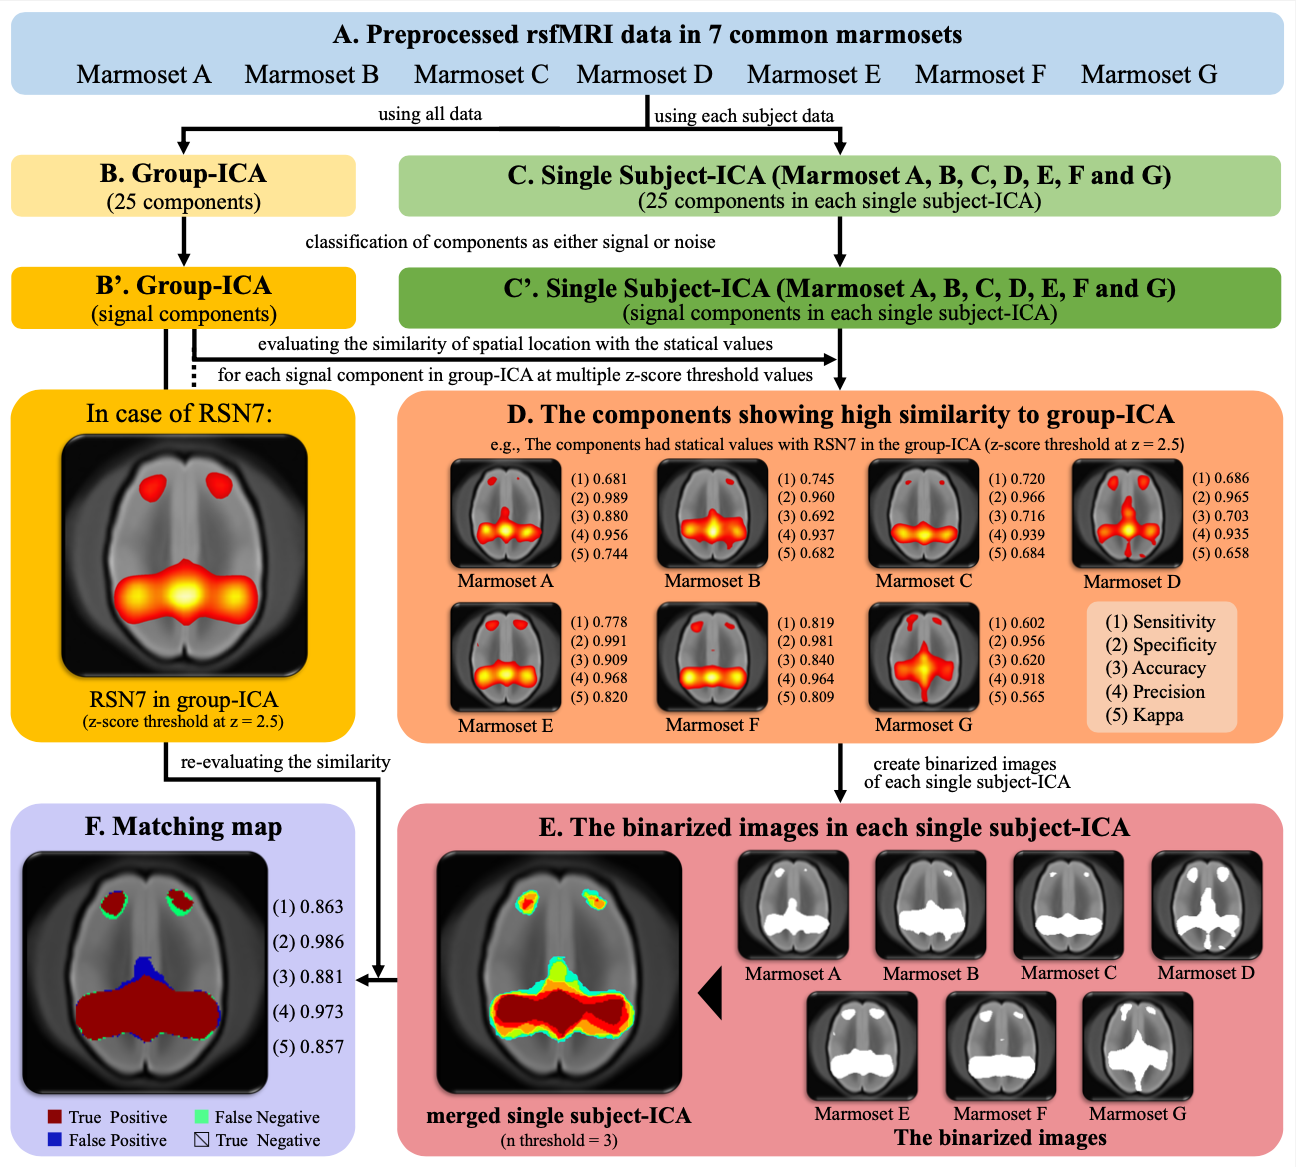
Figure 1. Evaluation of RSNs in common marmosets using z-score maps by independent component analysis.
This figure shows the ICA performed and evaluation of the results. To evaluate the reliability of RSNs, we used the sensitivity, specificity, accuracy, precision, and kappa of spatial location with the z-score threshold from 2 to 10 in increments of 0.5. The evaluation of RSN7 detected by group-ICA is displayed as an example.
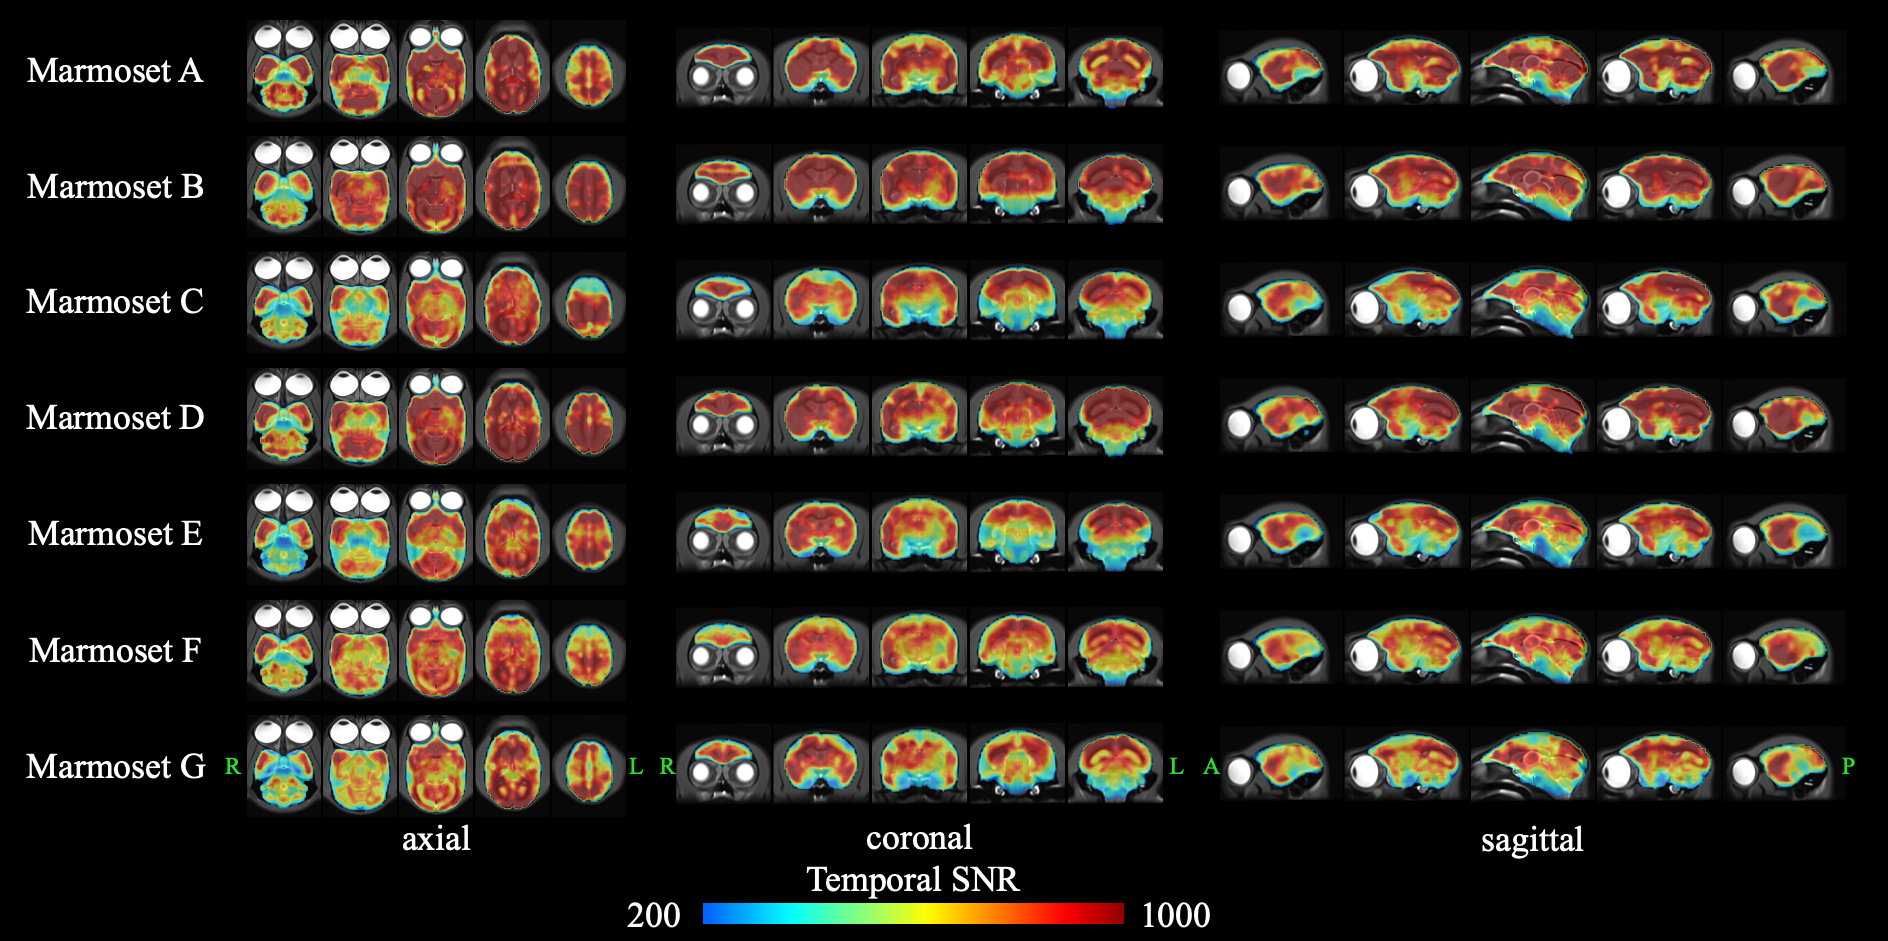
Figure 2. Temporal signal-to-noise ratios (tSNR) in each subject.
We calculated the tSNR for 150 volumes of rsfMRI data after all image preprocessing. In addition, we calculated the mean tSNR of 12 times rsfMRI data taken on the same day. For each subject, a high-resolution T2WI image overlaid with a tSNR image is shown in three sections: axial, coronal, and sagittal.
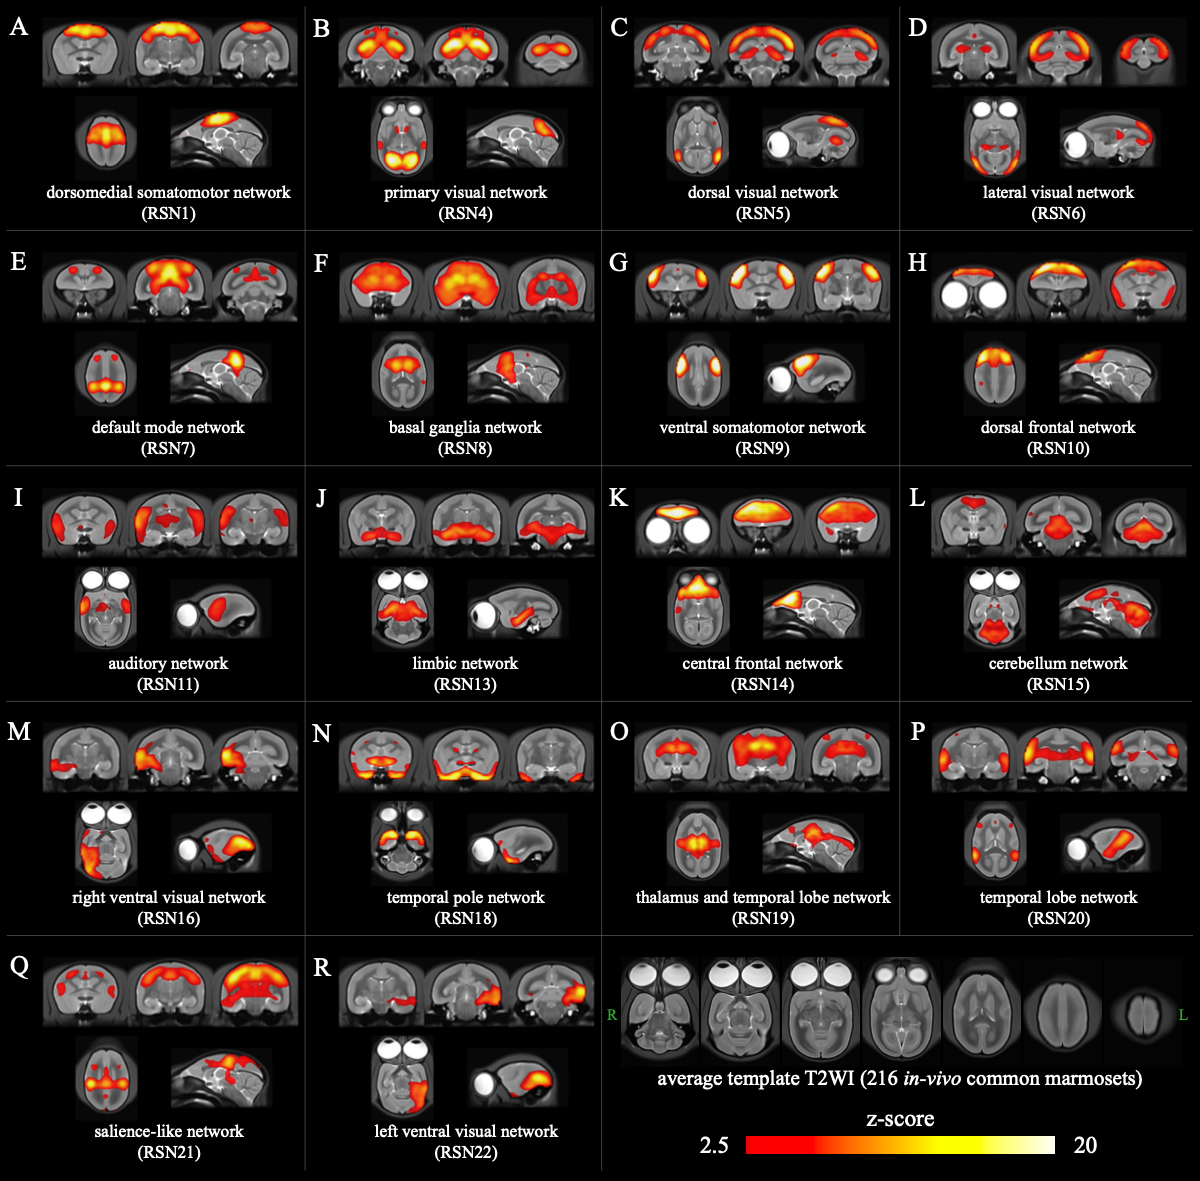
Figure 3. 18 RSNs identified using group-ICA.
dorsomedial somatomotor network (A); primary visual network (B); dorsal visual network (C); lateral visual network (D); default mode network(E); basal ganglia network (F); ventral somatomotor network (G); dorsal frontal network (H); auditory network (I); limbic network (J); central frontal network (K); cerebellum network (L); right ventral visual network (M); temporal pole network (N); thalamus and temporal lobe network (O); temporal lobe network (P); salience-like network (Q); left ventral visual network (R).
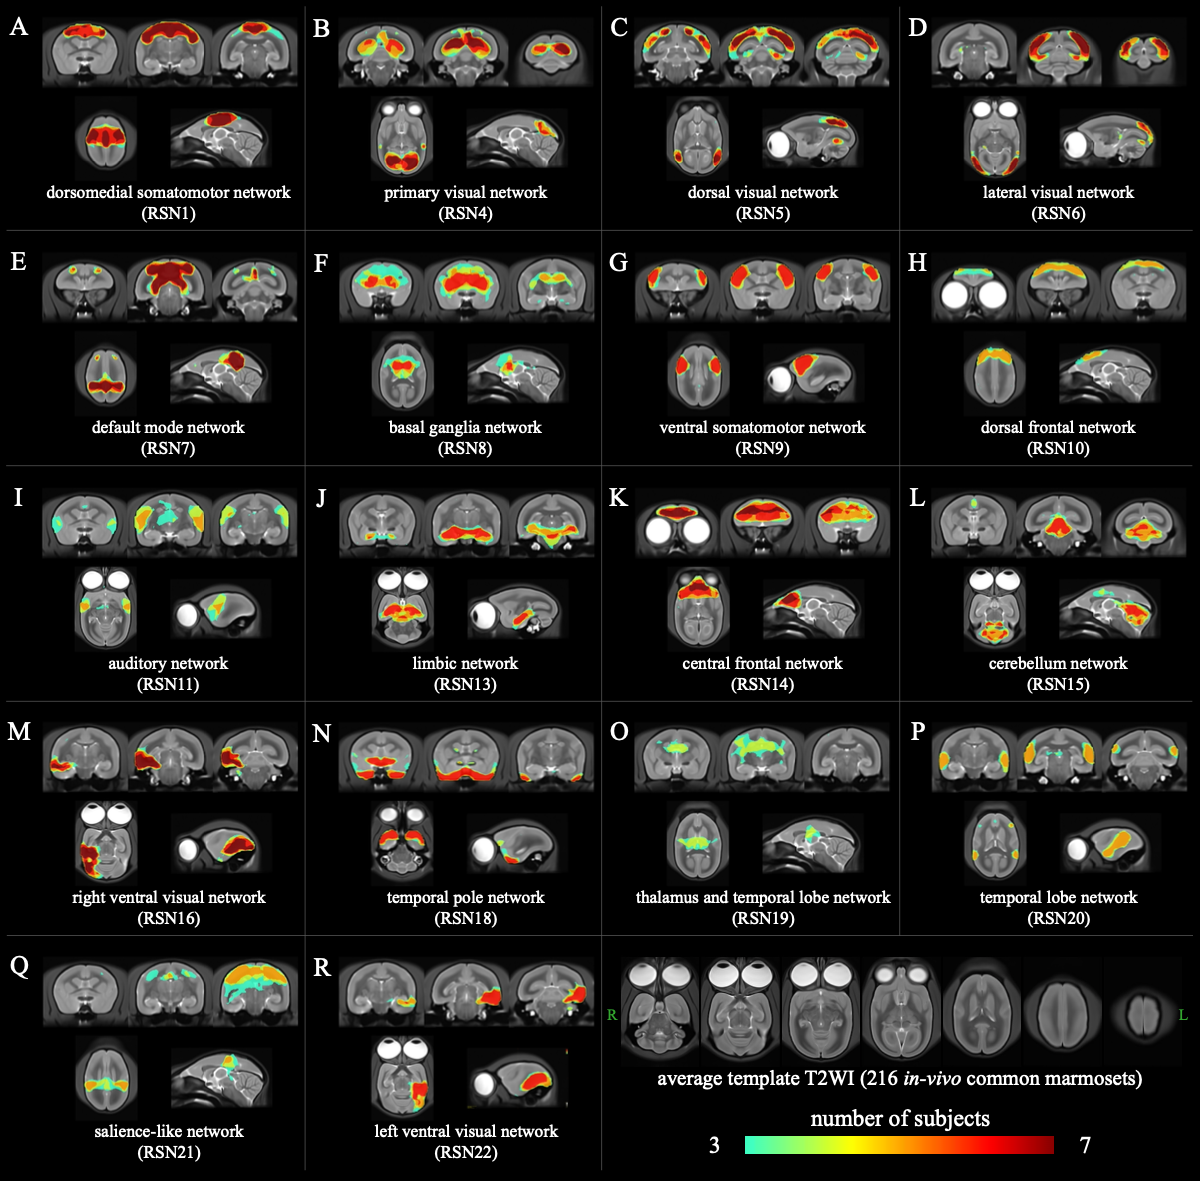
Figure 4. The resting state networks identified using merged single subject-ICA images of 7 common marmosets.
The RSNs of merged single subject-ICA images similar to each RSN of group-ICA. The images of axial, coronal, and sagittal slices of each RSN in this figure are the same cross sections as the corresponding RSNs shown in Figure 2. A number of subjects threshold of n = 3 was used in the visualization of merged single subject-ICA images.
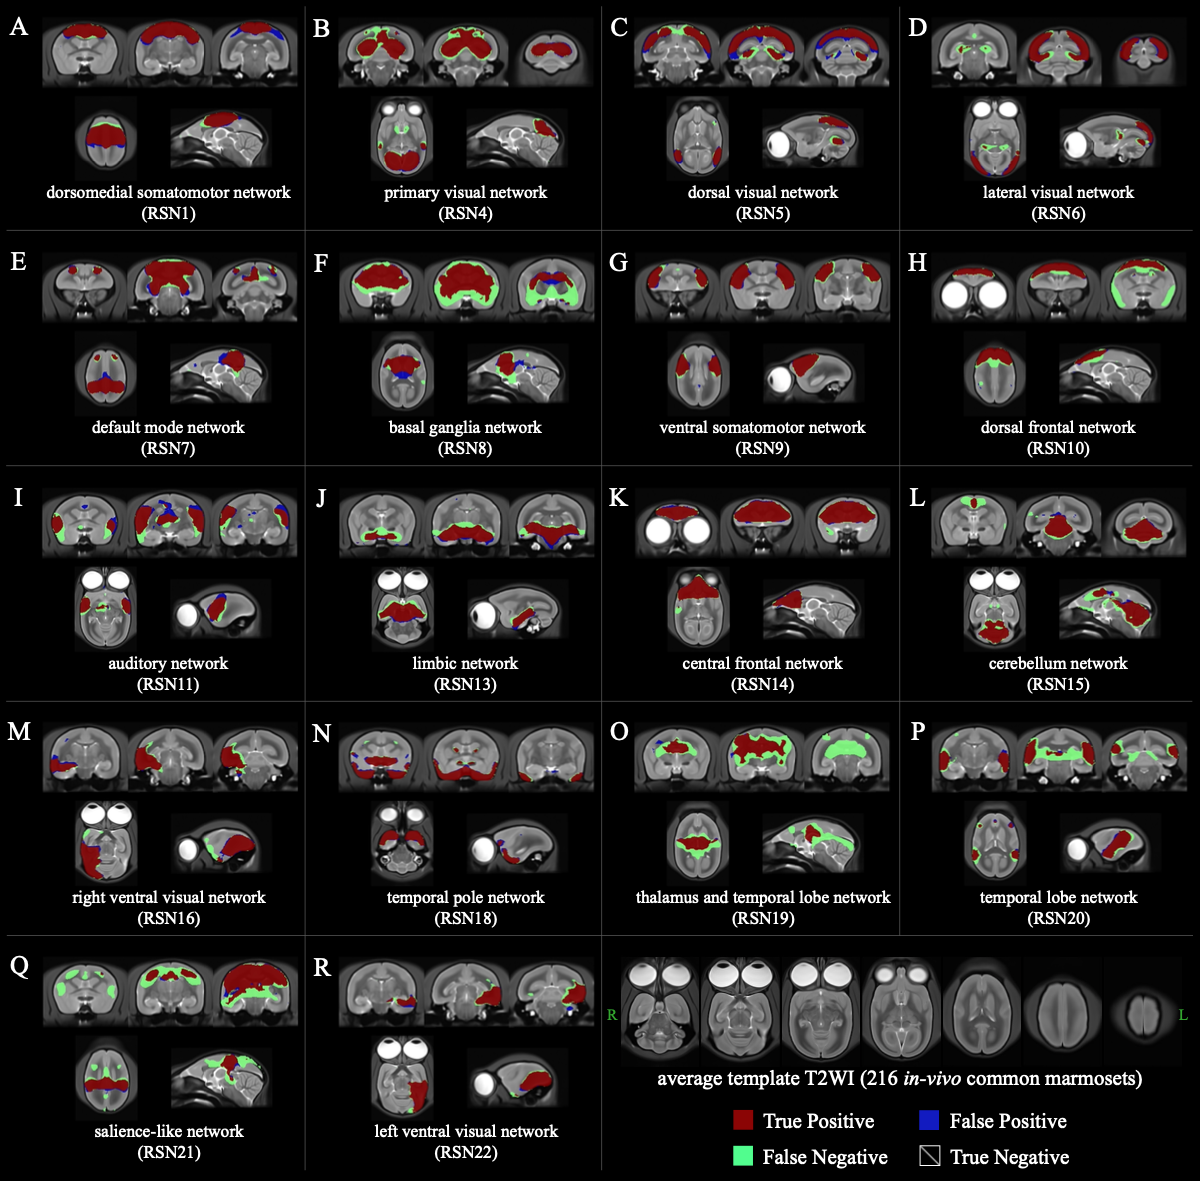
Figure 5. The matching maps with group-ICA and merged single subject-ICA results.
Voxels detected by both group-ICA and merged single subject-ICA are shown in red as true positives. Voxels detected by group-ICA, but not by merged single subject-ICA are shown in green as false negatives. Voxels that were not detected by group-ICA, but were detected by merged single subject-ICA are displayed in blue as false positives. Voxels that were not detected by both group-ICA and merged single subject-ICA are not displayed and are true negatives.