3615
Brain mapping of the temporal interference stimulation wth functional MRI
Zonghao Xin1, Yoshifumi Abe2, Akihiro Kuwahata3, Kenji F. Tanaka2, and Masaki Sekino1
1Department of Bioengineering, School of Engineering, The University of Tokyo, Tokyo, Japan, 2Division of Brain Sciences, Institute for Advanced Medical Research, Keio University School of Medicine, Tokyo, Japan, 3Department of Electrical Engineering, Graduate School of Engineering, Tohoku University, Sendai, Japan
1Department of Bioengineering, School of Engineering, The University of Tokyo, Tokyo, Japan, 2Division of Brain Sciences, Institute for Advanced Medical Research, Keio University School of Medicine, Tokyo, Japan, 3Department of Electrical Engineering, Graduate School of Engineering, Tohoku University, Sendai, Japan
Synopsis
Temporal interference stimulation (TIS) is a novel, non-invasive deep brain stimulation (DBS) methodology thatutilizes multiple external electric fields with amplitude modulation (AM) to stimulate deep brain regions without affectingthe superficial cortical areas. However, the clinical application of TIS is inhibited by its unproved response of the brain to the modulated stimulation. In this study, we investigated the instantaneous brain response to TIS using fMRI technique in rodents. The results demonstrated the compatibility of TIS with fMRI, as well as the feasibility of stimulating subcortical encephalic regions non-invasively and focally.
Introduction
For the past two decades, deep brain stimulation (DBS) has become a well-established functional neurosurgical tech- nique for the treatment of a series of neuropsychiatric disorders[1]. However, invasive surgical intervention for DBS is accompanied by potentially serious attendant risks, including hemorrhage and infection. Therefore, the development of non-invasive DBS strategies has become a trend in the field[2].Temporal interference (TI) stimulation is a potential noninvasive method for recruiting deep encephalic regions while circumventing the excitation of the superficial cortex[3]. Interferential stimulation is performed by delivering multiple electrical fields to the brain at relatively high but slightly different frequencies. Owing to the small amount of difference in the frequency (e.g., 10 Hz), the applied fields consequently form a temporal interfered field with envelope modulation oscillating at the difference frequency that can be followed by the neurons.However, the tangled mechanisms underlying the brain’s response to this method hinder the translation of these studies into efficient clinical therapies. Nevertheless, immunohistological studies have been conducted to investigate post-stimulation responses[3], there are no previous works that have investigated the instantaneous excitation induced by TIS in the whole brain range. In this study, we performed experiments on rat models to further investigate encephalic regions that are possibly involved in the neural activity activated by TIS using fMRI.Methods
In this study, stimulation of the hippocampus was selected because hippocampal networks have been extensively studied in many levels of DBS studies, and therefore has been comparatively well-established[4]. We investigated the whole-brain effect against TIS at a difference frequency of 10 Hz and base frequency of 2k Hz in healthy rat models and characterized the responses to different stimulation intensities using fMRI. To investigate the immediate effects of TIS, changes in regional BOLD signals were used as indices for assessing the fMRI data that were taken simultaneously with the stimulation. In the fMRI experiment, surgery was conducted to affix home-made electrode sets above the skull of rats for stimulation (relative to bregma: anteroposterior (AP) -3.5 mm, mediolateral (ML) +0.25 mm and + 3.25 mm ). Stimuli (interferential waves) were generated by a multi-channel generator with channels to be isolated and synchronized with the fMRI image-taking procedure. The stimulation persisted for 10s and was repeated ten times with an interval of 30s. MR images were acquired using a 7 T MRI system (BioSpec, Bruker), the parameters for fMRI sequences and data analysis were determined based on our previous work[5]. A general linear model-based statistical parametric analysis was individually employed to depict the activation maps with a significance of P < 0.005 (uncorrected).Results
Fig. 1 demonstrated a representative T2-weighted structural image and an EPI image obtained from one rat. The stimulation electrodes made of saline-filled glass capillary induced considerably small artifacts meaning this stimulation protocol can be MRI-compatible.The activation map of the whole brain obtained from each animal model is depicted, and Fig. 2 shows two representative results of TIS. TIS-evoked BOLD signal changes in focal regions in the slices positioned from 6 mm posterior to 1.0 mm anterior to the bregma. In the first result, obvious BOLD signal changes were mainly distributed in the bilateral dentate gyrus (DG) and CA1. As for the second, signals were observed in CA1 on the ipsilateral side of the stimulation spot. The stimulation intensity for the two subjects was 0.35 mA. Note that no obvious activation was observed in the superficial cortical structure either in the stimulation spot or in the extended location, indicating the quiescent or blocked neural reaction in these regions, which is consistent with both prior in vivo and simulation studies [3, 6]. We then selected a region of interest (ROI) based on the statistical results, and analyzed the signal intensity changes along with the scan time. By correlating the stimulus period with the BOLD time course, we found that positive BOLD signals occurred in conjunction with the onset of electrical stimulation. Fig. 3 shows the signal fluctuation of the BOLD response extracting from the result of Fig. 2A, where the first, second, and fourth peaks of the BOLD signal could be recognized from the baseline, while the response to the other stimulation sessions seemed to vanish. We argue that this could be due to the heavy neuronal after-discharges caused by the first two stimulation sessions.
Discussion and conclusion
In this study, we investigated the functional brain mappings of rodent in response to temporal interference stimulation, which could help to refine the understanding of the mechanisms underlying the method. We demonstrated that the effect of TIS can be investigated by simultaneously recording hemodynamic responses with fMRI using homemade MRI-compatible electrodes. Further insights into the mechanisms of TIS can be interrogated by inspecting the changes in functional connectivity after stimulation. Activation maps of the brain show that, nevertheless the stimulation was applied via the electrodes positioned above the skull, the hippocampus regions could be focally activated while the overlaying cortex remained quiescent. This is consistent with the conclusions of the previous studies[3]. However, we also observed the excitation in several non-target regions, which could be due to the propagation of the neural signal originating from the hippocampus. The interpretation of activation signals requires further discussion.Acknowledgements
No acknowledgement found.References
[1] K. Ashkan, P. Rogers, H. Bergman, and I. Ughratdar, “Insights into the mechanisms of deep brain stimulation,” Nature Reviews Neurology, vol. 13, no. 9, pp. 548–554, 2017.[2] L. Pycroft, J. Stein, and T. Aziz, “Deep brain stimulation: An overview of history, methods, and future developments,” Brain and neuroscience advances, vol. 2, p. 2398212818816017, 2018.[3] N. Grossman, D. Bono, N. Dedic, S. B. Kodandaramaiah, A. Rudenko, H.-J. Suk, A. M. Cassara, E. Neufeld, N. Kuster, L.-H. Tsai et al., “Noninvasive deep brain stimulation via temporally interfering electric fields,” cell, vol. 169, no. 6, pp. 1029–1041, 2017.[4] Y. Abe, M. Sekino, Y. Terazono, H. Ohsaki, Y. Fukazawa, S. Sakai, H. Yawo, and T. Hisatsune, “Opto-fmri analysis for exploring the neuronal connectivity of the hippocampal formation in rats,” Neuroscience research, vol. 74, no. 3-4, pp. 248–255, 2012.[5] Z. Xin, Y. Abe, S. Liu, K. F. Tanaka, K. Hosomi, Y. Saitoh, and M. Sekino, “Direct impact of motor cortical stimula- tion on the blood oxygen-level dependent response in rats,” Magnetic Resonance in Medical Sciences, vol. 20, no. 1, p. 83, 2021.[6] E. Mirzakhalili, B. Barra, M. Capogrosso, and S. F. Lempka, “Biophysics of temporal interference stimulation,” Cell Systems, vol. 11, no. 6, pp. 557–572, 2020.Figures
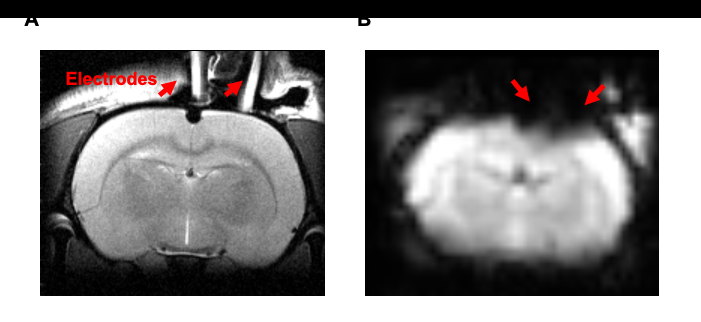
Figure 1: A. Representative T2-weighted structural image of the rat model. Two electrodes made of saline-filled glass capillary (1.5 mm outer diameter) were positioned on the skull surface. A silver wire (0.25 mm diameter) was inserted into the capillary to conduct the electric current. B. Representative EPI imaging of the rat model The electrode induced susceptibility artifacts in a relatively small region in the superficial cortex regions.
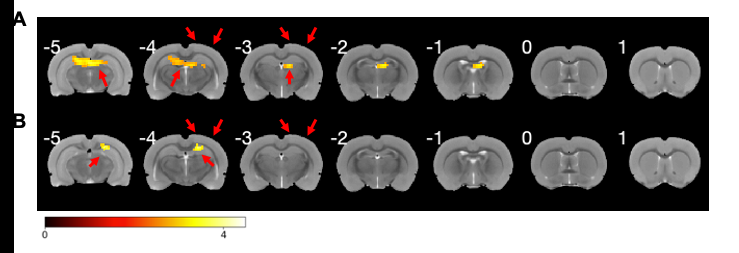
Figure 2: The calculated statistical parametric maps overlaid on a rat brain template. The number of each slice indicates the position to the bregma (mm). Electrodes locations are illustrated by the arrow above the cortex. (A) A representative activation map of the same animal from Figure. 1 (P < 0.005, uncorrected, stimulation intensity of 0.35 mA). Obvious BOLD signal changes were mainly distributed in the bilateral dentate gyrus (DG) and CA1. (B) A representative activation map (stimulation intensity of 0.35 mA). Obvious BOLD signal changes were observed in the ispilateral CA1.
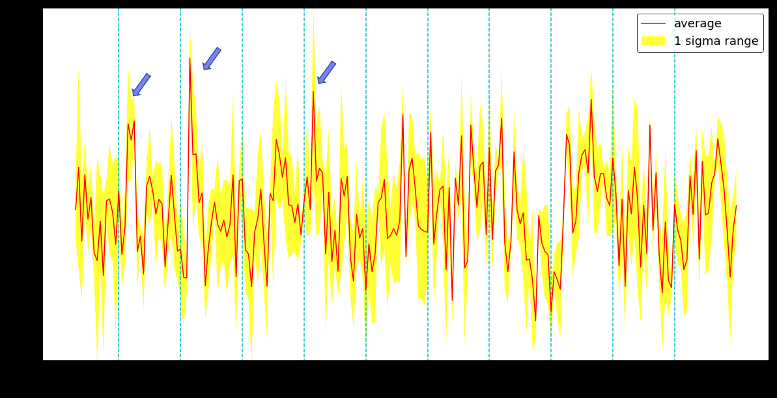
Figure 3: BOLD signal time course for all time in hippocampus regions. The cyan dotted line represents the starting point of the electrical stimulation periods. The yellow bound represents the mean ± standard error of the mean (SEM).
DOI: https://doi.org/10.58530/2022/3615