3614
Abnormal functional connectivity of default mode network subsystems in first-episode drug-naïve major depressive disorder1Huaxi MR Research Center (HMRRC), Department of Radiology, West China Hospital of Sichuan University, Chengdu, China
Synopsis
Most previous studies took DMN as a whole and measured its FC abnormalities on a network level while recently, researchers revealed DMN has three subsystems (core, dMPFC and MTL subsystem). Few studies had explored FC on subsystem levels in first-episode drug-naïve (FEDN) MDD patients. We used seed-based whole-brain functional connectivity analysis in a relatively large sample of FEDN MDD patients, we found hyper-connectivity between DMN three subsystems and frontoparietal network as well as cerebellum network, and hypo-connectivity between dMPFC subsystem and dorsal attention network. These findings might provide a more comprehensive understanding for DMN FC changes in MDD.
Introduction
Default mode network (DMN) is a set of brain regions that were more active during passive task condition and is suggested to have three subsystems (core, dMPFC and MTL subsystem) (1, 2). Changes on subsystem levels might be a better clue to understanding major depressive disorder’s (MDD) pathology(3). Few studies had explored functional connectivity (FC) on subsystem levels in first-episode drug-naïve (FEDN) MDD patients. We conducted a seed-based whole-brain voxel-wise functional connectivity (FC) analysis to see whether there were any DMN subsystem FC differences in FEDN MDD and whether these changes are relevant to clinical symptoms.Methods
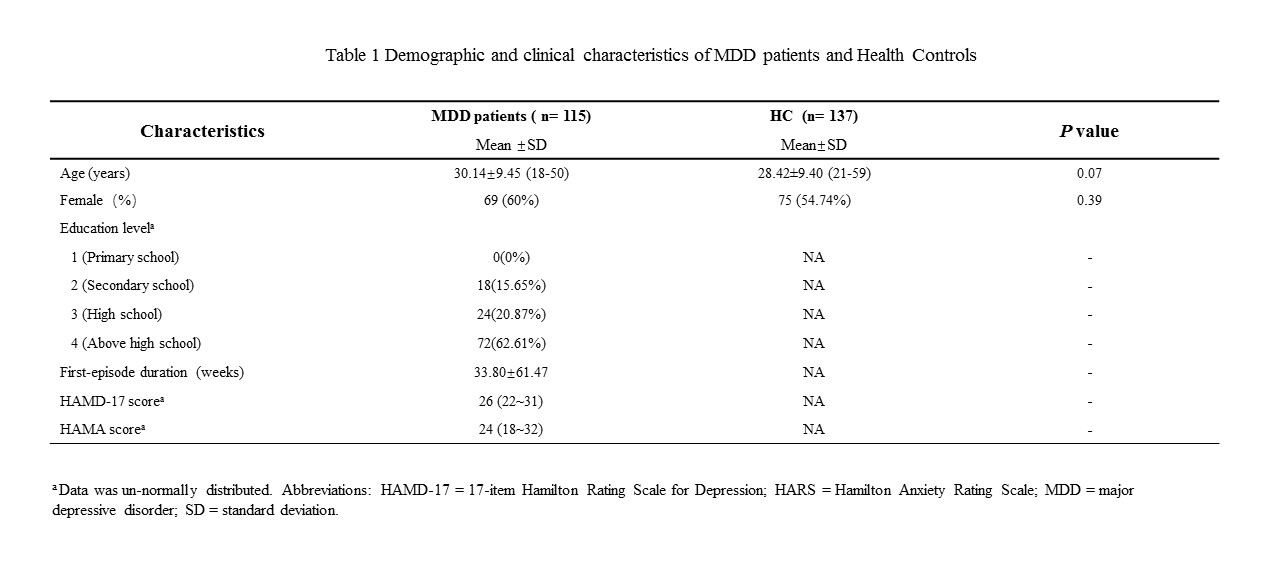
115 DSM-IV criteria diagnosed, FEDN MDD patients and 137 demographically matched healthy controls (HCs) were recruited (Table 1). The Hamilton depression scale (HAMD) and Hamilton anxiety scale (HAMA) were used to measuring patients’ symptom severity. A battery of neurocognitive assessments like the Stroop Color-Word Test, wsiconsin card sorting test, trail making A/B test and ect. were performed on MDD patients by a trained professional. Informed consent was obtained from all subjects.All participants underwent examination using a 3.0 T MR scanner with an 8-channel phased-array head coil. Rs-fMRI images were acquired using a gradient-echo echo-planar imaging sequence (TR/TE=2000/30 ms, flip angle 90°, 30 slices, slice thickness 5 mm, field of view 240×240 mm², matrix 64×64 , voxel size 3.75×3.75×5 mm³). The 3-dimensional (3D) T1-weighted images were acquired using a spoiled gradient-recall sequence (TR/TE=1900/2.26 ms, flip angle 9°, 176 axial slices, slice thickness 1 mm, field of view 24×24 mm² and matrix 256×256).
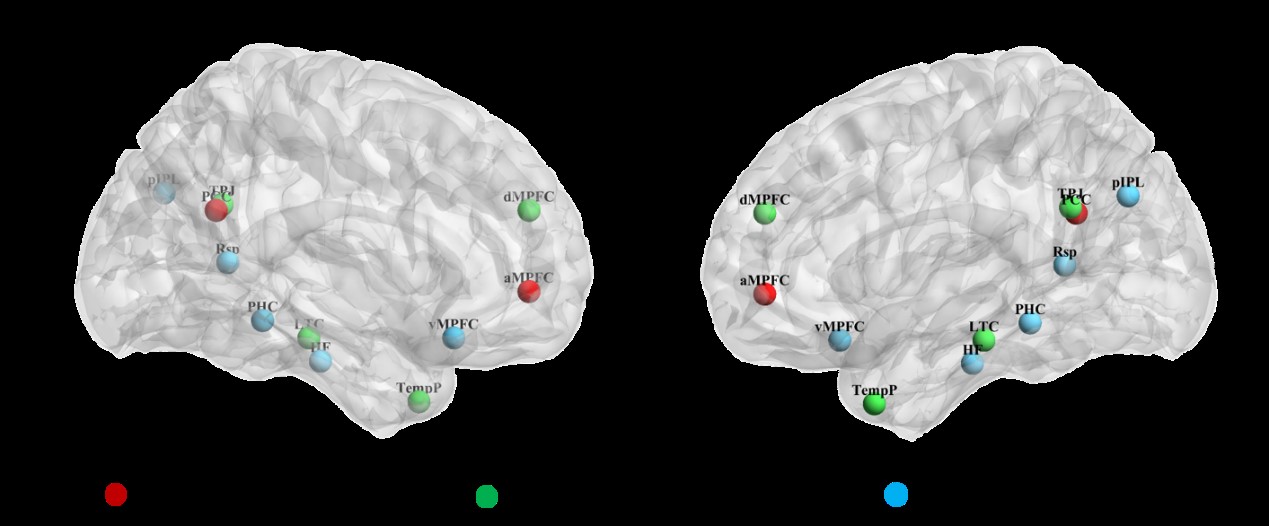
We used Data processing assistant for Resting-State fMRI (DPARSF) software to preprocess images and SPM software were used to perform functional connectivity analysis. We chose left-lateralized 11 ROIs (6 mm radius sphere) to present DMN 3 subsystems according to several previous works (Figure 1). Similar to Andrews-Hanna’s study, only left-lateralized ROIs were used to simplify the analysis, prevent biasing the structure toward the strong correlations exhibited between mirrored (right/left) seed regions, and avoid the strong laterality observed for the lateral parietal ROIs(2, 4). For each participant, we extracted the seed-to-whole brain voxel BOLD time series, which were converted using Fisher's r-to-z transform to allow for parametric testing. Two-sample t-tests (two-tailed) with Bonferroni corrections for multiple comparisons were used to investigate group differences.
Results
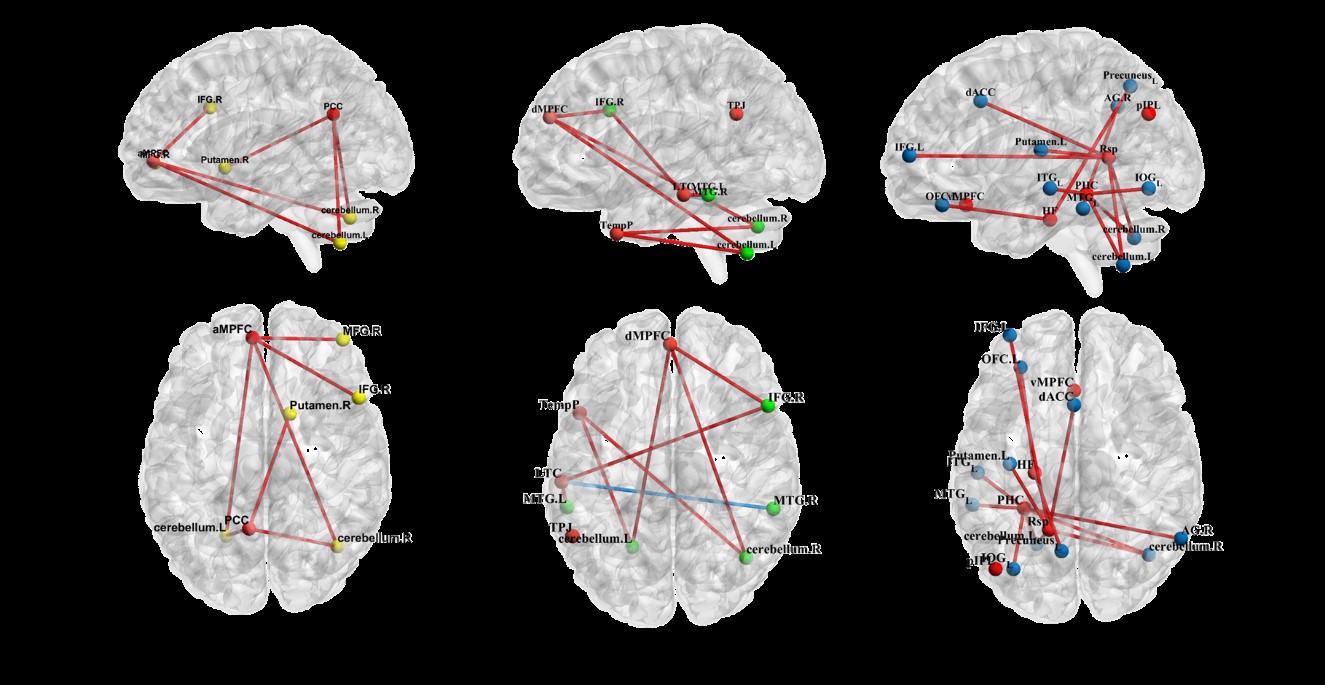
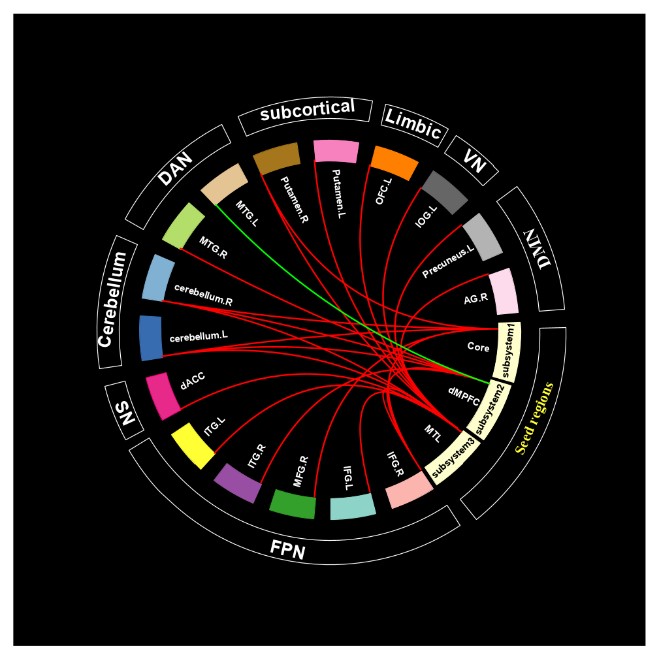
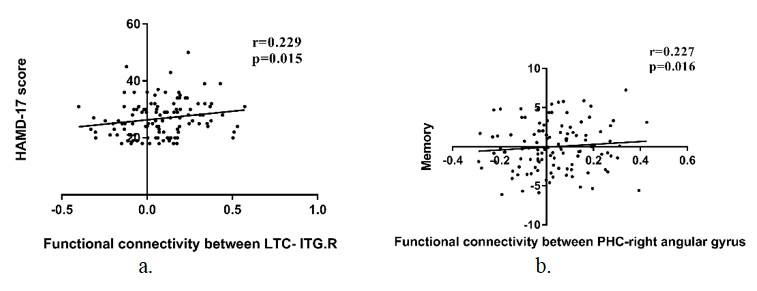
In the core subsystem, compared to HCs, FEDN patients exhibited significantly increased FC in the following pairs: aMPFC- bilateral cerebellum, bilateral inferior frontal gyrus (IFG.R/L), right middle frontal gyrus (MFG.R), dACC; PCC- bilateral cerebellum, right putamen (figure 2a). In the dMPFC subsystem, FEDN patients showed increased FC between dMPFC- bilateral cerebellum, left precentral gyrus, right inferior frontal gyrus (IFG.R) and dACC; LTC-right middle temporal gyrus (MTG.R), right inferior temporal gyrus (ITG.R) and left precuneus; TempP- bilateral cerebellum, while reduced FC were only found between LTC (dMPFC subsystem) and left middle temporal gyrus (Figure 2b). In the MTL subsystem, FEDN patients also demonstrated increased FC between vMPFC- right cerebellum; Rsp-bilateral cerebellum, dACC, bilateral inferior frontal gyrus (IFG.R/L), bilateral putamen; PHC- bilateral cerebellum, left inferior frontal gyrus (IFG.L); HF- dACC, bilateral OFC, left putamen and right middle frontal gyrus (MFG.R) (Figure 2c).Our analysis further revealed the core subsystem and dMPFC subsystem mainly showed abnormal connectivity with regions in FPN and cerebellum while MTL subsystem has abnormal connectivity with comprehensive networks (Figure 3). We found HAMD score correlated with LTC-ITG.R connectivity (r=0.229, p<0.05) and memory function in neuropsychological assessment was correlated with PHC-right angular gyrus connectivity (r=0.227, p<0.05) (Figure 4).
Discussion& Conclusion
In current study, we investigated DMN connecitvity changes in FEDN MDD patients on a subsystem level. Compared to HCs, MDD patients exhibited wide aberrant hyper-connectivity between DMN three subsystems and regions belonging to other networks whereas only one hypo-connectivity was found between dMPFC subsystem and frontoparietal network. As previous researches have shown that MDD patients have overall decreased FC within the entire DMN during rumination, our result may manifest a non-rumination state of our sample(5).DMPFC is known to be linked with a variety of cognitive function and the expression of negative emotion. Positive correlation between HAMD and LTC-ITG.R connectivity support that dMPFC subsystem abnormalities have the potential to be an imaging marker for MDD patients(6). MTL subsystem contributes to autobiographic memory process, positive correlation between memory function and PHC-right angular gyrus connectivity may explain aberrant memory function may be induced by abnormal functional connectivity(5).
Acknowledgements
This study was supported by the National Nature Science Foundation (Grant Nos. 81820108018, 81671669, and 82027808) and the Science and Technology Project of Sichuan Province (Grant No. 2017JQ0001).References
1. Buckner RL, Andrews-Hanna JR, Schacter DL. The brain's default network: anatomy, function, and relevance to disease. Annals of the New York Academy of Sciences. 2008;1124:1-38.
2. Andrews-Hanna JR, Reidler JS, Sepulcre J, Poulin R, Buckner RL. Functional-anatomic fractionation of the brain's default network. Neuron. 2010;65(4):550-62.
3. Tozzi L, Zhang X, Chesnut M, Holt-Gosselin B, Ramirez CA, Williams LM. Reduced functional connectivity of default mode network subsystems in depression: Meta-analytic evidence and relationship with trait rumination. NeuroImage Clinical. 2021;30:102570.
4. Fan F, Tan S, Huang J, Chen S, Fan H, Wang Z, et al. Functional disconnection between subsystems of the default mode network in schizophrenia. Psychological medicine. 2020:1-11.
5. Chen X, Chen NX, Shen YQ, Li HX, Li L, Lu B, et al. The subsystem mechanism of default mode network underlying rumination: A reproducible neuroimaging study. NeuroImage. 2020;221:117185.
6. Zhu X, Zhu Q, Shen H, Liao W, Yuan F. Rumination and Default Mode Network Subsystems Connectivity in First-episode, Drug-Naive Young Patients with Major Depressive Disorder. Scientific reports. 2017;7:43105.
Figures