3613
Dynamic Alterations in SpontaneousNeural Activity in First-Episode, Drug-Naive Patients with Major Depressive Disorder.1Huaxi MR Research Center (HMRRC), Functional and molecular imaging Key Laboratory of Sichuan Province, Department of Radiology, West China Hospital, Sichuan University, Chengdu, China
Synopsis
We collected resting-state fMRI data from 115 patients with major depressive disorder (MDD) and 127 normal controls (NC). The dynamic amplitude of low-frequency fluctuations (dALFF) and dynamic regional homogeneity (dReHo) in 115 MDD patients and 127 NC were compared. Correlation analyses between dALFF and dReHo in brain regions showing significant intergroup differences and clinical scores were calculated in MDD patients. We found aberrant dALFF and dReHo in MDD patients and their significant correlations with clinical scores, suggesting the pattern of intrinsic brain activity variability might be potential tools to assess MDD patients’ severity of illness.
Introduction
Major depressive disorder (MDD) is a common psychiatric illness, with clinical manifestations of persistently depressed mood, loss of interest, low self-esteem and energy, weight change, and cognitive dysfunction[1]. Previous researches have found regional spontaneous neural activity alterations in MDD revealed by the amplitude of low-frequency fluctuation (ALFF) and regional homogeneity (ReHo), which help to understand the pathological mechanis. However, as the brain is a highly dynamic system and traditional ALFF/ReHo can not capture the complex and dynamic changes of brain activity. Recently, a new parameter called dynamic ALFF/ReHo (dALFF/dReHo) was used to reflect brain activity changes in terms of temporal variability in several psychiatric disorders [2,3]. However, few studies have explored the dynamic brain activity in drug-naïve patients with MDD. so in current study, we aimed to explore whether patients with MDD exhibit abnormalities of intrinsic brain activity variability and whether the altered dynamic regional indexes were associated with clinical behavior in MDD patients.Methods
This study recruited 115 patients with MDD (46 males and 69 females, age 30.14±9.45 years) and 127 age-, sex-matched normal controls (NC) (55 males and 72 females, age 28.95±9.55 years). We used the 14-item Hamilton Anxiety Scale (HAMA) and 17-item Hamilton Depression Scale (HAMD) to assess accompanying anxiety and depression symptoms in MDD patients.The images of all subjects were collected on a 3.0 SIEMES MR scanner. The resting-state fMRI data were obtained using a single-shot echo planar imaging sequence (TR/TE = 2000/30 ms, thickness = 5.0 mm, flip angle = 90°, FOV = 240 mm × 240 mm, matrix = 64 × 64, voxel size = 3.75 mm × 3.75 mm × 5.00 mm, slices = 30, volumes=175). Dynamic regional metrics analysis was performed using Temporal Dynamic Analysis (TDA) toolkits based on DPABI. We applied sliding window technique with a window size of 30 TR (60 seconds) and the shifting step size of 1 TR. Thus, the remaining 165 time points after preprocessing for each individual were segmented into 136 windows in total. In each sliding window, ALFF and ReHo were calculated. The standard deviation (SD) of ALFF values and ReHo values at each voxel across 136 windows was calculated to assess the variability of ALFF and ReHo, which were defined as dALFF and dReHo. For standardization, the dALFF and dReHo of each voxel were divided by the global mean dALFF and dReHo values within a gray matter mask, respectively. Finally, the mean normalized dALFF and dReHo maps were spatially smoothed using an isotropic Gaussian kernel of 6 mm full-width at half-maximum. Two-sample t tests were performed to assess the group differences in dALFF and dReHo between the MDD patients and NC, with age, sex and mean FD as covariates. AlphaSim correction was used for multiple comparisons to achieve a corrected p < 0.05 determined by the Monte Carlo simulation by a combination of a voxel-wise threshold of p < 0.001 and a minimum cluster size calculated by the AlphaSim program embedded in DPABI. For dALFF and dReHo of each brain region showing significant group effects, we estimated Pearson’s correlation between the parameters and the clinical variables in the MDD group (p<0.05).Results
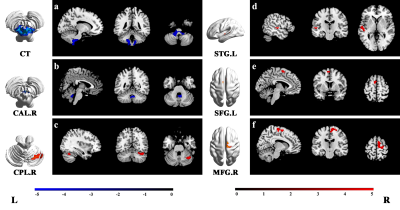
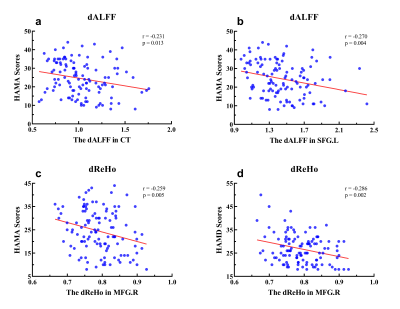
The significant differences in dALFF and dReHo between the MDD group and NC group are shown in Figures 1 and Figures 2, respectively. Compared with NC, MDD patients existed significantly decreased dALFF in the cerebellum including cerebellum tonsil (CT, Figures 1a) and right cerebellum anterior lobe (CAL.R, Figures 1b), whereas increased dALFF was found in right cerebellum posterior lobe (CPL.R, Figures 1c), left superior temporal gyrus (STG.L, Figures 1d), left superior frontal gyrus (SFG.L, Figures 1e) and right medial frontal gyrus (MFG.R, Figures 1f). Referring to the dReHo, comparing to the HC, the MDD patients showed a significant decrease dReHo in STG.L (Figures 2a), right inferior parietal lobule (IPL.R, Figures 2b) and MFG.R (Figures 2c). We found that HAMA scores significant negative correlated with dALFF in the CT (r = -0.231, p = 0.013; Figure 3a) and the SFG.L (r = -0.270, p = 0.004; Figure 3b). Both HAMA and HAMD scores correlated with dReHo in the MFG.R (r = -0.259, p = 0.005 and r = -0.286, p = 0.002 respectively; Figure 3c,d).Discussion and Conclusions
We found abnormalities of intrinsic brain activity variability in cerebellum, left superior temporal gyrus, left superior frontal gyrus, right medial frontal gyrus, and right inferior parietal lobule in patients with MDD. The alterations of dynamic brain activity in the cerebellum tonsil, left superior frontal gyrus and right medial frontal gyrus were correlated with the anxiety and depression symptoms in MDD group. These results indicate that the changes of dALFF and dReHo might underline functional injury and recovery in MDD patients, and the dynamic regional indexes might be potential tools to help us understand the neural mechanism of MDD from the perspective of temporal variation of brain region activity.Acknowledgements
This study is supported by grants from 1.3.5 Project for Disciplines of Excellence, West China Hospital, Sichuan University (ZYJC21041) and Clinical and Translational Research Fund of Chinese Academy of Medical Sciences (2021-I2M-C&T-B-097).References
[1] Pan Zihang,Park Caroline,Brietzke Elisa et al. Cognitive impairment in major depressive disorder.[J] .CNS Spectr, 2019, 24: 22-29.
[2] Fu Z, Tu Y, Di X, et al. Characterizing dynamic amplitude of low-frequency fluctuation and its relationship with dynamic functional connectivity: An application to schizophrenia. Neuroimage. 2018; 180:619-631.
[3] Jiao L , Xujun D , Qian C , et al. More than just statics: temporal dynamics of intrinsic brain activity predicts the suicidal ideation in depressed patients[J]. Psychological Medicine. 2018;1-9.
Figures


