3606
Altered Brain Regional Homogeneity at Resting-State in Spinocerebellar Ataxia Type 3 Patients1Department of Radiology, China Japan Friendship Hospital, Beijing, China, 2Graduate School of Peking Union Medical College, Beijing, China, 3Department of Neurology, China Japan Friendship Hospital, Beijing, China
Synopsis
To explore the neurofunctional change in spinocerebellar ataxia type 3 patients, regional homogeneity values were analyzed from this resting-state functional magnetic imaging study. The altered brain regional homogeneity mainly appeared in the left cerebellum and right cerebrum. And positive correlations were shown between regional homogeneity values for the right cerebrum and the clinical ataxia scores.
Introduction
Belonging to a group of neurodegenerative diseases, the spinocerebellar ataxia type 3 (SCA3) is the most common autosomal dominant ataxia subtype with slowly progressive degenerative disorders that affect the cerebellum and cerebellar pathways. This study aimed to investigate the abnormal regional homogeneity (ReHo) of the brain in patients with SCA3.Methods
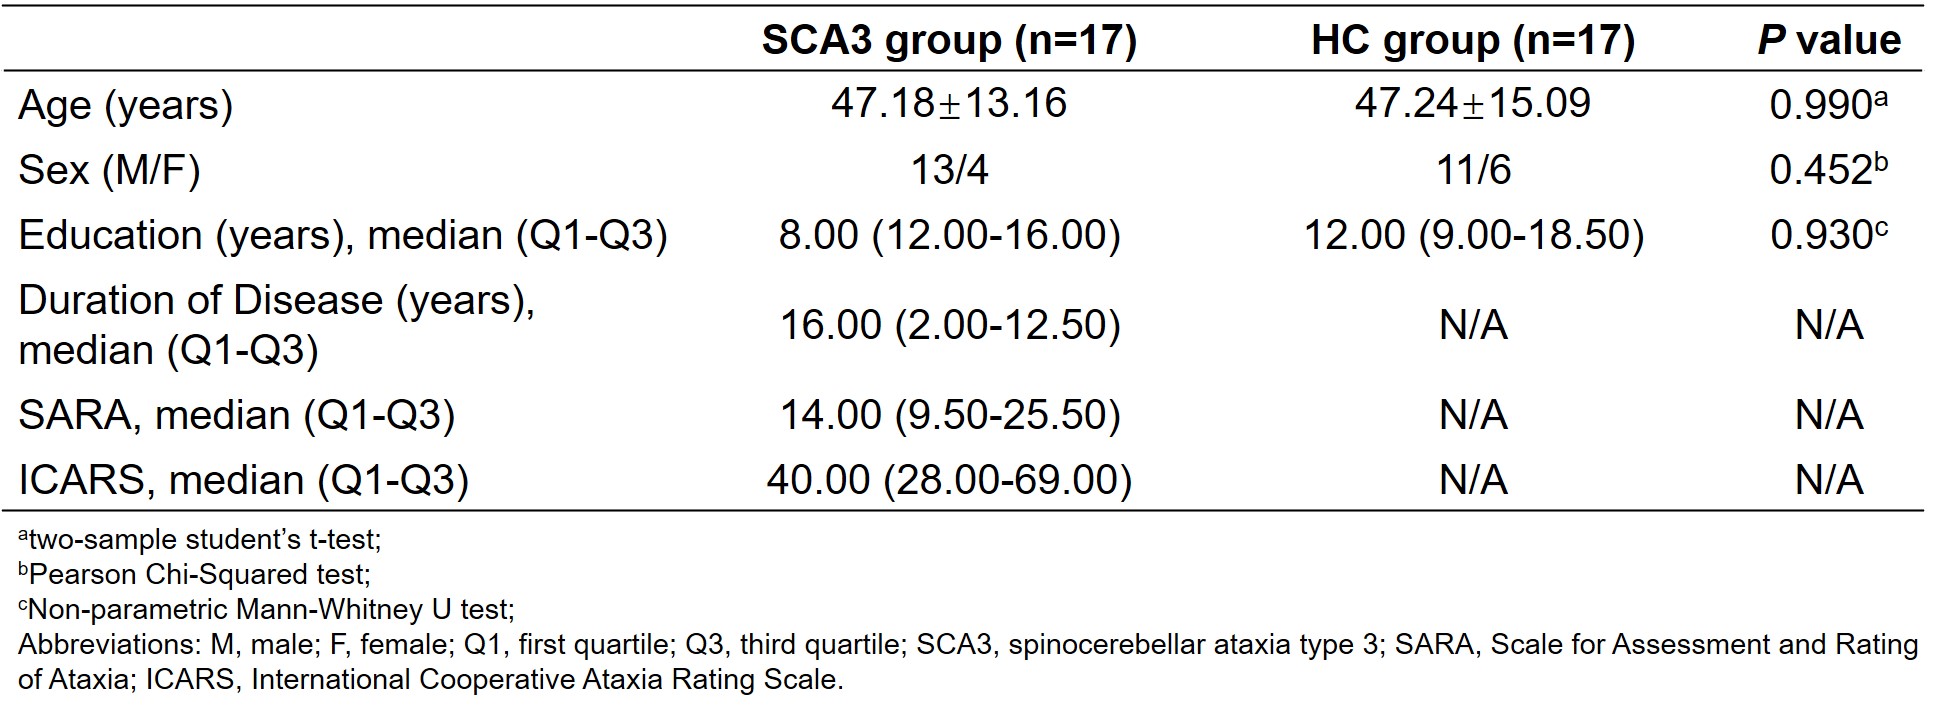
Seventeen SCA3 patients and seventeen age-, sex- and education-matched healthy controls (HC) were prospectively recruited into this study. MR data of all subjects were acquired by the use of a 3.0T scanner (GE, Discovery MR750, Milwaukee, United States) with an 8-channel head coil. Acquisition parameters for resting-state functional magnetic resonance imaging (rs-fMRI) with a single-shot gradient recalled echo-planar imaging sequence: slice thickness=3.5 mm, slice spacing=0.7 mm, repetition time (TR)=2,000 ms, echo time (TE)=30 ms, flip angle=90°, matrix=64×64, field of view (FOV)=224×224 mm2, number of excitations (NEX)=1, 34 slices and 240 phases. 3D T1WI structural images were reconstructed via three-dimensional fast spoiled gradient-echo sequences (3D FSPGR): slice thickness=1.0 mm, TR=6.7 ms, TE=min full, matrix=256×256, FOV=256×256 mm2, NEX=1. Data preprocessing, ReHo map generating and visualizing were done in the DPABI toolbox (v5.1) and SUIT1 toolbox (v3.4) based on MATLAB (R2020a). Two sample t-test was used in exploring the ReHo differences between the SCA3 group and the HC group. The Gaussian random field (GRF) method was performed for multiple comparison corrections, with voxel-level P < 0.005 and cluster-level P < 0.05. Then, correlations between the Scale for Assessment and Rating of Ataxia (SARA) as well as the International Cooperative Ataxia Rating Scale (ICARS) scores and the ReHo values of abnormal brain regions for SCA3 group were analyzed respectively by using Pearson’s correlation in SPSS software (v26.0).Results
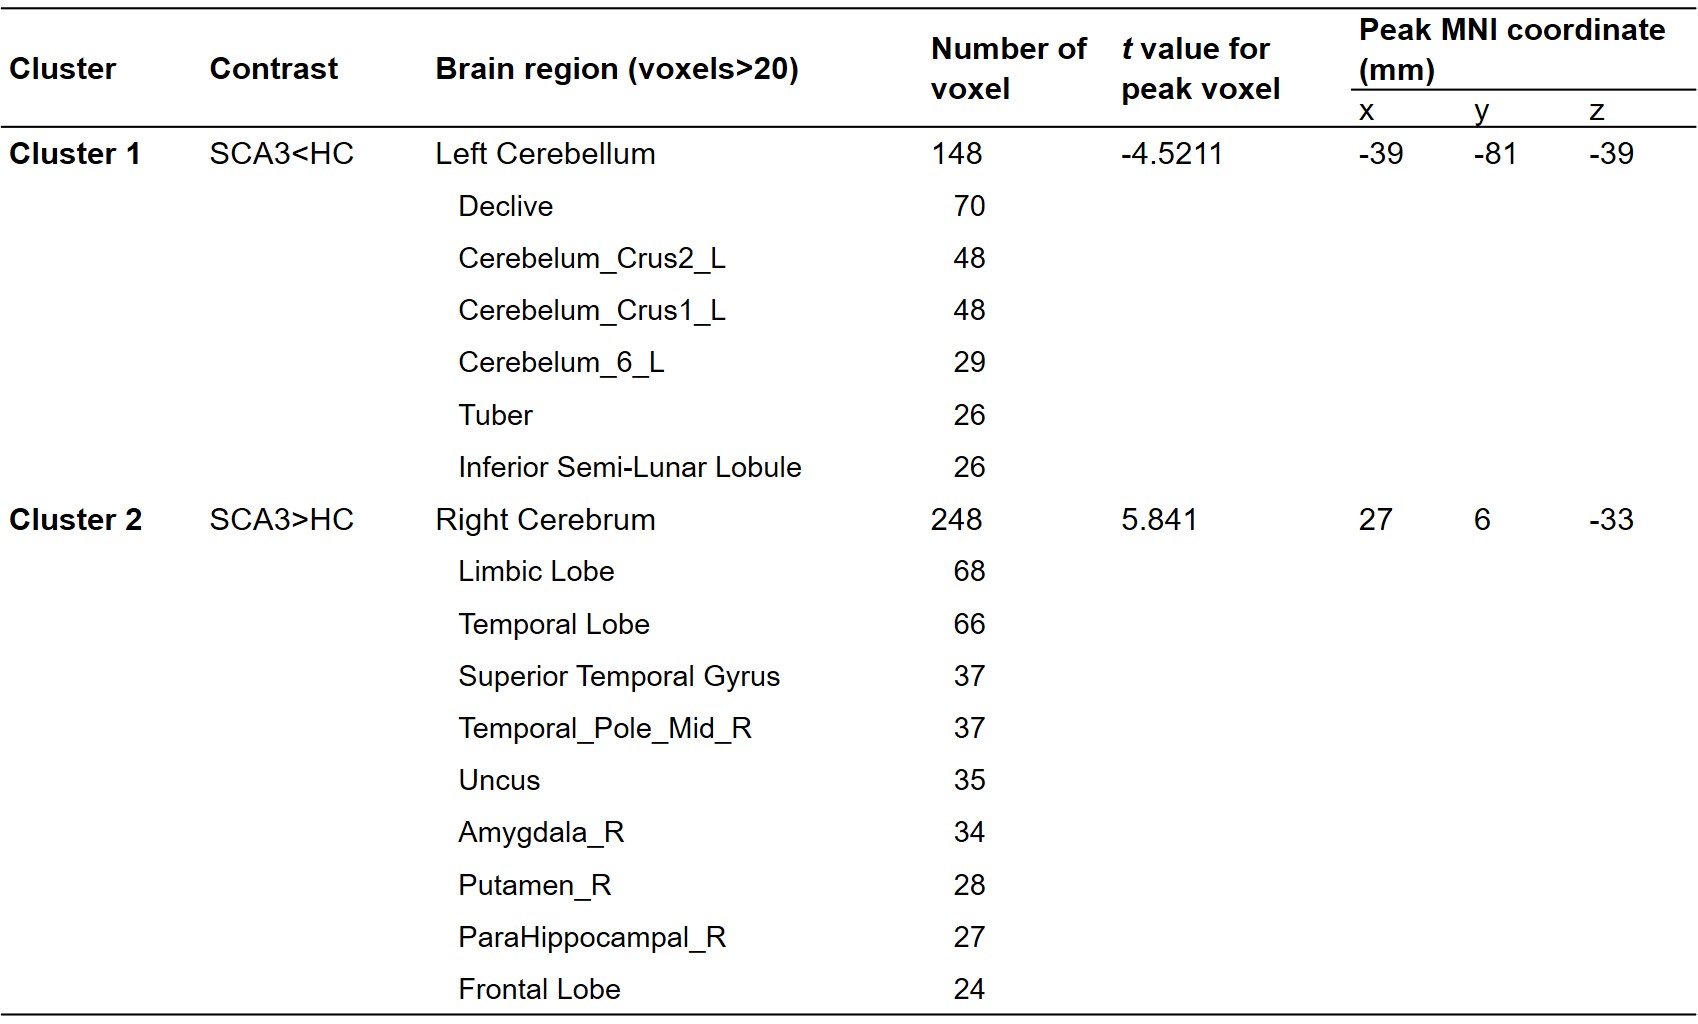
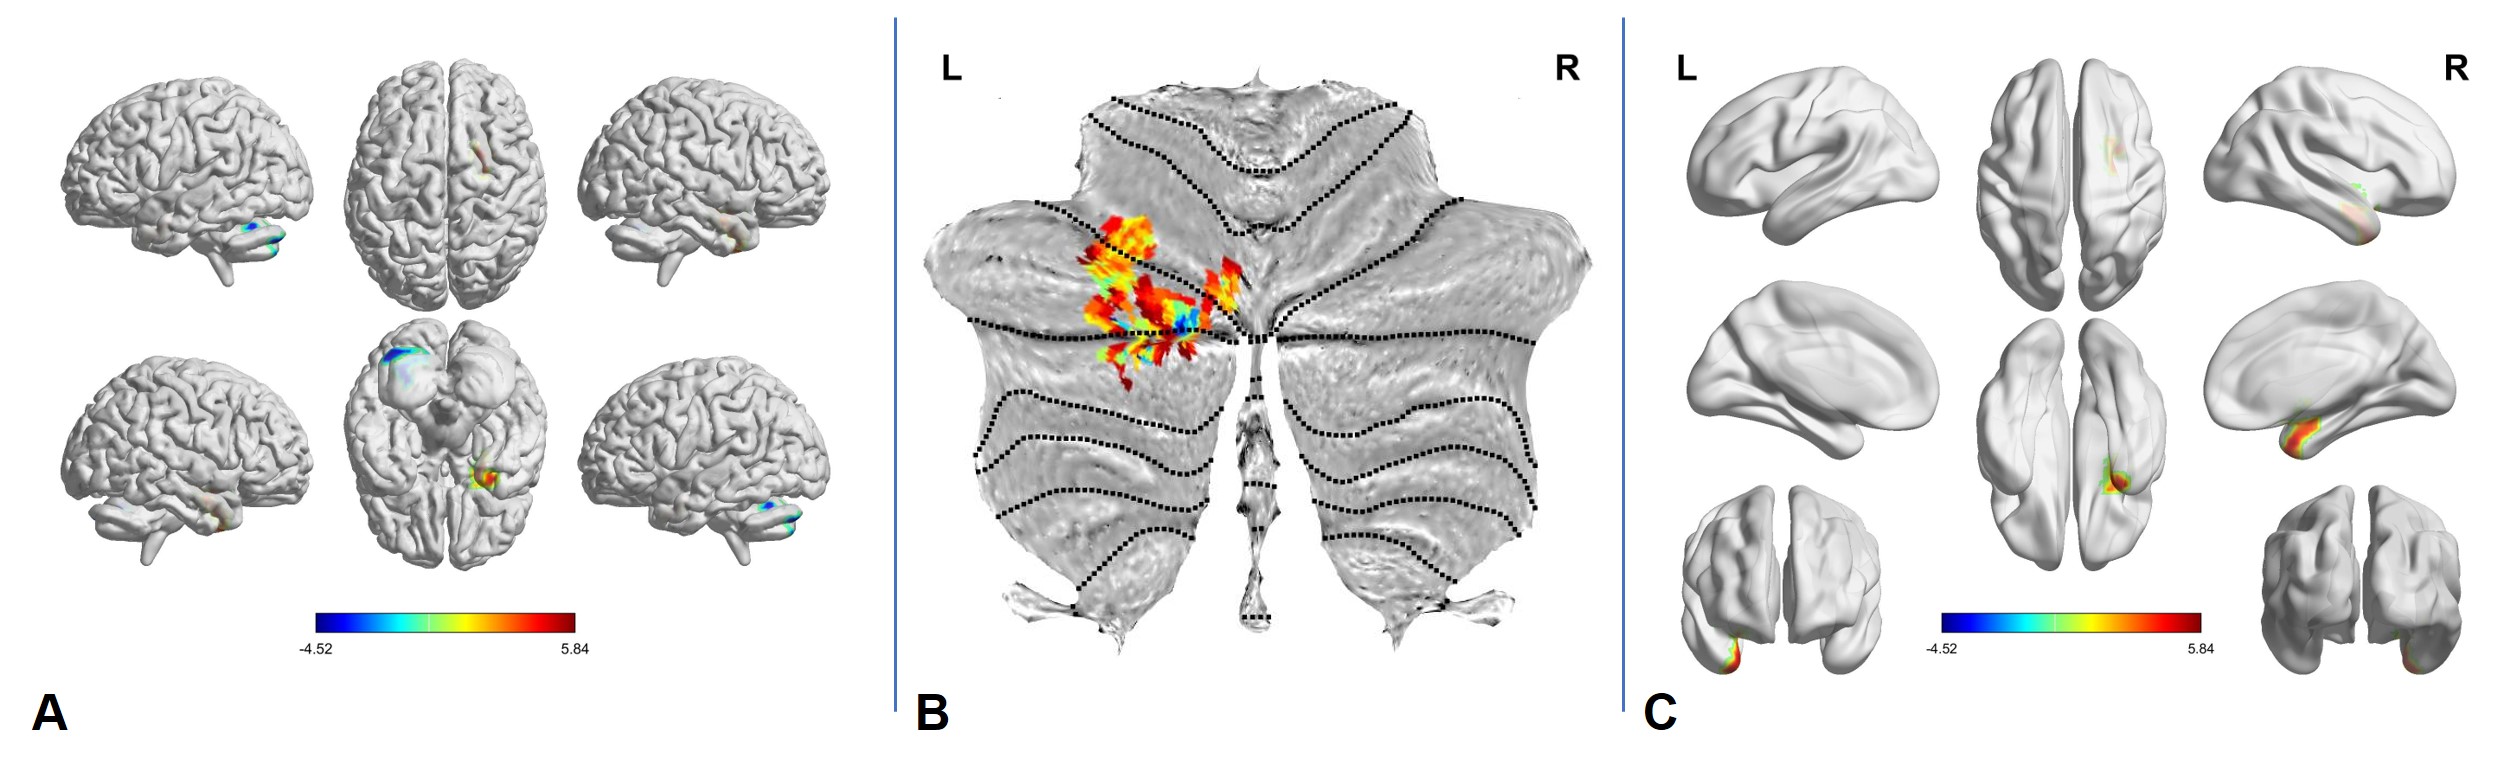
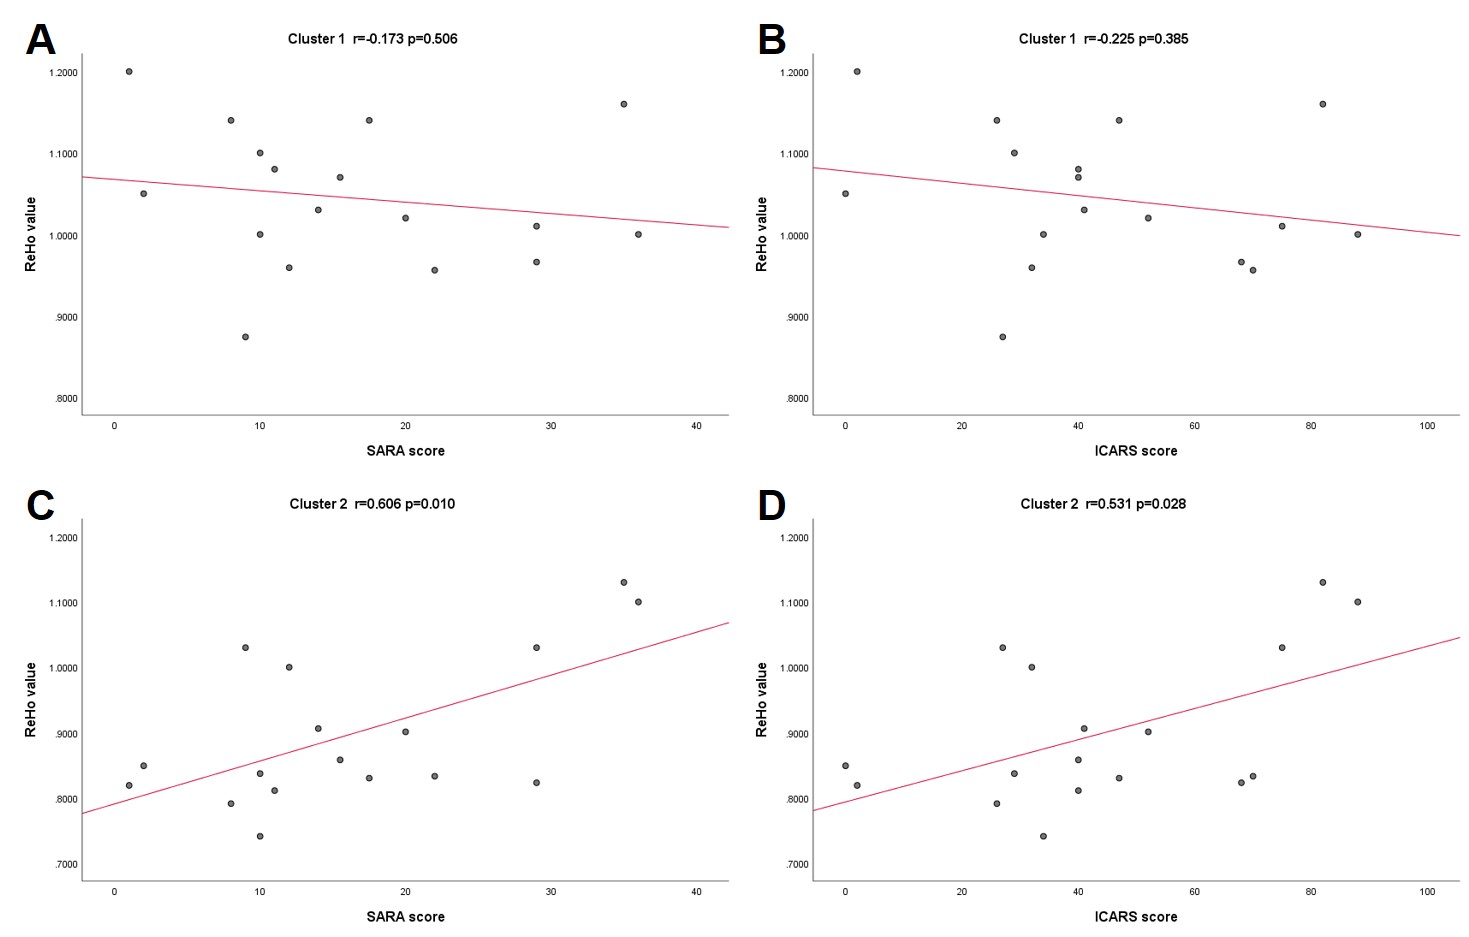
There were no significant differences in age, sex, and education level between the SCA3 group and the HC group (P>0.05) (Table 1). Significant group differences in ReHo values among the two groups were observed mainly in two clusters (Figure 1, 2A and Table 2). In Cluster 1 for the left cerebellum (e.g. declive, tuber semi-lunar lobule, etc.), especially in the Left VI, Left Crus I and Left Crus II of SUIT space, the ReHo values for SCA3 group were significantly lower than those for HC group (Figure 2B). On the contrary, compared to HC group, the SCA3 group showed significant increased ReHo values in the limbic lobe, temporal lobe, superior temporal gyrus, middle temporal pole, uncus, amygdala, putamen, parahippocampal and frontal lobe, gathered as Cluster 2, of the right cerebrum (Figure 2C). However, there was no significant correlation between altered ReHo values and SARA scores (Figure 3A) as well as ICARS scores (Figure 3B) in Cluster 1. Furthermore, altered ReHo values showed a strong correlation with SARA scores (Figure 3C) and a moderate correlation with ICARS scores (Figure 3D) in Cluster 2.Discussion and Conclusion
As an analysis method of rs-fMRI, ReHo can quantify the local brain function and reflect the time synchronization of regional neural activities2. The results indicate that the asynchronized neural activities happened within the specific regions of the left cerebellum and right cerebrum may be the neuroimaging characteristics of SCA3. Furthermore, in Cluster 1 of the left cerebellum, the abnormal cerebellar areas such as declive and tuber were found critical for controlling postural balance, saccadic eye movements and coordination. However, different from the most common characteristics like cerebellar atrophy in SCA3, the volumes of declive and tuber were revealed larger among sportspeople3. It is also worth noting that between the two clinical ataxia scores, the SARA4 scores performed a stronger positive correlation of ReHo values in Cluster 2 than the ICARS scores did. Therefore, the altered ReHo value can serve as a functional marker for reflecting the severity of the SCA3 symptoms.Acknowledgements
We
thank Lizhi Xie from GE Healthcare for the help in solving MR technical
problems.
References
1. Diedrichsen J. A spatially unbiased atlas template of the human cerebellum. Neuroimage. 2006 Oct 15;33(1):127-38.
2. Zang Y, Jiang T, Lu Y, He Y, Tian L. Regional homogeneity approach to fMRI data analysis. Neuroimage. 2004 May;22(1):394-400.
3. Park IS, Lee NJ, Rhyu IJ. Roles of the Declive, Folium, and Tuber Cerebellar Vermian Lobules in Sportspeople. J Clin Neurol. 2018 Jan;14(1):1-7.
4. Schmitz-Hübsch T, du Montcel ST, Baliko L, Berciano J, Boesch S, Depondt C, Giunti P, Globas C, Infante J, Kang JS, Kremer B, Mariotti C, Melegh B, Pandolfo M, Rakowicz M, Ribai P, Rola R, Schöls L, Szymanski S, van de Warrenburg BP, Dürr A, Klockgether T, Fancellu R. Scale for the assessment and rating of ataxia: development of a new clinical scale. Neurology. 2006 Jun 13;66(11):1717-20.
Figures