3604
The Brain Functional Connectivity can Predict Response to Treatment with Transcutaneous Auricular Vagus Nerve Stimulation in Primary Insomnia1The Second Clinical College, Guangzhou University of Chinese Medicine, Guangzhou, China, 2Department of Radiology, The Second Affiliated Hospital of Guangzhou University of Chinese Medicine, Guangzhou, China, 3Philips Healthcare, Guangzhou, China, 4Department of Sleep Disorder, Fangcun Branch, The Second Affiliated Hospital of Guangzhou University of Chinese Medicine, Guangzhou, China
Synopsis
The individual response to treatment with the transcutaneous auricular vagus nerve stimulation ( taVNS ) in primary insomnia varies greatly, while there is lack of objective markers for patient’s treatment outcome. In this work, we demonstrated that the baseline functional connectivity combined with machine learning algorithms can predict response to treatment with taVNS in primary insomnia. The functional connectivity values within and between brain networks such as the default mode network, affective network, visual network, and cerebellar network maybe potential objective markers of patient’s treatment outcome.
Introduction
Transcutaneous auricular vagus nerve stimulation (taVNS) is effective to treat primary insomnia (PI), but the individual response to taVNS treatment varies greatly. Therefore, it is necessary to screen patients suitable for taVNS before treatment, however, there is a lack of reliable objective markers. In this study, we used the baseline resting-state functional connectivity (rsFC) as features combined with machine learning algorithms to predict the individual response to treatment with taVNS in patients with chronic primary insomnia (CPI).Methods
Firstly, resting-state functional magnetic resonance imaging (rs-fMRI) was performed in recruited patients with CPI (n=77). After 4 weeks of taVNS treatment, these patients’ outcomes were labeled as effective or ineffective according to whether the efficacy score of the Pittsburgh Sleep Quality Index (PSQI) was greater than 25%. Secondly, the rsFC matrix was calculated based on the automatic anatomical marker map as the features, and the features with distinguishing ability were screened out through the F-score and 10 - fold cross-validation methods. Then the Multi-Voxel Pattern Analysis (MVPA) method based on the logistic regression classifier was used to predict the efficacy classification of these patients, and the contingency degree of accuracy was evaluated by permutation test. Finally, the performance of the prediction model was evaluated by using the area under the receiver operator characteristic curve (AUC), accuracy, sensitivity, and specificity.Results
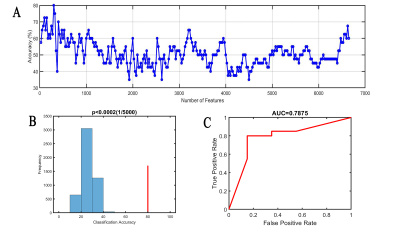
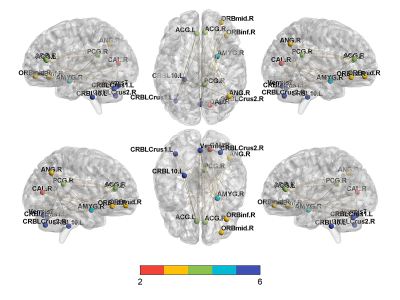
When the edges of the rsFC matrix were 300, the accuracy of the prediction model was the highest, achieved a correct classification rate of 80% (permutation test, 5000 times, P<0.0002) [sensitivity 80%, specificity 80%, and the AUC 0.7875] for differentiating effective subjects (n=20) from ineffective subjects (n=20). Brain areas that contributed most to the classification model were mainly located within the right posterior cingulate gyrus, right angular gyrus, bilateral anterior cingulate gyrus, right amygdala, right orbitofrontal gyrus, right calcarine, and cerebellum. Furthermore, the consensus connections to distinguish effective or ineffective patients were largely located within or between the default mode network (DMN), affective network (AN), visual network (VN), and cerebellar network (CE).Discussion
Previous neuroimaging studies [1-5] have shown that the abnormal functional activities in DMN, AN, VN, and CE networks are related to insomnia. Furthermore, our results show that the FC within and between the DMN, AN, VN, and CE networks can predict the efficacy of taVNS treatment in insomnia, indicating that the functional activities of these networks are related to the response to treatment with taVNS in the patients with PI and may be objective markers of the efficacy.Conclusions
These findings suggest that the baseline rsFC within and between these brain networks, such as DMN, AN, VN, and CE, combined with machine-learning algorithms, can provide crucial insights into pathophysiological mechanisms, objective treatment outcome markers, and the individual effectiveness of the taVNS in CPI.Acknowledgements
The authors thank the volunteers and the investigators who took part in the study.References
1. Wu X, Zhang Y, Luo W, et al. Brain Functional Mechanisms Determining the Efficacy of Transcutaneous Auricular Vagus Nerve Stimulation in Primary Insomnia. Frontiers in Neuroscience. 2021 Mar; 15: 186.
2. Ma X, Fu S, Yin Y, et al. Aberrant Functional Connectivity of Basal Forebrain Subregions with Cholinergic System in Short-term and Chronic Insomnia Disorder. J Affect Disord. 2021; 278: 481-487.
3. Dai XJ, Liu BX, Ai S, et al. Altered inter-hemispheric communication of default-mode and visual networks underlie etiology of primary insomnia: Altered inter-hemispheric communication underlie etiology of insomnia. Brain Imaging Behav. 2020 Oct;14(5):1430-1444.
4. Gong L, Yu S, Xu R, et al. The abnormal reward network associated with insomnia severity and depression in chronic insomnia disorder. Brain Imaging Behav. 2021 Apr;15(2):1033-1042.
5. Wu Y, Zhou Z, Fu S, et al. Abnormal Rich Club Organization of Structural Network as a Neuroimaging Feature in Relation with the Severity of Primary Insomnia. Front Psychiatry. 2020 Apr;11: 308.
Figures


