3596
Brain structural development on oriental and occidental neonates: a comparison between ITPNBDI and dHCP datasets1Department of Radiology, The First Affiliated Hospital of Xi'an Jiaotong University, Xi'an, China, 2Department of Research and Development, Shanghai United Imaging Intelligence Co., Ltd., Shanghai, China
Synopsis
Despite studies that have demonstrated population differences due to differences in genetics, culture, and environmental exposures, a comparison of brain structural development between oriental and occidental neonates remains to be fully examined. We compared 108 neonates from ITPNBDI and 170 neonates from dHCP to examine differences in neonatal brain structure. Results demonstrated ITPNBDI neonates held shorter brain length, wider brain width and higher brain height than dHCP neonates. They also had greater total brain volume, greater grey matter and less white matter than dHCP neonates. Specifically, volumes of some brain regions involved in speech perception were different between two datasets.
Introduction
There is a growing literature finding variations in brain structure between different cultural groups, and these differences are caused by a combination of genetic and environmental factors.[1-3] Above all, it is difficult to apply the previous results to the neonates because most of the studies were conducted in children, adolescents and adults. As the prevalence, severity and rate of diagnosis of neurodevelopmental disorders vary by population, the earlier detection of these differences has clinical significance for appropriate intervention and prevention of these diseases. [4]Detecting genetic, cultural, and environmental differences at an earlier stage may decrease the inaccuracy of the studying results. [5]Methods
The MRIs for oriental participants were collected from 108 neonates, whose postmenstrual ages ranged from 37 through 45 weeks. These participants were recruited from the Image Technique& Prediction for Neonatal Brain Development& Injury (ITPNBDI) datasets and had the normal appearance for age. We compared them to an age-matched cohort of 170 occidental neonates (Table 1). MR images were acquired as a part of the Developing Human Connectome Project (dHCP) (http://www.developingconnectome.org/). The dHCP datasets were acquired on a 3T Philips Achieva using a dedicated neonatal imaging system which included a neonatal 32-channel phased-array head coil.[6] T2 (TR/TE=12000/156ms) and inversion recovery T1 (TR/TE=4795/8.7ms) images were acquired in sagittal and axial slices with overlapping slices (resolution 0.8×0.8×1.6mm3). For ITPNBDI datasets, MRI examinations were underwent using a 3T scanner (Signa HDxt, GE Healthcare, Milwaukee, WI) with an 8-channel head coil. The 3D T1-weighted images were obtained by using a fast spoiled gradient-recalled echo sequence with imaging parameters: repetition time (TR) = 10.2, 10.47 ms, echo time (TE) = 4.64,76 ms, inversion time (TI) = 400 ms, field of view = 240 × 240 mm2; Acquisition matrix = 240 × 240; reconstruction matrix = 256 × 256; slice thickness = 1 mm, and voxel size of the reconstructed images = 0.9375 × 0.9375 × 1 mm3. The global brain size of neonates was quantified on the T1 images. The anterior commissure (AC) and posterior commissure (PC) line length, brain length, brain weight and brain height were important measurements, which obtained using BrainSuite. Brain length was the distance from the front pole to the back pole on the transverse plane. Brain width was the distance from the left pole to the right pole on the coronal plane. And brain height was the distance from the top pole to the bottom pole on the sagittal plane (Fig.1).[5, 7, 8] With the dHCP brain parcellation criteria, a deep learning model was trained to segment the brain into 87 regions by using the V-Net with bottleneck layer.[9-12]We tested the volumetric differences in different regions between these two datasets.Results
Neonates of different groups had significant differences in brain length (ITPNBDI vs dHCP: 101.81±5.24mm vs 103.88±5.37mm, P=0.002), brain width (ITPNBDI vs dHCP: 87.95±4.40mm vs 83.84±4.30mm, P<0.001), and brain height (ITPNBDI vs dHCP: 58.87±5.16mm vs 54.75±4.50mm, P<0.001) (Table 2). However, there was no statistical difference in the AC-PC distance. In addition to the nationality effects, both ITPNBDI and dHCP neonates showed increases over these ages in the above measurements. Neonates in ITPNBDI had greater total brain volume (TBV) (ITPNBDI vs dHCP: 418.54±50.36cm3 vs 391.62±48.93 cm3, P<0.001), greater grey matter (GM) (ITPNBDI vs dHCP: 168.13±22.16 cm3 vs 162.81±25.06 cm3, P=0.065) and less white matter (WM) (ITPNBDI vs dHCP: 139.74±16.21 cm3 vs 149.76±16.95 cm3, P<0.001) than dHCP cohorts (Table 3). Fig.2 compared the total volume development of 87 regions separately for brains in ITPNBDI and dHCP. After analyzing the volumes of all the 87 structures in the two groups, we found that in some brain regions, the ITPNBDI and dHCP neonatal brains were significantly different. False Discovery Rate (FDR)was used to correct for multiple comparisons with a significant threshold of P <0.05.Discussion
By comparing between ITPNBDI and dHCP datasets, this study demonstrated brain structural differences between oriental and occidental neonates. Though previous studies have shown the similar differences across populations of school-age children, adolescents and adults[7, 8], this current work provided additional evidence of oriental-occidental differences during the neonatal period. Specifically, the differences mainly located in regions associated with functions of speech/voice perception. This may be results from exposure of different language environments during the prenatal and early postnatal periods. Additionally, previous studies have shown there exists a correlation between local brain volume and cognitive performance[13]. Furthermore, results here indicate that several regions involving GM are larger in ITPNBDI, while those involving WM are larger in dHCP. This may be related to differences in nutritional and/or living environment factors. Several limitations of the current study need to be addressed. First, structural brain asymmetry differences should be further deeply studied. Next, cortical thickness, volume and surface area are expected to be included in the future.Conclusion
Brain structural differences between the orient and occident already existed at birth.Acknowledgements
This study was supported by the National Natural Science Foundation of China (81901823, 81971581, and 81901516), the Innovation Team Project of Natural Science Fund of Shaanxi Province (2019TD-018). Please address correspondence to Jian Yang, e-mail: yj1118@mail.xjtu.edu.cn and Xianjun Li, e-mail: xianj.li@mail.xjtu.edu.cn.
References
1. Isamah, N., et al., Variability in frontotemporal brain structure: the importance of recruitment of African Americans in neuroscience research. PLoS One, 2010. 5(10): p. e13642.
2. Chee, M.W., et al., Cognitive function and brain structure correlations in healthy elderly East Asians. Neuroimage, 2009. 46(1): p. 257-269.
3. Kochunov, P., et al., Localized morphological brain differences between English-speaking Caucasians and Chinese-speaking Asians: new evidence of anatomical plasticity. Neuroreport, 2003. 14(7): p. 961-964.
4. Kang, D.W., et al., Differences in cortical structure between cognitively normal East Asian and Caucasian older adults: a surface-based morphometry study. Scientific reports, 2020. 10(1): p. 1-9.
5. Bai, J., et al., Population differences in brain morphology and microstructure among Chinese, Malay, and Indian neonates. PloS one, 2012. 7(10): p. e47816.
6. Hughes, E.J., et al., A dedicated neonatal brain imaging system. Magnetic resonance in medicine, 2017. 78(2): p. 794-804.
7. Tang, Y., et al., The construction of a Chinese MRI brain atlas: a morphometric comparison study between Chinese and Caucasian cohorts. Neuroimage, 2010. 51(1): p. 33-41.
8. Xie, W., et al., Comparison of the brain development trajectory between Chinese and US children and adolescents. Frontiers in systems neuroscience, 2015. 8: p. 249.
9. Tustison, N.J., et al., N4ITK: improved N3 bias correction. IEEE transactions on medical imaging, 2010. 29(6): p. 1310-1320.
10. Smith, S.M., Fast robust automated brain extraction. Human brain mapping, 2002. 17(3): p. 143-155.
11. Makropoulos, A., et al., Automatic whole brain MRI segmentation of the developing neonatal brain. IEEE transactions on medical imaging, 2014. 33(9): p. 1818-1831.
12. Gousias, I.S., et al., Magnetic resonance imaging of the newborn brain: manual segmentation of labelled atlases in term-born and preterm infants. Neuroimage, 2012. 62(3): p. 1499-1509.
13. Kobayakawa, M., Voxel-Based Morphometry and Social Cognitive Function in Parkinson's Disease. Brain and nerve= Shinkei kenkyu no shinpo, 2017. 69(11): p. 1323-1329.
Figures
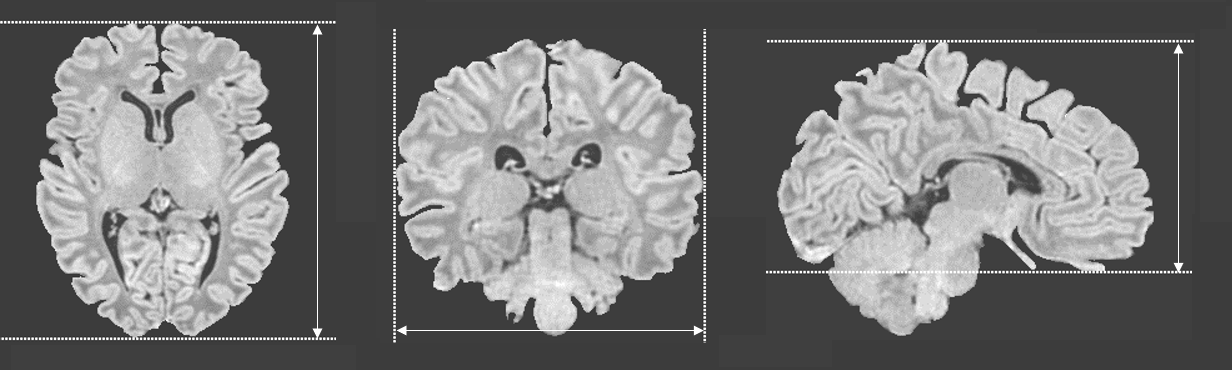
Figure 1 Measurements of brain length, brain width and brain height.
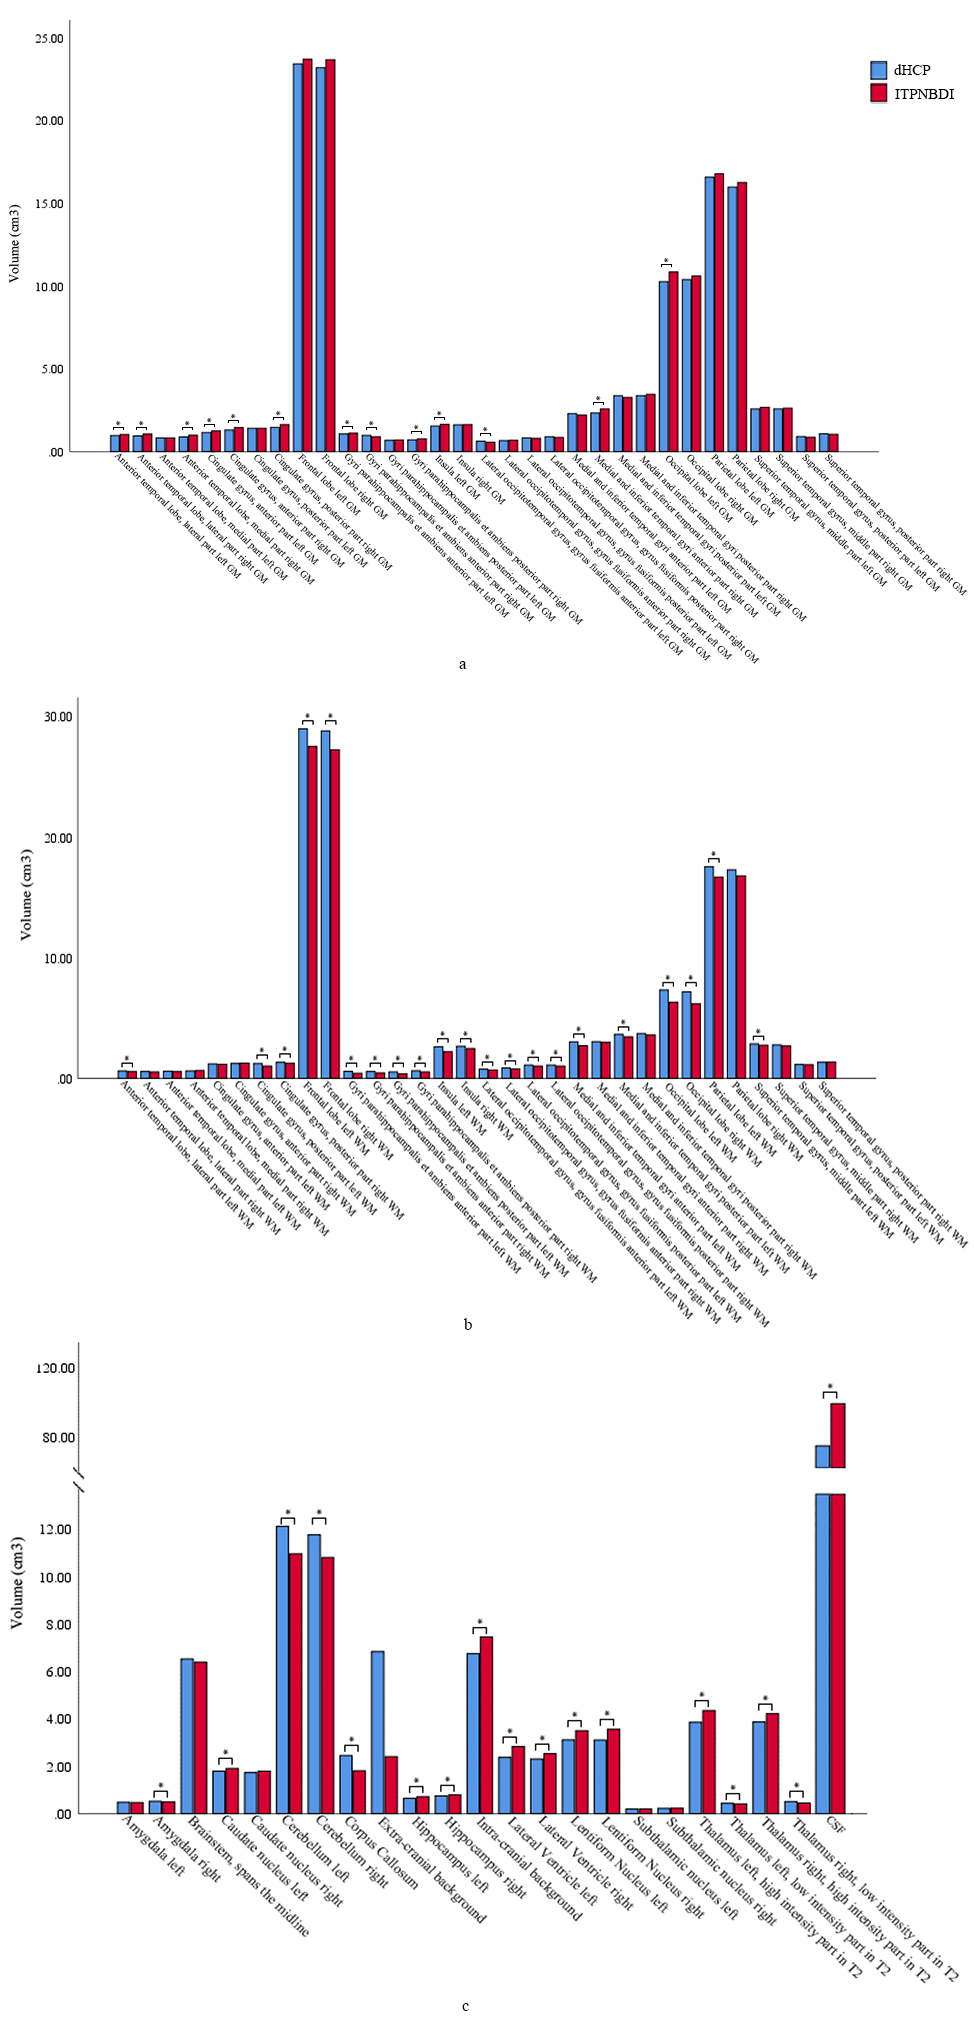
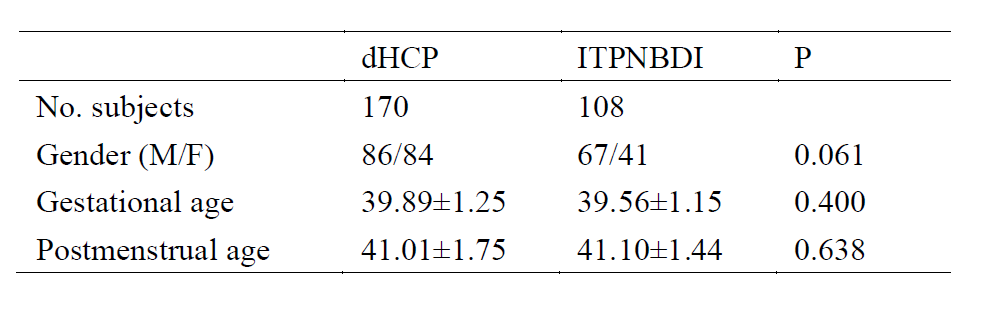
Table 1 Demographic information of subjects.
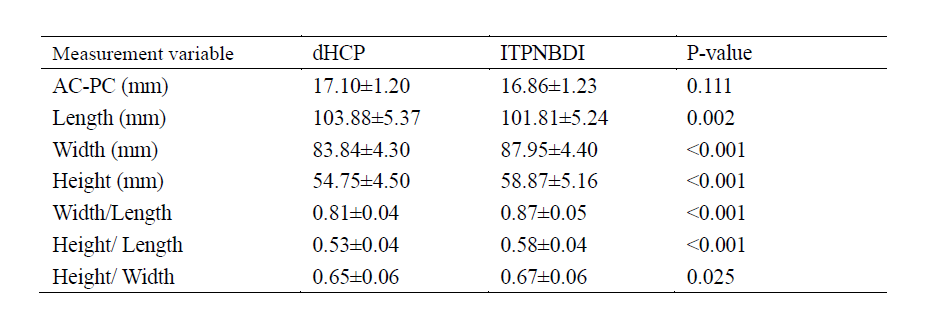
Table 2 The comparisons of brain morphology between ITPNBDI and dHCP neonates.
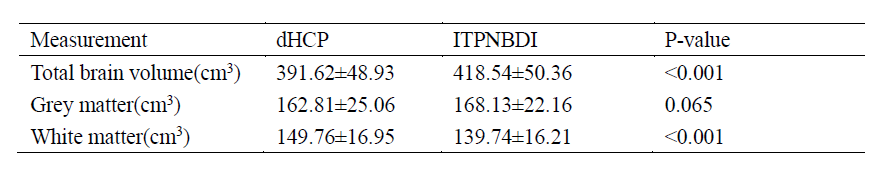
Table 3 The comparisons of total brain volume, grey matter and white matter between ITPNBDI and dHCP neonates.