3595
Measuring the stiffness of subcortical gray matter structures with virtual MR elastography in preterm and term infants1the first affiliated hospital of Xi'an Jiaotong university, Xi'an, China
Synopsis
MR elastography is a promising approach for describing biomechanical properties. Some studies investigated stiffness of subcortical gray matter (SGM), which are critical for cognitive. However, they have not been explored in infants. MRE has some limitations in application of infants, and this study aims to measure SGM stiffness in preterm and term infants using virtual MRE. Our study suggested that virtual shear stiffness of SGM were similar between the preterm at term equivalent and the term, and GP is the stiffest region. This finding suggested that virtual MRE is a sensitive method to characterize the SMG maturity in infants.
Introduction
Changes in tissue composition and cellular architecture have been associated with neurological development and disease, and these in turn can affect biomechanical properties[1]. Natural biological factors such as growth and aging, can affect underlying tissue biomechanics in different brain regions[2]. With the development of MR elastography, it was a promising approach for describing brain stiffness, and has great potential to reflect pathology in tissue microstructures[3]. Since the subcortical gray matter (SGM) structures are critical for cognitive performance, executive function and skill learning[4], previous study have investigated their stiffness using MR elastography (MRE) in youth and adults[5]. However, the SGM stiffness has not been explored in infants. Because of MRE lacks in image resolution, relies on dedicated hardware and software, and adds to examination time, it has limitations in the application of neonates and infants[6]. Recently, Le Bihan et.al proposed a novel method that based on a clinically available diffusion MRI sequences, known as virtual MRE (vMRE), is attractive for evaluation of brain development[6]. Thus, this study aims to measure the stiffness of SGM structures in preterm and term infants using vMRE.Methods
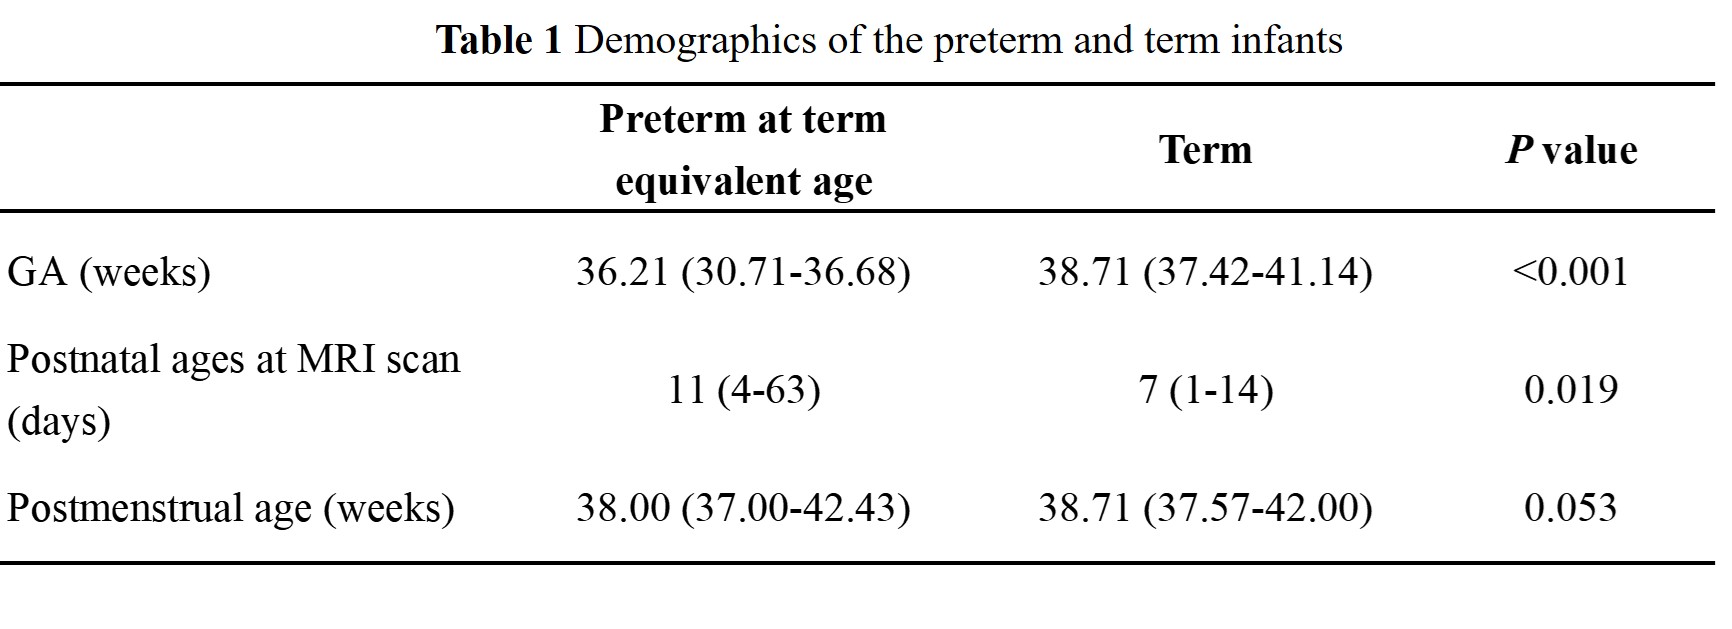
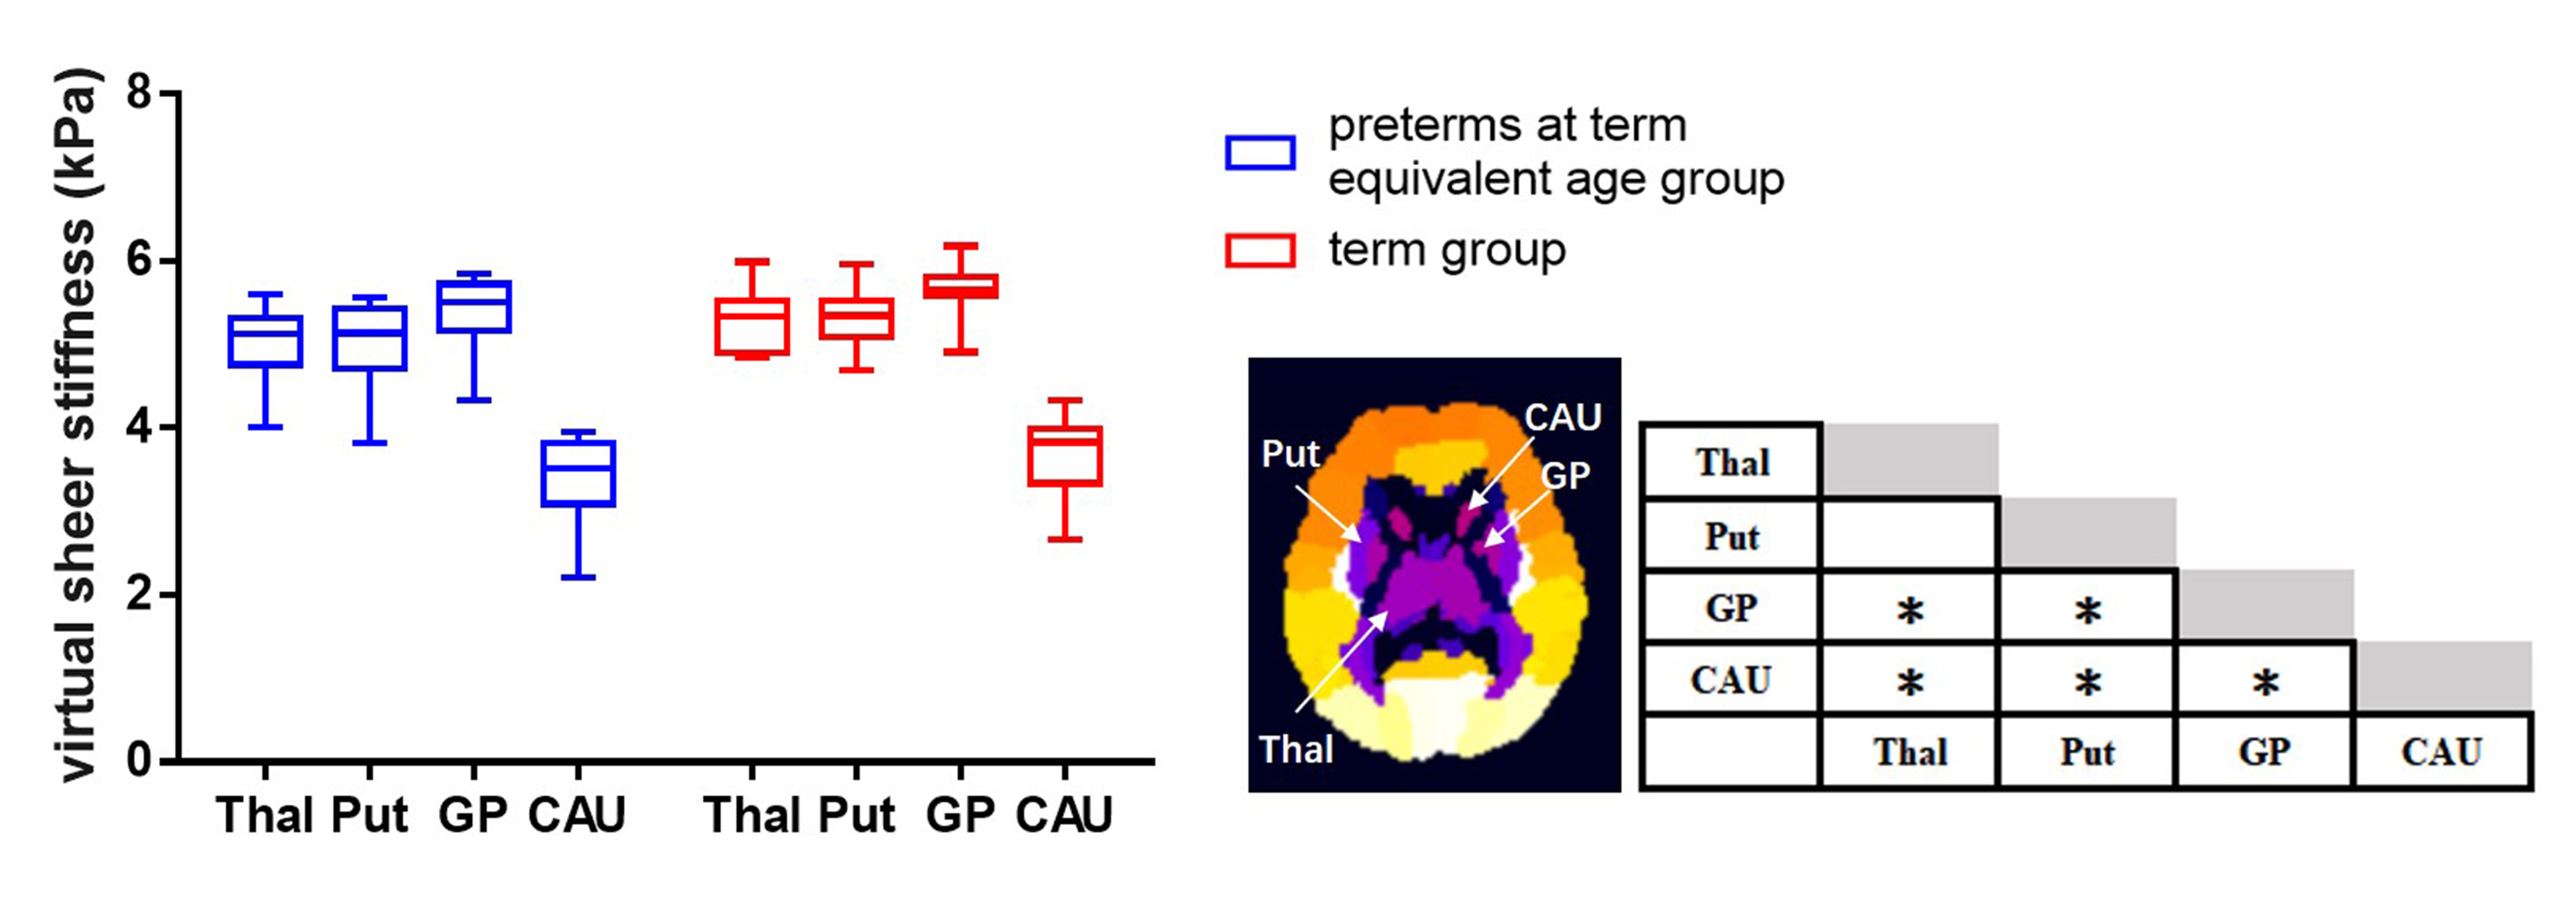
The local institutional review board approved this study and all the written informed consents were obtained from parents of infants. Subjects Preterm infants scanned at term equivalent age and term infants without any MRI abnormality were included. Subjects with obvious imaging artifacts were excluded. MRI Protocols All MR examinations were performed using a 3T scanner (Signa HDxt, GE Healthcare, Milwaukee, Wisconsin) with an 8-channel head coil. The parameters of DKI sequence were as follows: b values =0, 50, 200, 500, 1000, 2000, 2500 s/mm2; 18 gradient directions per nonzero b value; repetition time/echo time=11000/91.7 ms; slice thickness =4 mm; field of view=180×180 mm2; acquisition matrix=128×128. Data and statistical analysis DKI images of the lower b-value (Slow, b value=200 s/mm2) and those of the higher b-value (Shigh, b value=1000 s/mm2) were used to estimate the virtual shear stiffness[6, 7]: virtual shear stiffness = a·ln (Slow/Shigh) + b. The scaling (a) and the shift (b) factors were separately set to −9.8 and 14 according to the previous calibration studies[6, 7]. DKI-derived FA and MK maps were also calculated. All individual images were firstly registered to the group mean image, and then registered to the JHU neonatal brain atlas using a combination of linear and nonlinear methods[8]. Finally, thalamus, putamen, globus pallidus (GP) and caudate nucleus of each hemisphere were selected for comparison according to the atlas (Figure 1). The values of bilateral ROIs were averaged for further analysis. Wilcoxon signed-rank tests were used to assess between-group differences in demographicsand parameters. Wilcoxon paired tests were used for the differences of mentioned values among SGM structures in each group. All statistical analysis was performed by using SPSS 19.0 (SPSS, Chicago, IL, USA); P<0.05 was considered as statistically significant difference. In multiple comparisons, P<0.008 (0.05/6) was considered statistically significant after the Bonferroni correction.Results
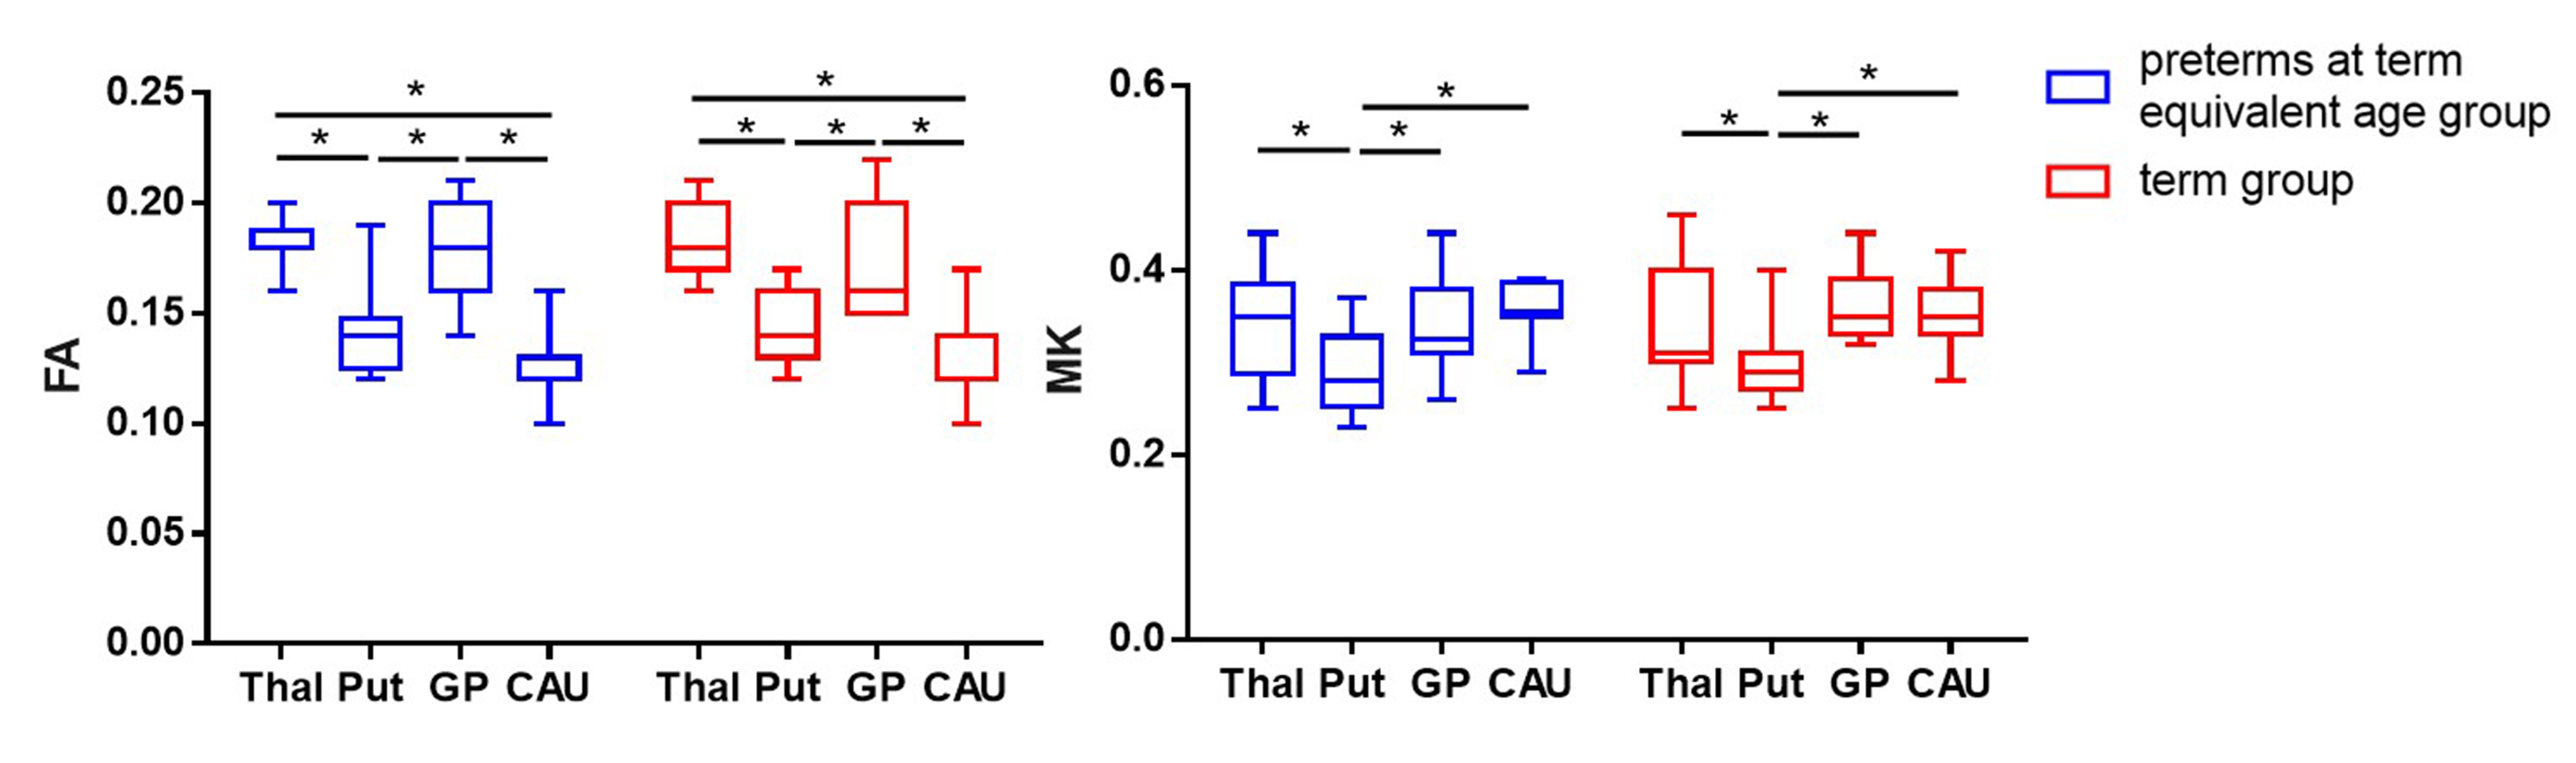
A total of 12 preterm and 11 term infants were enrolled (Table 1). No significant differences were found in virtual shear stiffness, FA and MK between groups (P>0.05). There is a significant difference in virtual shear stiffness among SMG structures in both groups, in which the GP is the stiffest region and caudate nucleus is the softest (P<0.008, Figure1). The GP and thalamus demonstrate relatively higher FA and MK values compared with other regions, the caudate nucleus and putamen show the relatively lower FA and MK, respectively (P<0.008, Figure2).Discussion
This study suggested that the virtual shear stiffness of SGM were similar between the preterm at term equivalent age and the term, and GP is the stiffest region at this period. This reflects that preterm infants could catch up term infants in stiffness in the SGM regions. GP as the stiffest region among the SGM structures in both groups, which may be related to the maturity. The higher FA and MK of GP were further confirmed this, and it is consistent with previous study[9]. More importantly, FA and MK could not distinguish between GP and thalamus, while vMRE results showed that the virtual shear stiffness of GP was higher than thalamus. It is possible that GP has early neuronal development and synaptic connections[10]. Since this method for quantitative evaluation of brain stiffness is an exploratory study based on the diffusion and DKI-based sequences proposed by Le Bihan et.al[6], its relationship with the real stiffness value needs further exploration.Conclusion
Compared with conventional DKI-derived parameters, virtual MRE is a sensitive method to characterize the maturity of SMG structures. It may have broad prospects in detecting protentional injury in infants.Acknowledgements
This study was supported by the National Natural Science Foundation of China (No. 82101815, 81971581, 81771810, 81471631 and 51706178), and the Clinical Research Award of the First Affiliated Hospital of Xi’an Jiaotong University (No. XJTU1AF-CRF-2015-004).References
[1] Murphy MC, Huston J, 3rd, Ehman RL. MR elastography of the brain and its application in neurological diseases [J]. NeuroImage, 2019, 187(176-83.
[2] Arani A, Murphy MC, Glaser KJ, et al. Measuring the effects of aging and sex on regional brain stiffness with MR elastography in healthy older adults [J]. NeuroImage, 2015, 111(59-64.
[3] Riek K, Millward JM, Hamann I, et al. Magnetic resonance elastography reveals altered brain viscoelasticity in experimental autoimmune encephalomyelitis [J]. NeuroImage Clinical, 2012, 1(1): 81-90. [4] Laforce R, Jr., Doyon J. Distinct contribution of the striatum and cerebellum to motor learning [J]. Brain and cognition, 2001, 45(2): 189-211.
[5] Hiscox LV, Johnson CL, Barnhill E, et al. Magnetic resonance elastography (MRE) of the human brain: technique, findings and clinical applications [J]. Physics in medicine and biology, 2016, 61(24): R401-r37.
[6] Le Bihan D, Ichikawa S, Motosugi U. Diffusion and Intravoxel Incoherent Motion MR Imaging-based Virtual Elastography: A Hypothesis-generating Study in the Liver [J]. Radiology, 2017, 285(2): 609-19.
[7] Lagerstrand K, Gaedes N, Eriksson S, et al. Virtual magnetic resonance elastography has the feasibility to evaluate preoperative pituitary adenoma consistency [J]. Pituitary, 2021, 24(4): 530-41. [8] Oishi K, Mori S, Donohue PK, et al. Multi-contrast human neonatal brain atlas: application to normal neonate development analysis [J]. NeuroImage, 2011, 56(1): 8-20.
[9] Paydar A, Fieremans E, Nwankwo JI, et al. Diffusional kurtosis imaging of the developing brain [J]. AJNR American journal of neuroradiology, 2014, 35(4): 808-14.
[10] Ouyang M, Dubois J, Yu Q, et al. Delineation of early brain development from fetuses to infants with diffusion MRI and beyond [J]. NeuroImage, 2019, 185(836-50.
Figures