3592
Quantitative assessment of neonatal hyperbilirubinemia brain injury based on T1 mapping
Xing li1, Xiaoli Meng2, Wei Zhang1, Huipeng Ren1, Yumiao Zhang1, Xiaohu Wang1, Qing Fan1, Xiaocheng Wei3, and Zhuanqin Ren1
1Radiology department, Baoji Central Hospital, baoji, China, 2Nuclear medicine department, Xijing Hospital of Air Force Military Medical University, Xi'an, China, 3GE Healthcare, MR Research China, Beijing, Beijing, China
1Radiology department, Baoji Central Hospital, baoji, China, 2Nuclear medicine department, Xijing Hospital of Air Force Military Medical University, Xi'an, China, 3GE Healthcare, MR Research China, Beijing, Beijing, China
Synopsis
In this study, we aim to investigate whether T1 mapping can be used to assess neonatal brain injury. It was concluded that the influence of bilirubin value on the globus pallidus (GP) and the posterior limb of internal capsule (PLIC) was obvious. Among them, the T1 values of GP, putamen (PU) and PLIC decreased with the increase of bilirubin.
Introduction
Neonatal hyperbilirubinemia (NHB) is a common clinical problem in the neonatal period, especially in the first week after birth1. Severe NHB (4.8%) can lead to bilirubin encephalopathy (BE), in which 50% to 70% of severe BE patients die in the acute phase, while 75% to 90% of survivors can have severe neurological sequelae such as cerebral palsy, audiovisual impairment, and intellectual impairment2. In previous studies on NHB, it was believed that the high signal of T1 in globus pallidus (GP) can be used as an objective indicator to evaluate NHB and BE3, but it is prone to change due to different imaging techniques, and it is more likely to present high signal in high field intensity and 3D sequence4. Therefore, it is still necessary to find a method that can correctly quantify the signal strength of GP. T1 mapping technology can directly measure the T1 value of tissues and reflect the water content of cells5. This study aims to use T1 mapping imaging to measure the T1 value of each brain area of neonates with NHB, quantify the degree of brain injury accurately, and observe the change trend of T1 value with serum Total Bilirubin (TBil), and provide objective imaging basis for clinical.Material and Methods
Our Institutional Review Board approved the protocol and written informed consent was obtained from guardians of each neonate. 40 neonates with hyperbilirubinemia (H group, average TBil 250.617±41.574μmol/L) and 26 neonates with encephalopathy (E group, average TBil 391.146±84.791μmol/L) were retrospectively analyzed, and 27 neonates with physiologic jaundice (C group, average TBil 150.089±70.917μmol/L) were selected as control group. All newborns were examined on a 3.0T MR scanner (MR750W; GE Healthcare, Milwaukee, USA) equipped with a 12-channel head coil. The scan sequences include routine axial(AX) T1-weighted imaging, T2-weighted imaging and T1 mapping. The T1 mapping parameters were as follows: TR=3500ms, TE=25.2ms, Bandwidth=62.5kHz, phase encoding FOV=1, frequency coding FOV=22, matrix=128x128, slice thickness/gap=4/0 mm, six different reversal times (TI), respectively 200ms, 400ms, 600ms, 800ms, 1000ms, 1200ms, and scanning time=7min6s. The raw data were imported into the post-processing software FuncTool to generate T1 maps. The six pairs of brain regions, namely bilateral GP, PU, caudate nucleus head (CA), dorsal thalamus (TH), anterior limb of internal capsule (ALIC) and PLIC, were measured. The ROI was manually set at the maximum level of each brain region. The mean value of T1 was obtained by measuring the same part three times, and the T1 value of each ROI was recorded. One-way analysis of variance was used to compare T1 values in each brain area among the three groups. If there were differences, LSD-T test was used for pairwise comparison. Correlation analysis between TBil and T1 value of each brain region was conducted by Pearson correlation.Results
The results of statistical analysis showed that T1 values in each brain area were arranged from large to small as C group, H group and E group (Table 1, Figure 1). T1 values of GP and PLIC were significantly different among all groups (F=5.979 and F=6.943, respectively, P < 0.05) (Table 1). T1 values of GP and PLIC were significantly different between C group and E group (P=0.002, P=0.008) and between H group and E group (P=0.023, P=0.028) (Table 2). Linear correlation analysis showed that T1 values of GP, PU and PLIC were negatively correlated with TBil (r values were -0.338, -0.414 and -0.352, respectively, P < 0.05) (Table 3).Discussion and Conclusion
In this study, T1 mapping can reflect the changes of T1 values in various brain regions of neonates with hyperbilirubinemia, suggesting the damage of different brain regions by bilirubin and the possibility of corresponding neurological function changes. T1 values of GP, PU and PLIC were negatively correlated with bilirubin values, suggesting that these brain regions were significantly affected by bilirubin. GP is related to muscle tension and postural reflex of limbs. PU participates in the regulation of learning and movement. Internal capsule (IC) is an important structure in the cerebral hemisphere. It contains a large number of fasciculus, in which the corticospinal tract, optic radiation and auditory radiation pass through the PLIC6. Our findings suggest that bilirubin may have shortened the longitudinal relaxation time of GP, PU and PLIC, and potentially weakened the function of corresponding brain regions, which was consistent with the neurological dysfunction induced by bilirubin. But it's not clear why bilirubin lowers T1 in these brain regions. Bin-nun et al.7 believed that bilirubin could damage nerve cell membranes and cause calcium to deposit in damaged neurons, thus shortening T1 relaxation time. But Hansen T et al.8 recognized that when neurons and glial cells were damaged by bilirubin, nerve fibers could be dys-myelinated to a certain extent or the phospholipin of myelin was destroyed or lost, which reduced the macromolecules in these brain regions, thus decreasing the T1 value. The major limitations of our study were the relatively small number of cases and the lack of comparison with other neonatal encephalopathy to highlight its specificity. Thus, multi-center and large sample size research is still needed. To conclude, T1 mapping could be used to evaluate brain injury in neonates with NHB quantificationally.Acknowledgements
We acknowledge Dr. Xiaocheng Wei from MR Research, GE Healthcare for technical support on T1 mapping sequence as well as helpful discussions.References
1.Ullah S, Rahman K, Hedayati M. Hyperbilirubinemia in Neonates: Types, Causes, Clinical Examinations, Preventive Measures and Treatments: A Narrative Review Article[J]. Iran J Public Health, 2016,45(5):558-568.
2.Olusanya B O, Kaplan M, Hansen T. Neonatal hyperbilirubinaemia: a global perspective[J]. Lancet Child Adolesc Health, 2018,2(8):610-620.
3.Zhang L, Gao J, Zhao Y, et al. The application of magnetic resonance imaging and diffusion-weighted imaging in the diagnosis of hypoxic-ischemic encephalopathy and kernicterus in premature infants[J]. Transl Pediatr, 2021,10(4):958-966.
4.Wisnowski J L, Panigrahy A, Painter M J, et al. Magnetic resonance imaging of bilirubin encephalopathy: current limitations and future promise[J]. Semin Perinatol, 2014,38(7):422-428.
5.Lauzon M L, McCreary C R, Frayne R. MultisliceT1-prepared 2D single-shot EPI: analysis of a clinicalT1mapping method unbiased byB0orB1inhomogeneity: Analysis ofT1-prepared EPI[J]. NMR in biomedicine, 2016,29(8):1056-1069.
6.Yan R, Han D, Ren J, et al. Diagnostic value of conventional MRI combined with DTI for neonatal hyperbilirubinemia[J]. Pediatr Neonatol, 2018,59(2):161-167.
7.Bin-Nun A, Mimouni F B, Kasirer Y, et al. Might Bilirubin Serve as a Natural Antioxidant in Response to Neonatal Encephalopathy?[J]. Am J Perinatol, 2018,35(11):1107-1112.
8.Hansen T, Wong R J, Stevenson D K. Molecular Physiology and Pathophysiology of Bilirubin Handling by the Blood, Liver, Intestine, and Brain in the Newborn[J]. Physiol Rev, 2020,100(3):1291-1346.
Figures
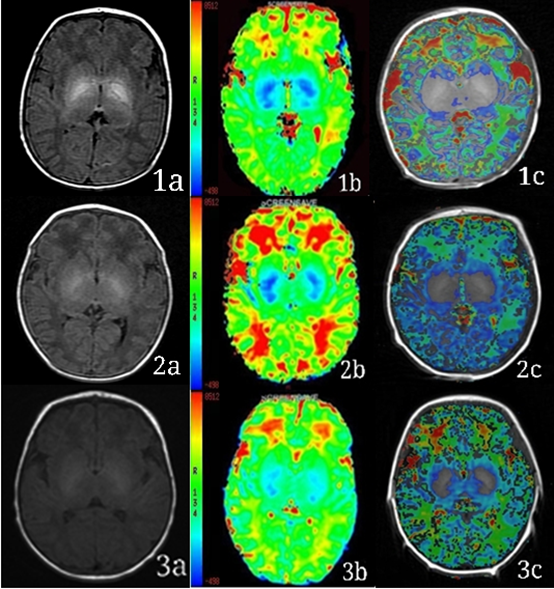
Figure 1: Representative images. Example 1, 2 and 3 are typical MRI images of neonates in the E group, H group and C group, respectively. Column a, b and c are the T1WI, T1 maps and the fusion image of T1 map and T1WI, respectively. The color bar of column b shows that the bluer the color, the lower the T1 value, and the redder the color, the higher the T1 value.
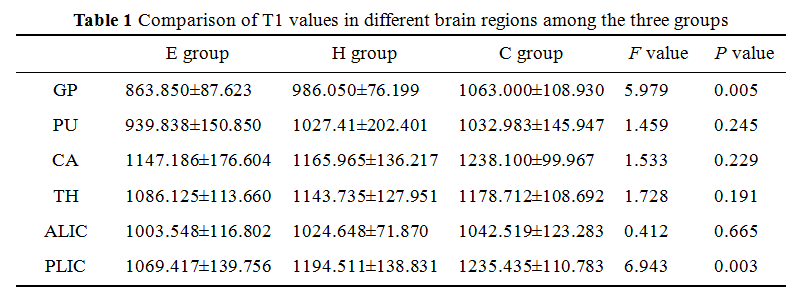
Table 1: Comparison of T1 values in different brain regions among the three groups. Data are mean ± standard deviation. P values less than .05* were considered to indicate statistical significance. E group= encephalopathy group , H group= hyperbilirubinemia group, C group= control group. globus pallidus (GP), putamen nucleus (PU), caudate nucleus head (CA), dorsal thalamus(TH), anterior limb of internal capsule (ALIC) and posterior limb of internal capsule (PLIC).
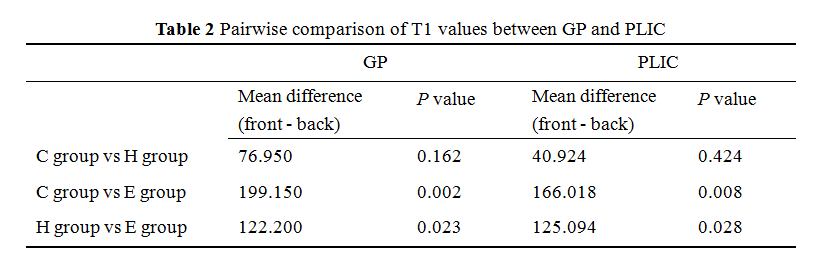
Table 2: Pairwise comparison of T1 values between GP and PLIC. P values less than .05* were considered to indicate statistical significance. globus pallidus (GP), posterior limb of internal capsule (PLIC).
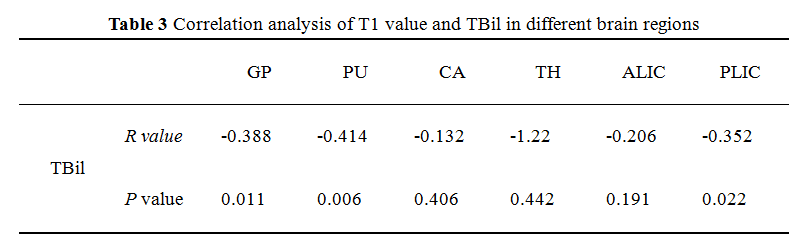
Table 3: Correlation
analysis of T1 value and TBil in different brain regions.
DOI: https://doi.org/10.58530/2022/3592