3589
Non-invasive MRI measures of glymphatic system activity associated with CSF-Aβ and FDG-PET uptakes in Alzheimer’s disease1Department of Radiology, Juntendo University, Tokyo, Japan, 2Department of Radiology, Nagoya University, Aichi, Japan, 3Department of Radiology, Toho University, Tokyo, Japan
Synopsis
We assessed the non-invasive MRI measurements, such as the diffusivity along the perivascular space (PVS) represented by ALPS index, PVS volume, and fractional volume of free water in the white matter (FW-WM), in cognitively normal subjects and subjects with Alzheimer’s disease (AD) or mild cognitive impairment (MCI). Abnormalities were detected in the subjects with AD and MCI, and theirALPS index and FW-WM values were significantly associated with CSF Aβ levels and FDG PET uptake, as well as with multiple cognitive scores, thus suggesting that a glymphatic system dysfunction could be associated with Aβ deposition and cognitive impairments.
Introduction
The glymphatic system (GS) is described as a perivascular brain network that facilitates CSF and interstitial fluid exchange.1 Rodent studies have suggested a contribution of an impaired GS to the accumulation of amyloid-beta (Aβ) and the hyperphosphorylated tau (pTau), which are identified as pathological hallmarks of Alzheimer’s disease (AD).2, 3 However, the involvement of GS in the pathogenesis of AD in humans is yet to be fully understood. MRI measurements, such as the diffusivity along the perivascular space (PVS) represented by the ALPS index,4 the PVS volume,5 and the fractional volume of free water (FW) in the brain parenchyma,6 were recently revealed as promising candidates for the evaluation of the GS function.In this study, we investigated the differences in these measurements between subjects with normal cognition (CN), AD, and mild cognitive impairment (MCI). Additionally, we explored the relationship between these MRI measurements and the levels of CSF biomarkers or FDG and AV45 PET or cognitive scores.
Methods
Subjects and MRI Data AcquisitionWe included baseline data (Figure 1) of 111 subjects (31 CN, 44 MCI, and 36 AD) from the Alzheimer’s Disease Neuroimaging Initiative (http://adni.loni.ucla.edu/) database. Diffusion-weighted (DWI; b = 1,000 s/mm2, 5 b0, 41 gradient directions), T1-weighted (T1w), and fluid attenuation inversion recovery (FLAIR) images were evaluated.
DWI processing
The DTIFIT tool was used to generate fractional anisotropy (FA) maps.7 Diffusivity maps were obtained in the direction of the x-axis (right-left; Dxx), y-axis (anterior-posterior; Dyy), and z-axis (inferior-superior; Dzz) by using FSL. Furthermore, FW maps were constructed using a Diffusion Imaging in Python algorithm.6 The mean FW value was measured in cerebral white matter (FW-WM) after excluding for WM lesions (WMLs) and PVS.
PVS volume fraction
PVS mapping was performed by applying a Frangi filter to T1w using the Quantitative Imaging Toolkit.8,9 WMLs were excluded from the PVS map. The PVS volumes were calculated in the WM, basal ganglia (BG), and hippocampus (Hipp) segmented using T1w with the FreeSurfer (Figure 2). PVS volume was then normalized (PVS volume fraction [PVSVF] = PVS/brain parenchymal volumes).
ALPS index calculation
All FA maps were aligned into the FMRIB58_FA standard space. One subject with the smallest degree of warping was selected for the region of interest (ROI) placement. By using this subject’s native color-coded FA map, 5-mm-diameter square ROIs were placed in the bilateral projection and association areas at the level of the lateral ventricle bodies (Figure 3). The ALPS index (Figure 3) was calculated as a ratio of the mean of the x-axis diffusivity in the projection area (Dxxproj) and the x-axis diffusivity in the association area (Dxxassoc) to the mean of the y-axis diffusivity in the projection area (Dyyproj) and the z-axis diffusivity in the association area (Dzzassoc). The mean ALPS (mALPS) index of the left and the right hemispheres was then calculated.
Statistical analysis
Between-group differences in mALPS-index, the PVSVF, and the FW-WM were assessed with Kruskal–Wallis tests, followed by post-hoc Dunn-Bonferroni tests. Partial Spearman’s rank correlation tests were used to evaluate the association between MRI measurements and clinical scores adjusting for age, sex, education years, scanning site, and APOEA in MCI and AD groups combined. The false discovery rate was used in order to correct for multiple comparisons.
Results
Between-group differences (Figure 4)AD had significantly lower mALPS-index than CN and MCI and higher FWI than CN. AD also showed significantly higher PVSVF-WM, PVSVF-BG, PVSVF-Hipp, and PVSVF-ALL (sum of WM, BG, and Hipp) than CN and higher PVSVF-BG than MCI. Finally, MCI demonstrated significantly higher PVSVF-WM and PVSVF-ALL than CN.
Correlation analysis (Figure 5)
Positive correlations were observed between the mALPS-index and the CSF Aβ levels or the FDG PET SUVr or Mini-Mental State Examination (MMSE) score, as well as between the PVSVF-BG or FW-WM and Functional Activities Questionnaire (FAQ). Negative correlations were also recorded between the mALPS-index and FAQ or CDR-SB or ADAS11 or ADAS13 and between the FW-WM and the CSF Aβ levels or MMSE.
Discussion
Lower mALPS index and higher PVSVF and FW-WM in AD might reflect a glymphatic stasis secondary to the perivascular accumulation of brain debris. Taoka et al.4 have previously reported a significant association between the MMSE score and the ALPS index in AD and MCI; however, this is the first study reporting a significant difference in the mALPS-index between AD, MCI, and CN. The significantly higher PVSVF and FW-WM in AD are consistent with the results of previous studies.10-13 However, the changes of PVSVF in AD have been inconsistent between studies.14-16 In contrast to our study, the PVS dilatation has been previously evaluated by using a visual rating scale, and not all PVS in the brain could be mapped. The significant correlation between the mALPS-index or FW-WM and the CSF Aβ levels suggests that a GS dysfunction could be the cause of Aβ deposition, as demonstrated in previous animal model2 and postmortem studies.17 Furthermore, considering the association between the mALPS-index and neurodegeneration as suggested by the decreased FDG PET uptake and the multiple cognitive function scores, our findings support the hypothesis that the GS function could play a crucial role in the pathology of AD.Acknowledgements
This study was partially supported by the Private University Research Branding Project (Ministry of Education, Culture, Sports, Science and Technology, Japan) and JSPS KAKENHI (grant JP19K17244, JP18H02772)References
- Jessen NA, Munk AS, Lundgaard I, Nedergaard M. The Glymphatic System: A Beginner's Guide. Neurochem Res 2015;40:2583-2599.
- Iliff JJ, Wang M, Liao Y, et al. A paravascular pathway facilitates CSF flow through the brain parenchyma and the clearance of interstitial solutes, including amyloid beta. Sci Transl Med 2012;4:147ra111.
- Tarasoff-Conway JM, Carare RO, Osorio RS, et al. Clearance systems in the brain-implications for Alzheimer disease. Nature reviews Neurology 2015;11:457-470.
- Taoka T, Masutani Y, Kawai H, et al. Evaluation of glymphatic system activity with the diffusion MR technique: diffusion tensor image analysis along the perivascular space (DTI-ALPS) in Alzheimer's disease cases. Japanese journal of radiology 2017;35:172-178.
- Donahue EK, Murdos A, Jakowec MW, et al. Global and Regional Changes in Perivascular Space in Idiopathic and Familial Parkinson's Disease. Movement disorders : official journal of the Movement Disorder Society 2021;36:1126-1136.
- Pasternak O, Sochen N, Gur Y, Intrator N, Assaf Y. Free water elimination and mapping from diffusion MRI. Magnetic resonance in medicine 2009;62:717-730.
- Basser PJ, Pajevic S, Pierpaoli C, Duda J, Aldroubi A. In vivo fiber tractography using DT-MRI data. Magnetic resonance in medicine : official journal of the Society of Magnetic Resonance in Medicine / Society of Magnetic Resonance in Medicine 2000;44:625-632.
- Sepehrband F, Barisano G, Sheikh-Bahaei N, et al. Image processing approaches to enhance perivascular space visibility and quantification using MRI. Scientific reports 2019;9:12351.
- Frangi AF, Niessen WJ, Vincken KL, Viergever MA. Multiscale vessel enhancement filtering. Lect Notes Comput Sc 1998;1496:130-137.
- Bergamino M, Walsh RR, Stokes AM. Free-water diffusion tensor imaging improves the accuracy and sensitivity of white matter analysis in Alzheimer's disease. Scientific reports 2021;11:6990.
- Dumont M, Roy M, Jodoin PM, et al. Free Water in White Matter Differentiates MCI and AD From Control Subjects. Front Aging Neurosci 2019;11:270.
- Patankar TF, Mitra D, Varma A, Snowden J, Neary D, Jackson A. Dilatation of the Virchow-Robin space is a sensitive indicator of cerebral microvascular disease: study in elderly patients with dementia. AJNR American journal of neuroradiology 2005;26:1512-1520.
- Zhu YC, Tzourio C, Soumare A, Mazoyer B, Dufouil C, Chabriat H. Severity of dilated Virchow-Robin spaces is associated with age, blood pressure, and MRI markers of small vessel disease: a population-based study. Stroke 2010;41:2483-2490.
- Banerjee G, Kim HJ, Fox Z, et al. MRI-visible perivascular space location is associated with Alzheimer's disease independently of amyloid burden. Brain : a journal of neurology 2017;140:1107-1116.
- Chen W, Song X, Zhang Y, Alzheimer's Disease Neuroimaging I. Assessment of the Virchow-Robin Spaces in Alzheimer disease, mild cognitive impairment, and normal aging, using high-field MR imaging. AJNR American journal of neuroradiology 2011;32:1490-1495.
- Hansen TP, Cain J, Thomas O, Jackson A. Dilated perivascular spaces in the Basal Ganglia are a biomarker of small-vessel disease in a very elderly population with dementia. AJNR American journal of neuroradiology 2015;36:893-898.
- Zeppenfeld DM, Simon M, Haswell JD, et al. Association of Perivascular Localization of Aquaporin-4 With Cognition and Alzheimer Disease in Aging Brains. JAMA Neurol 2017;74:91-99.
Figures
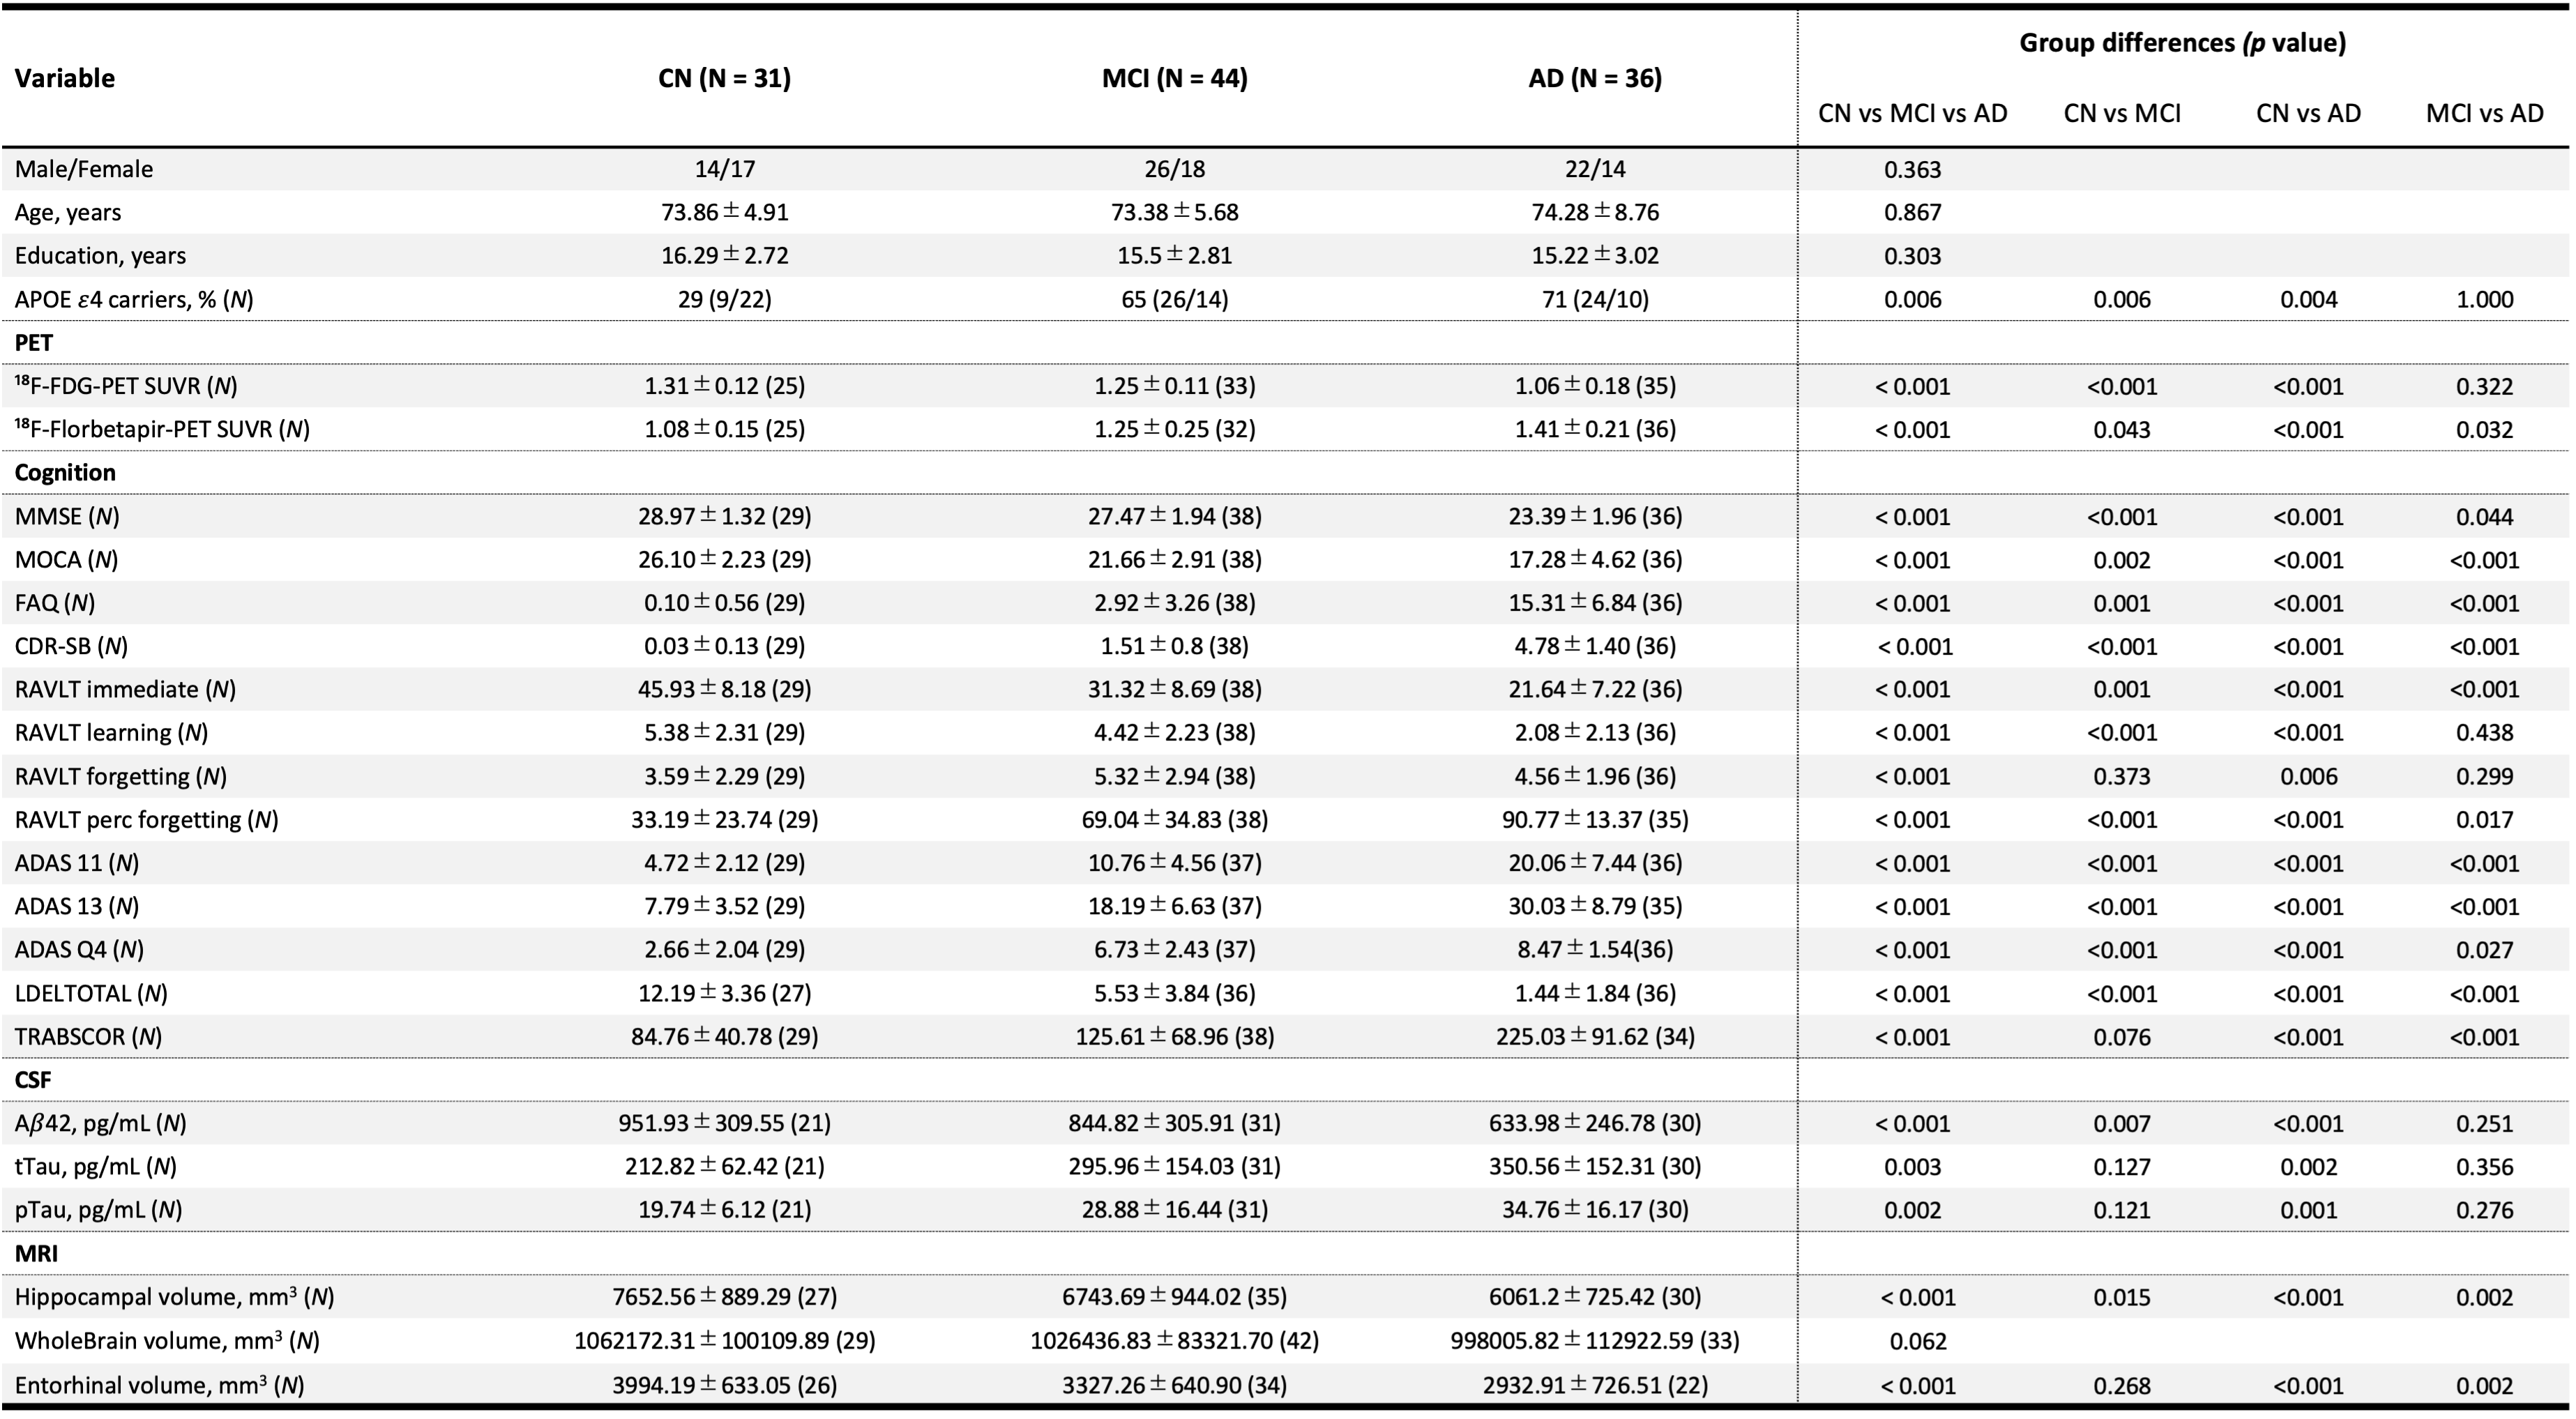
Figure 1. Demographic characteristics of subjects
Statistical analyses were performed using χ2 tests and Kruskal-Wallis tests (post-hoc: Dunn-Bonferroni tests). Abbreviations: CN, control; MCI, mild cognitive impairment; AD, Alzheimer’s disease; APOE, apolipoprotein E; MMSE, Mini-Mental State Examination; MoCA, Montreal Cognitive Assessment; FAQ, Functional Activities Questionnaire; CDR-SB, Clinical Dementia Rating Sum of Boxes; RAVLT, Rey Auditory Verbal Learning Test; ADAS, Alzheimer’s Disease Assessment Scale; LDELTOTAL, Logical Memory Delayed Total Recall.
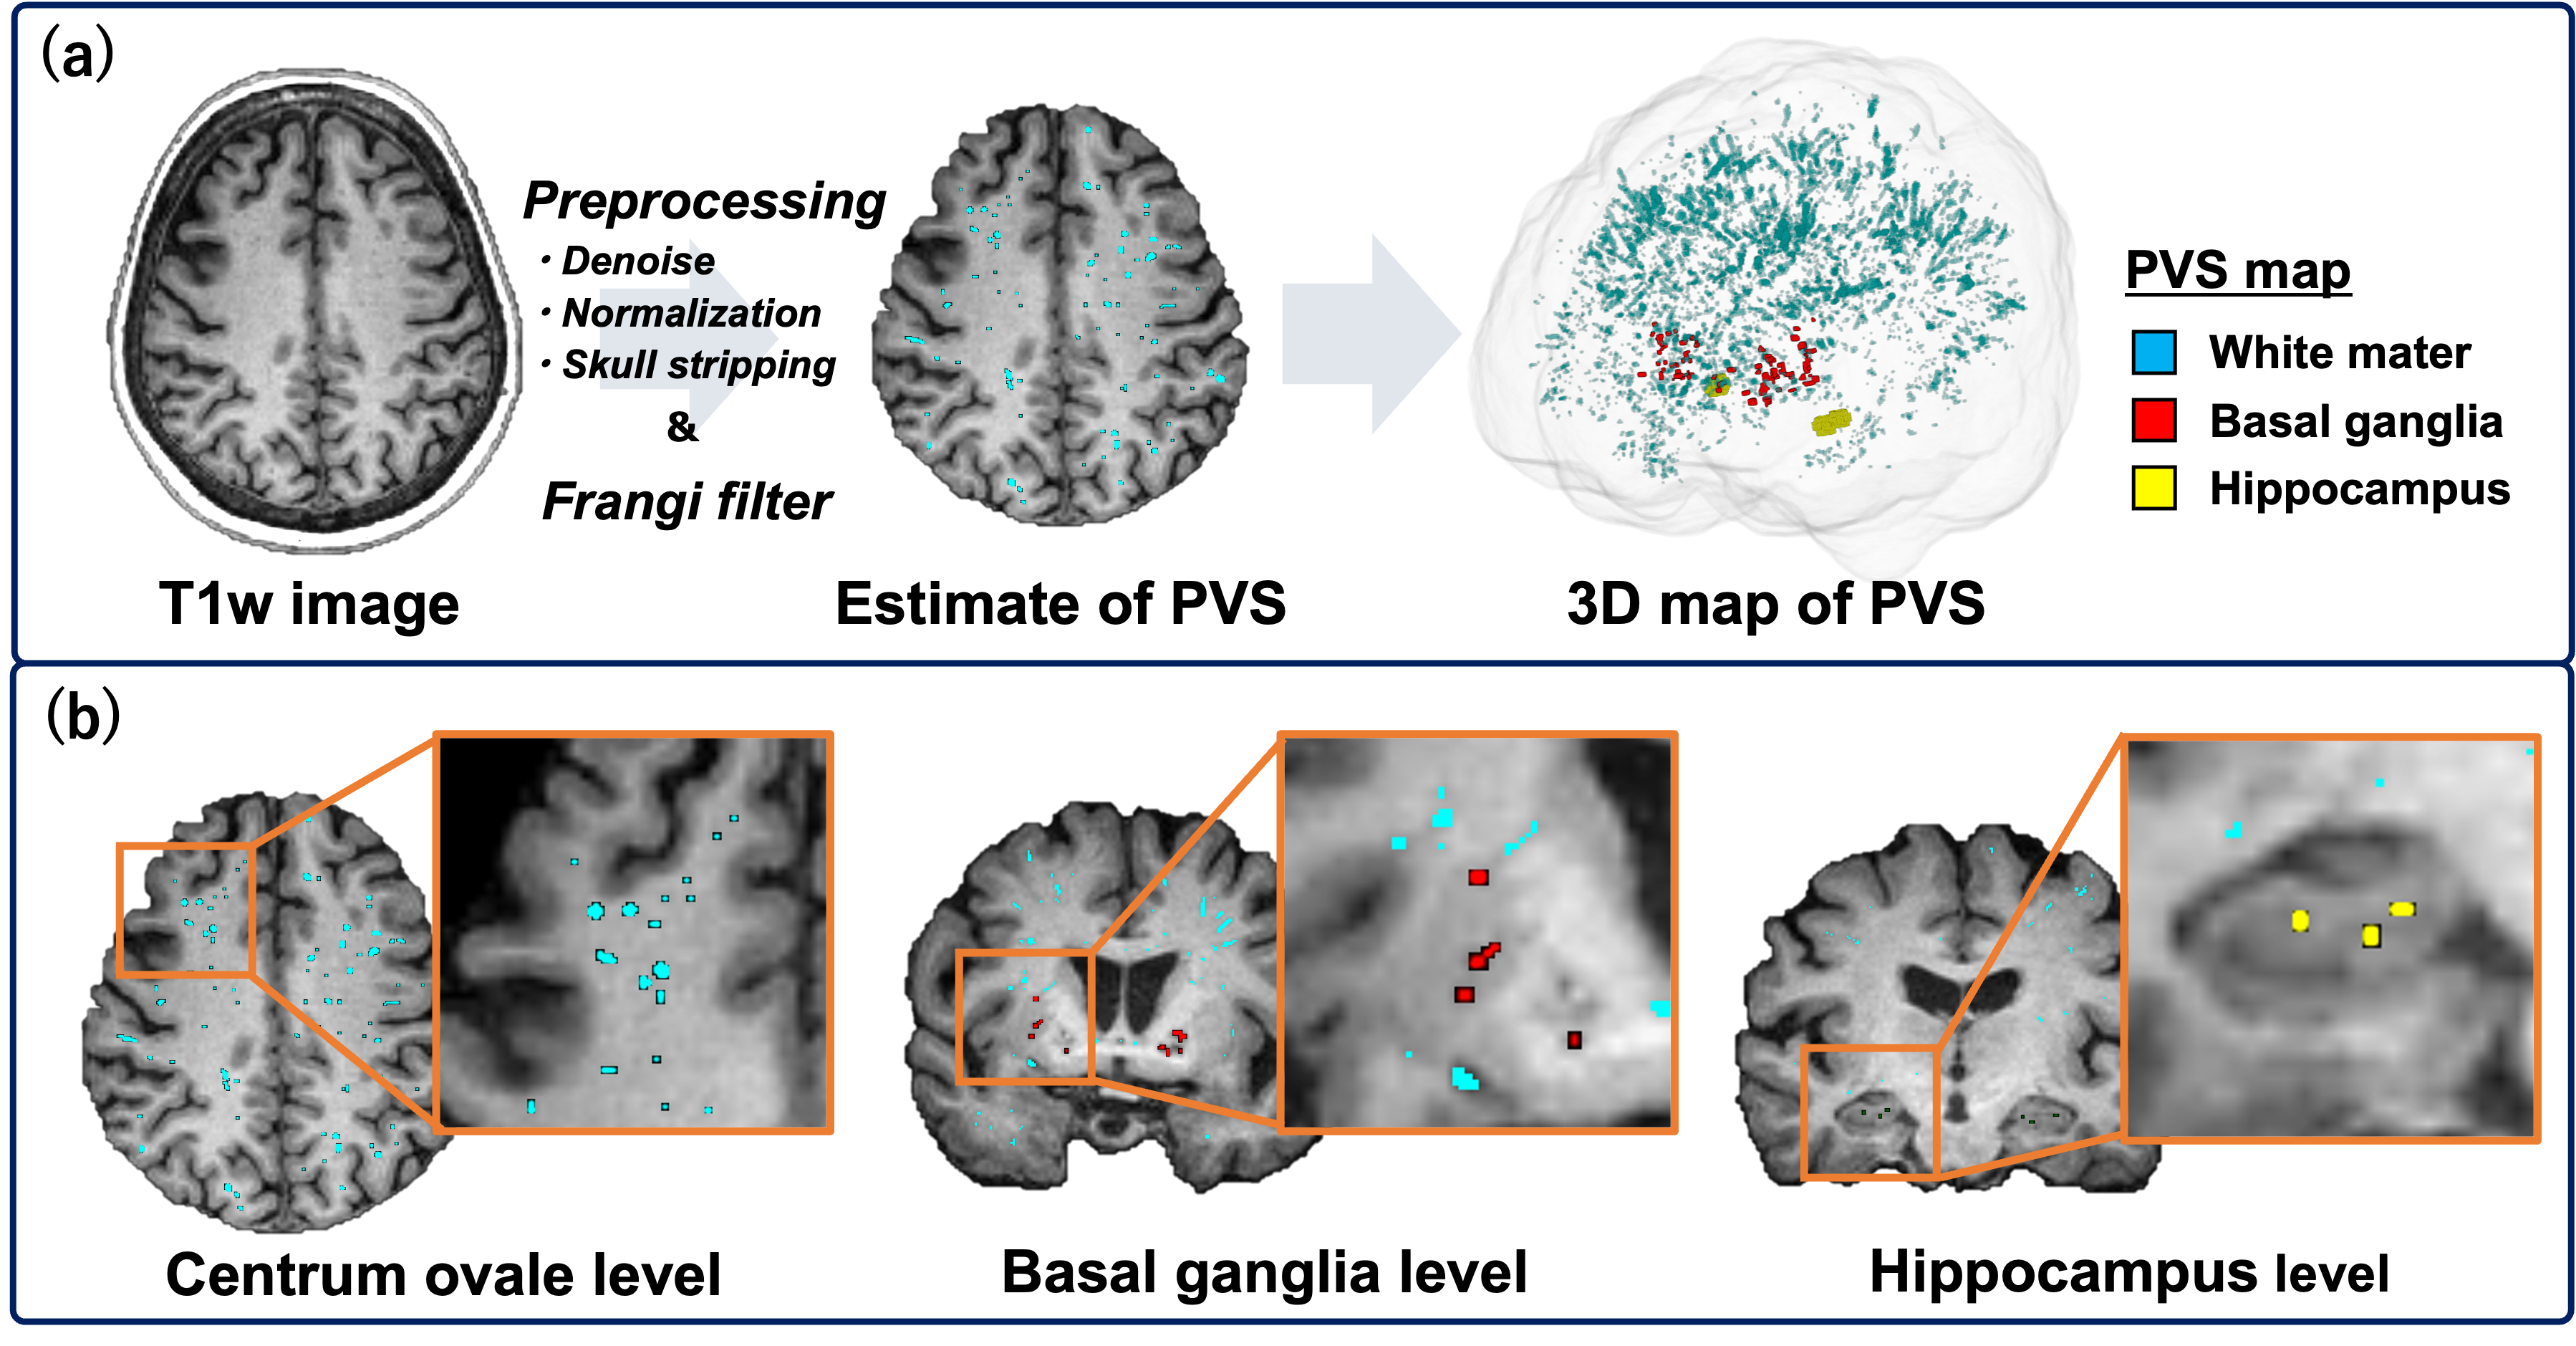
Figure 2. Overview of the perivascular space (PVS) mapping.
(a) The PVS mapping was performed using the developed technique by Sepehrband et al.8 Firstly, T1w images were preprocessed, and a Frangi filter was applied. (b) We measured the PVS volume of each white matter (WM), basal ganglia, and hippocampus as well as the sum of these structures. WM lesions were automatically extracted by the Lesion segmentation tool based on FLAIR and were subsequently excluded from the PVS map. Finally, the PVS volume fraction was calculated by dividing by each brain parenchymal volume.
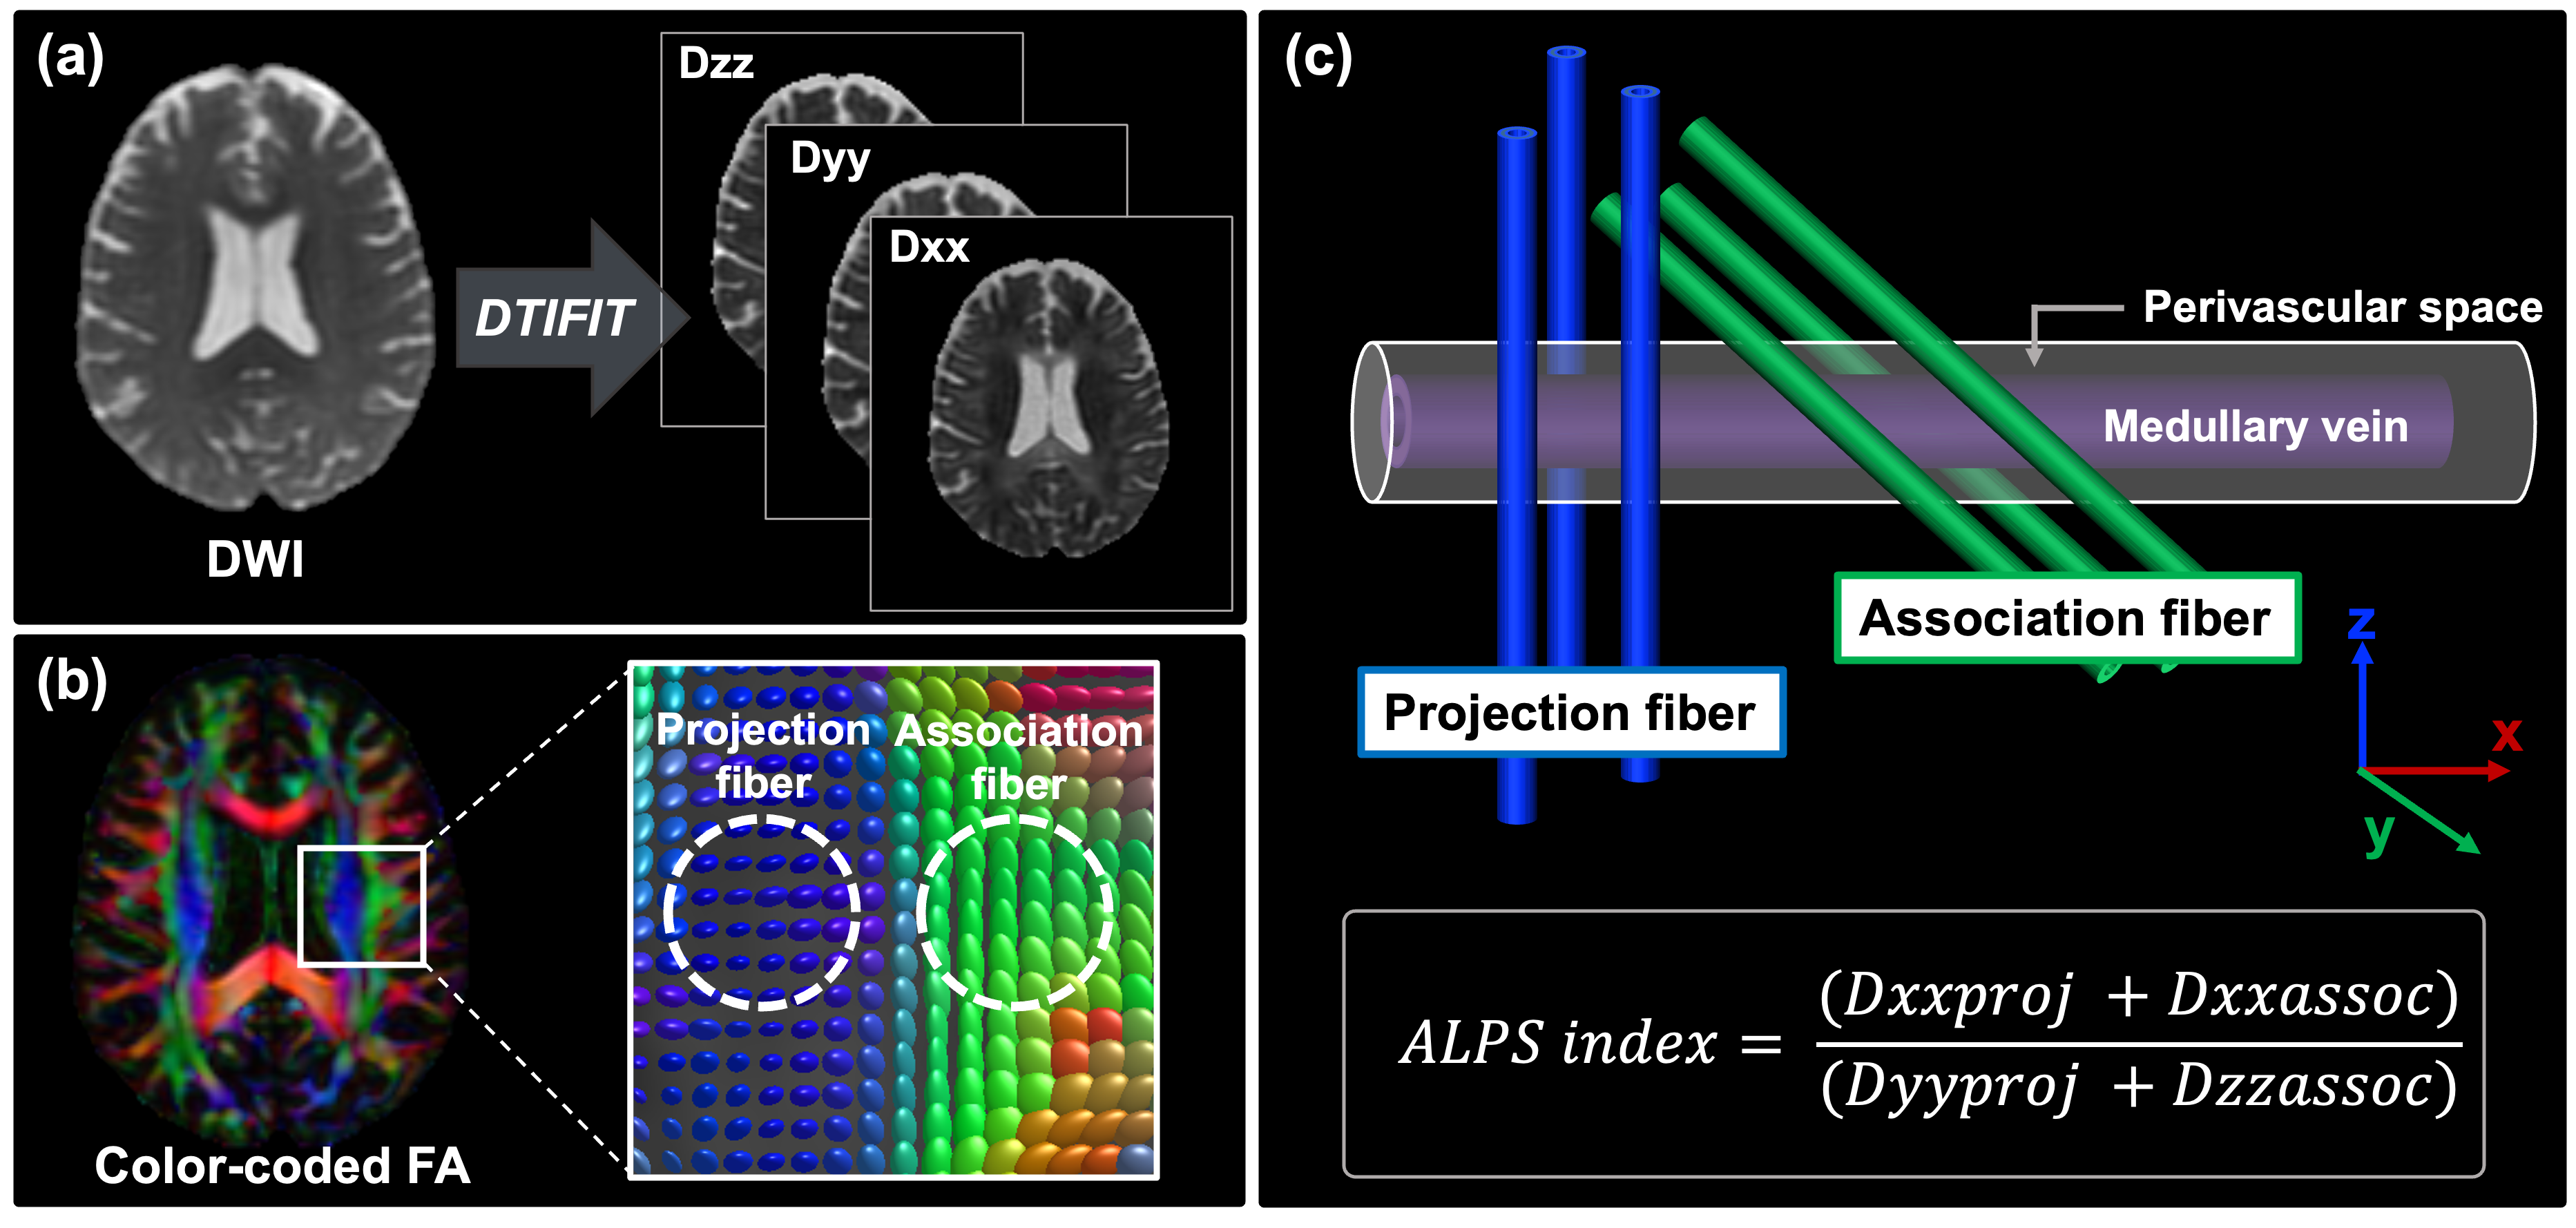
Figure 3. The diffusion tensor image analysis along with the perivascular space (DTI-ALPS).
(a) The DTIFIT tool was used to generate a color-coded FA map. Diffusivity maps were also obtained in the direction of the x-axis (Dxx), y-axis (Dyy), and z-axis (Dzz). (b) Color-coded FA and diffusion tensors show the distribution of the projection (z-axis, blue) and association (y-axis, green) fibers at the level of the lateral ventricle of the body. (c) The ALPS index is a measure of the ratio of the diffusion parallel and orthogonal to the perivascular space.
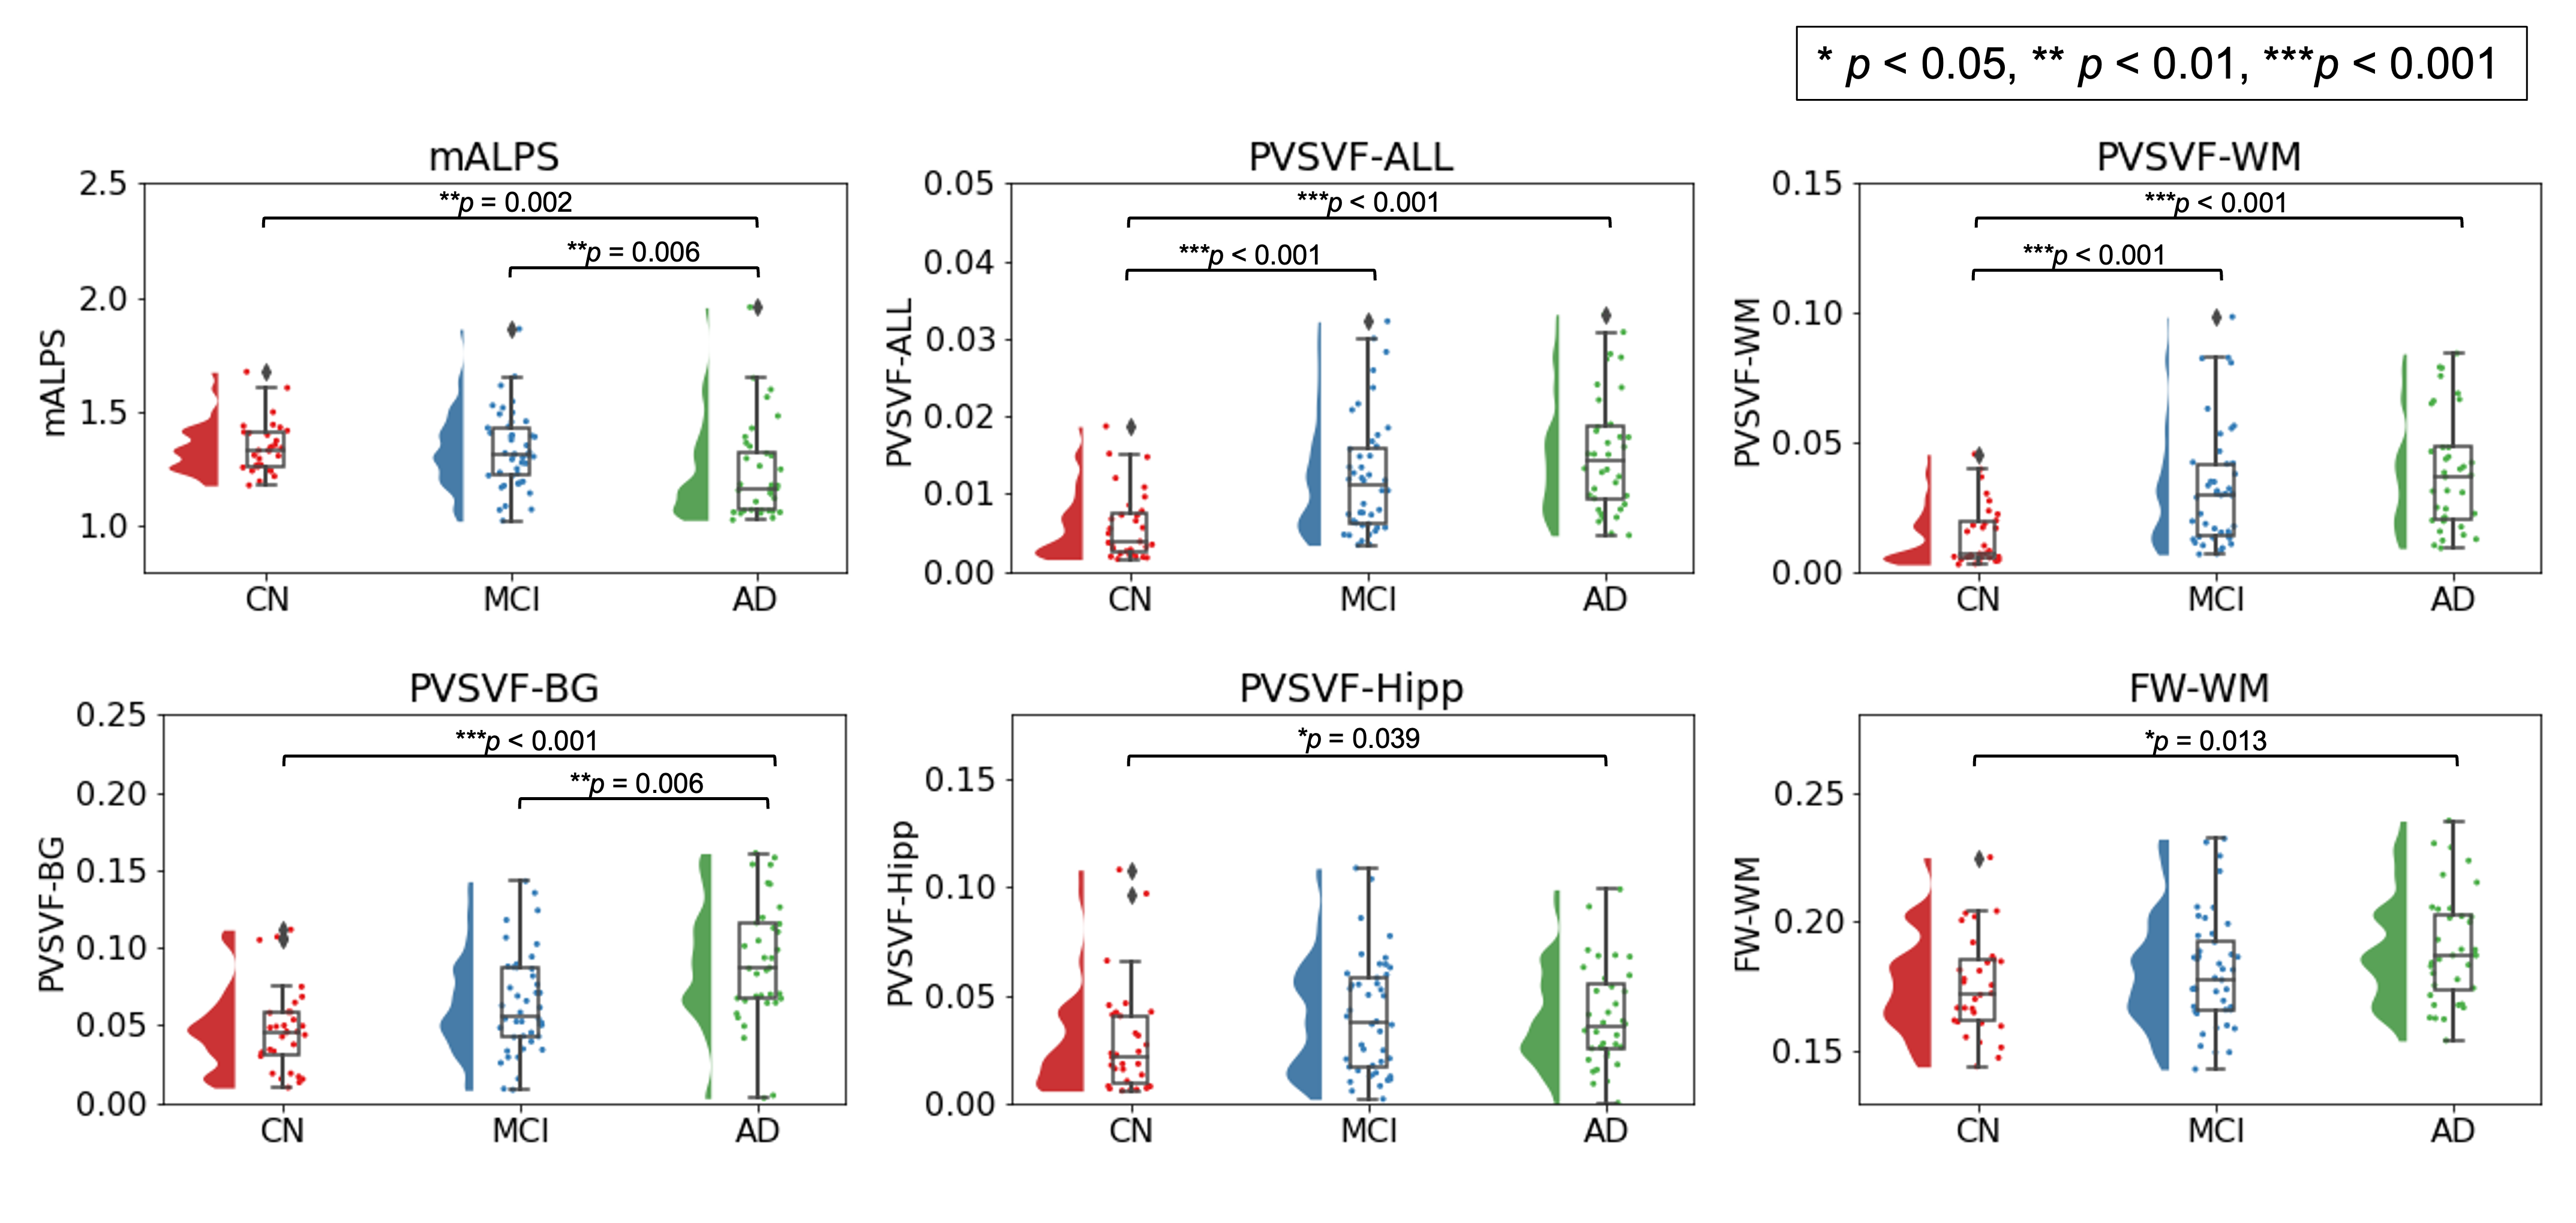
Figure 4. Comparison of mALPS-index, PVSVF, and FW-WM between Alzheimer’s disease (AD) patients, mild cognitive impairment (MCI) subjects, and control (CN) subjects.
AD had significantly lower mALPS-index than CN or MCI and higher FW-WM than CN. AD also demonstrated significantly higher PVSVF-WM, PVSVF BG, PVSVF-Hipp, and PVSVF-ALL than CN and higher PVSVF-BG than MCI. MCI had significantly higher PVSVF-WM, PVSVF-ALL than CN. Abbreviations: mALPS, mean ALPS; PVSVF, perivascular space volume fraction; WM, white matter; BG, basal ganglia; Hipp, hippocampus; FW, free water.
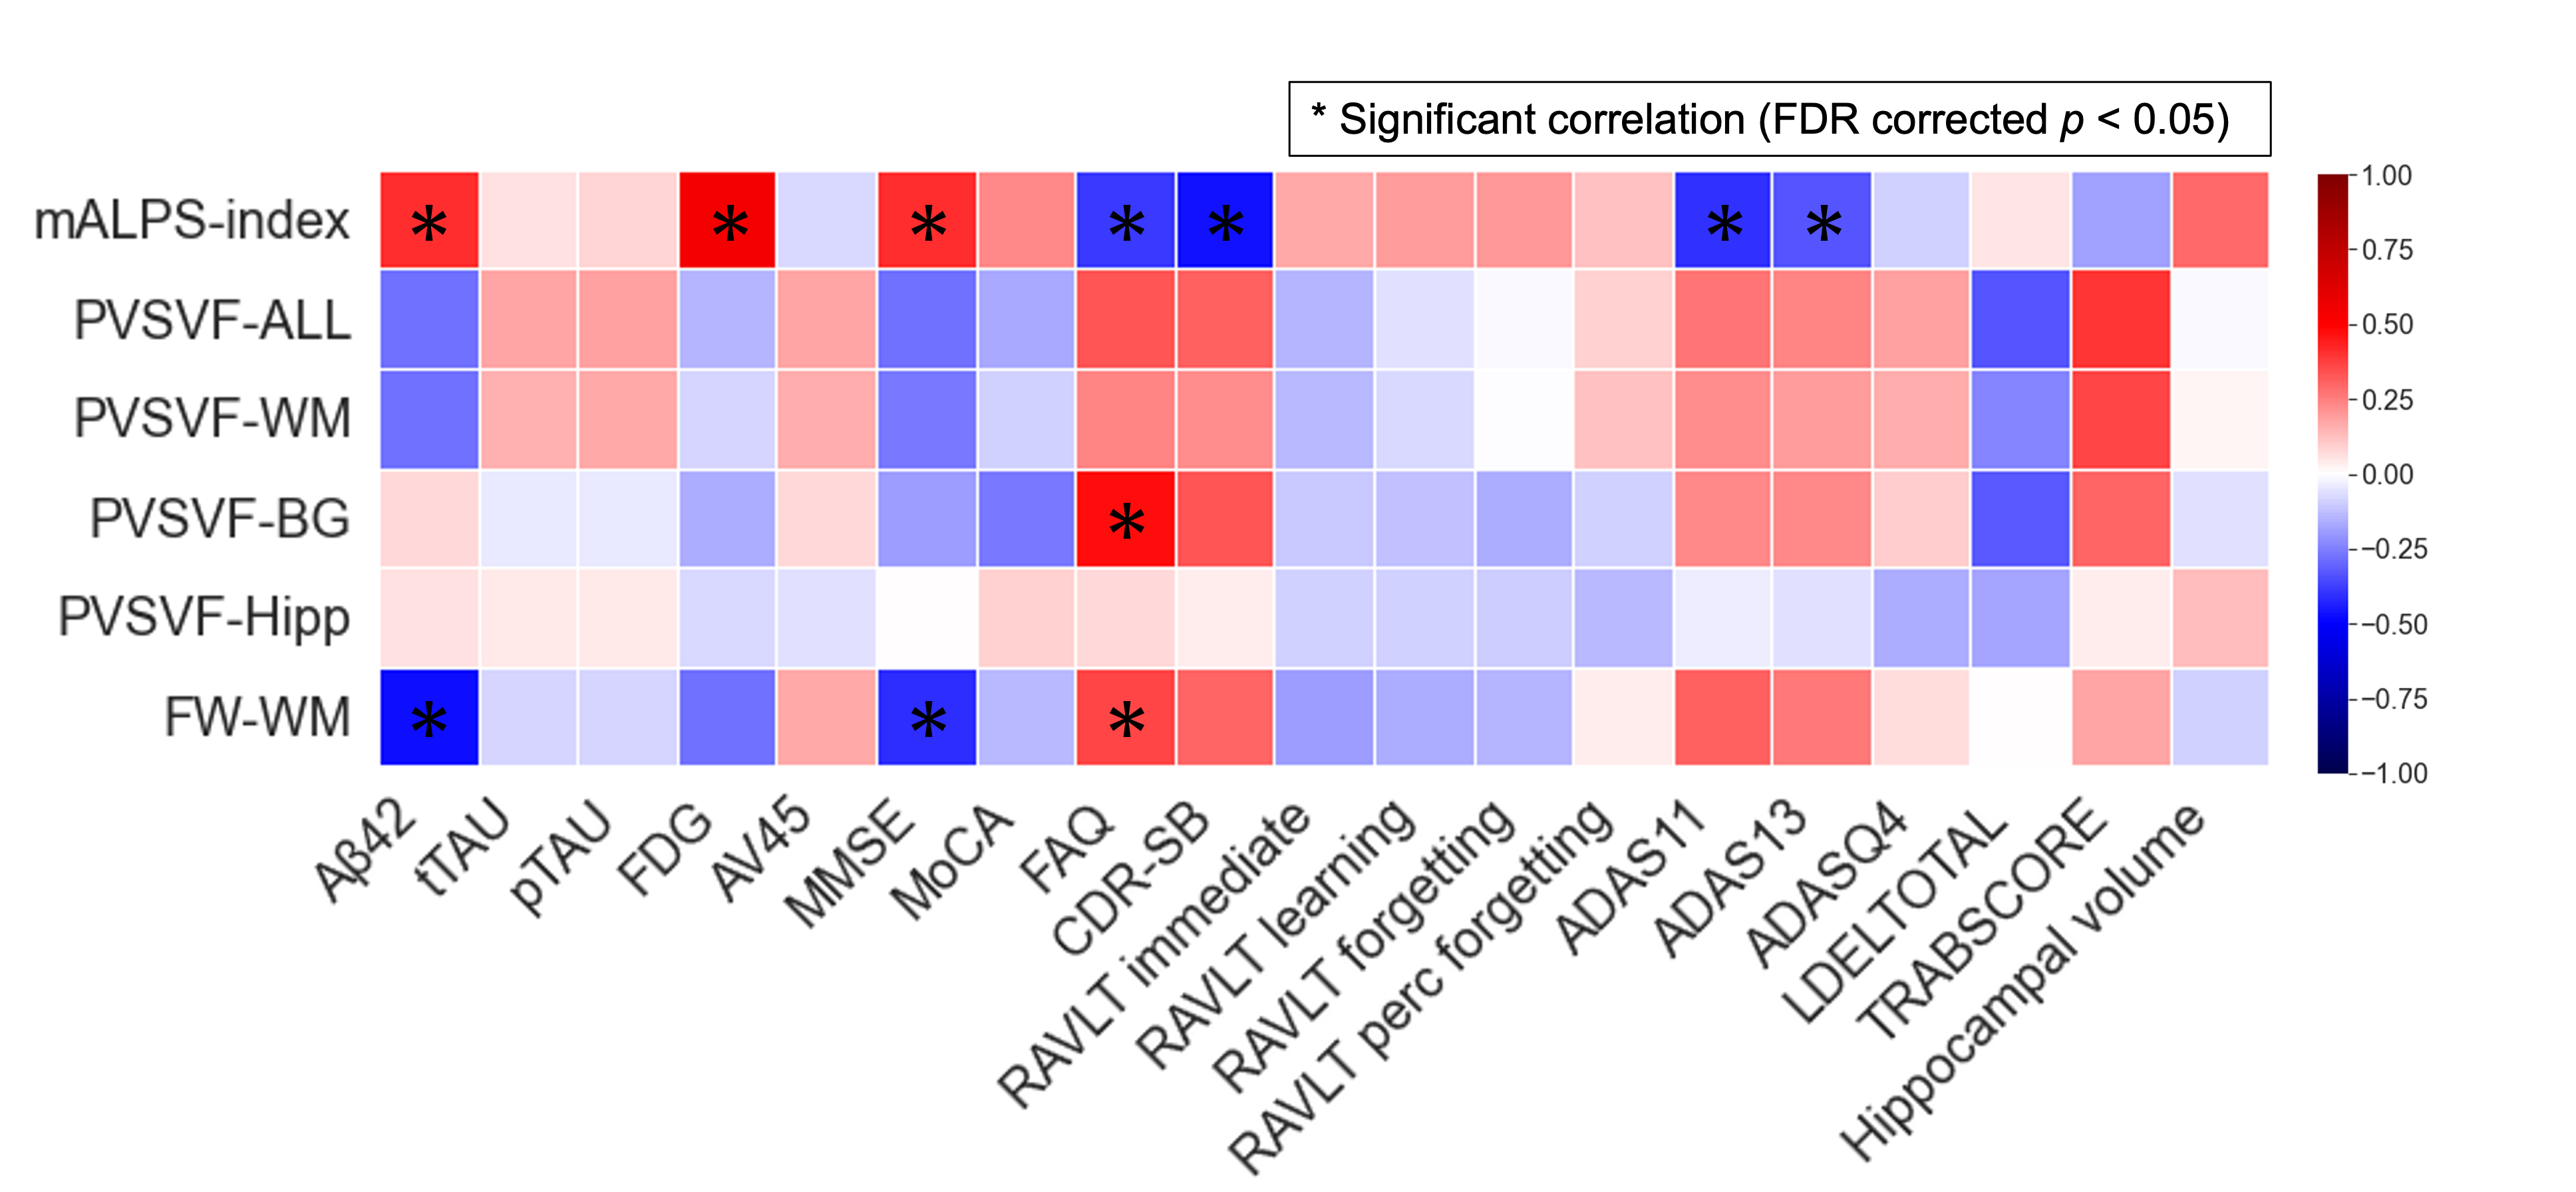
Figure 5. Heatmap of partial correlations between MRI measurements and other biomarkers and cognitive scores in the MCI and AD groups combined.
Partial Spearman’s correlation coefficient (rs) is depicted by color magnitude (red, positive; blue, negative) and adjusted for age, gender, education year, scanning site, and APOE4 levels. Asterisk (*) represents the significant correlations (false discovery rate corrected p < 0.05).