3587
Differences in brain metabolites in awake and anesthetized mice revealed by 1H-MRS1Institute of Science and Technology for Brain-Inspired Intelligence, Fudan University, Shanghai, China, 2Institute of Neuroscience, CAS Center for Excellence in Brain Sciences and Intelligence Technology, Key Laboratory of Primate Neurobiology, Chinese Academy of Sciences, Shanghai, China
Synopsis
It is important to investigate neural metabolism and brain functions in awake animals for preclinical studies. However, there are few magnetic resonance spectroscopy (MRS) studies in rodents under awake conditions. In this work, we developed an MRI-compatible restraint device for the measurement of brain metabolism in awake mice. Using 1H-MRS, we successfully observed the brain metabolic profile of prefrontal cortex and thalamus in awake mice. In addition, we found metabolic alterations between awake and anesthetized states, indicating that anesthesia has a non-negligible impact on brain metabolism.
Introduction
It is important to understand brain metabolic changes occurred during brain development, aging, and in a pathological state [1,2]. MRS can be used to evaluate the changes of brain metabolism in both clinical and preclinical studies. For animal studies, it has been a routine imaging setup to scan them with anesthesia or sedation. However, anesthesia may significantly change brain metabolism and thus result in altered imaging results [3,4]. Therefore, it is necessary to detect brain metabolism in awake animals. In this work, we aim to measure the brain metabolism of awake mice and find the difference between awake and anesthetized states.Materials and Methods
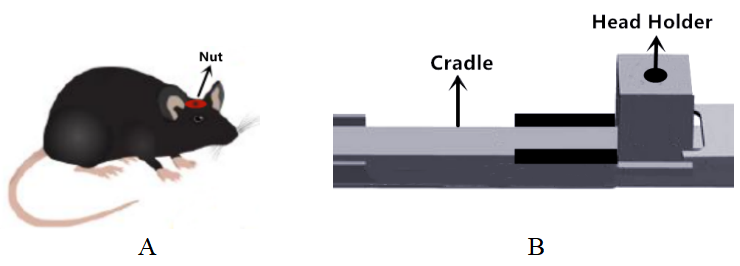
Animal preparation.Male adult C57BL/6 mice were used in the current study. All experimental protocols were approved by the Animal Ethics Committee of Fudan University. 18 mice were randomly divided into two groups: awake and anesthetized group. For the anesthetized group, isoflurane was used as anesthetics. For the awake group, we developed an MRI/MRS compatible restraint device to hold the skull of the mouse tightly on the holder (Figure 1). The surgery was performed two weeks before the MRI/MRS measurements. After one-week of recovery, mice were habituated to the mouse restraint device for seven days. Then MRI experiments were performed.
MRI and MRS Measurements.
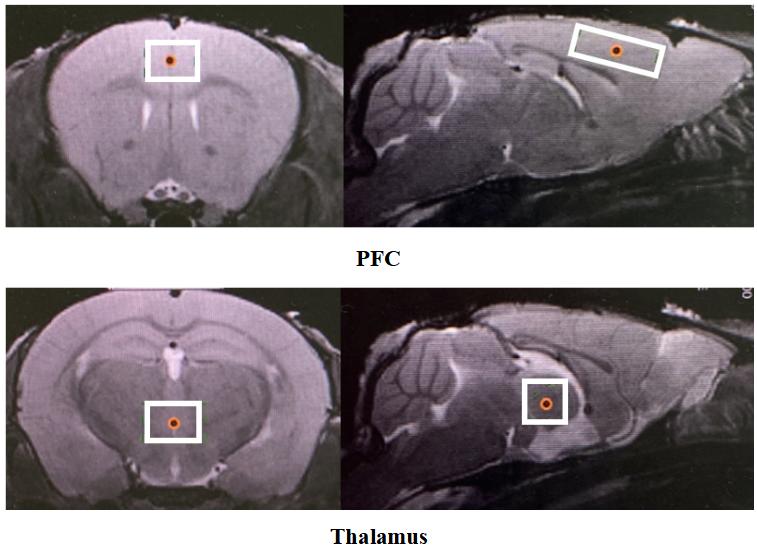
All MRI data were acquired with a Bruker BioSpec 11.7T scanner equipped with a CryoProbe (Ettlingen, Germany). Axial and sagittal multi-slice TurboRARE T2-weighted images (T2WI; TR = 3000 ms, TE=12 ms, Rare Factor=8, number of averages=1, number of slices=20) were acquired. Localized MRS was applied using Point Resolved Spectroscopy (PRESS) with the variable pulse power strengths and optimized relaxation delays (VAPOR) water suppression. Two volumes of interest (VOIs)(1.5mm×2.0mm ×1mm)were located in the center of the prefrontal cortex (PFC) and thalamus, respectively. The 1H-MRS spectra were acquired with the following parameters: TR=1500 ms, TE=12.5 ms, number of averages=512. During MRS/MRI acquisition, the respiration of mice was monitored by a small animal monitoring system and mice body temperature was maintained.
Data analysis.
The 1H-MRS data were analyzed by software, LCModel (LCModel Version 6.3; http://s-provencher.com/pages/lcmodel.shtml). Total creatine (tCr) including creatine (Cr) and phosphocreatine (PCr) measured from the same VOI was used as an internal reference for the quantification of metabolites. Data were fitted to a linear combination of metabolites in simulated basis sets, containing: Cr, PCr, gamma-aminobutyric acid (GABA), glutamate (Glu), glutamine (Gln), glutathione (GSH), myo-inositol (mI), lactate (Lac), N-acetylaspartate (NAA), taurine (Tau), etc. Results were presented as mean ± standard deviation. All data were passed normality testing. Data were analyzed with two-sample, paired student’s t-tests. P < 0.05 was considered statistically significant.
Results and Discussion
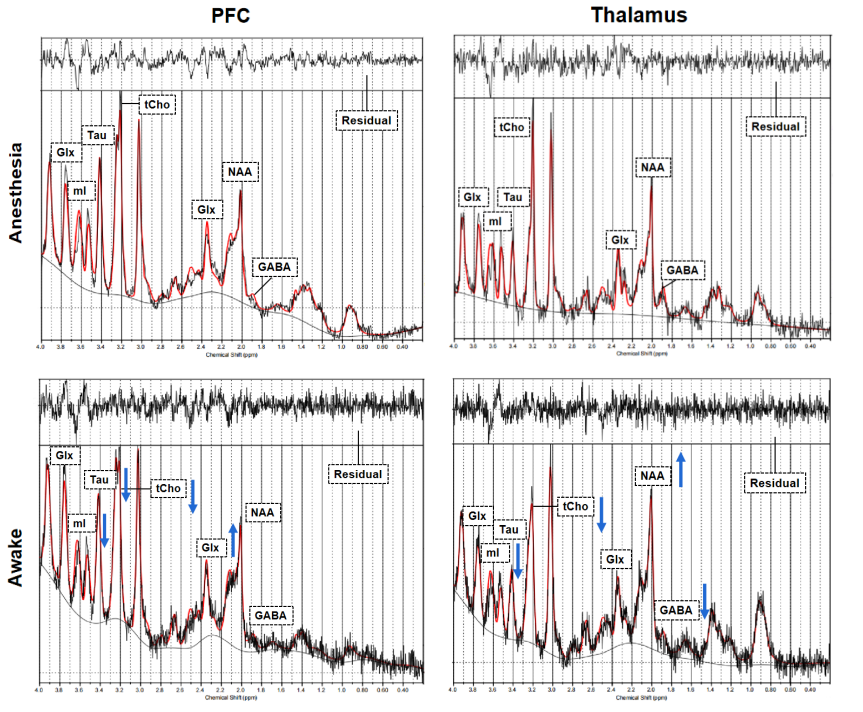
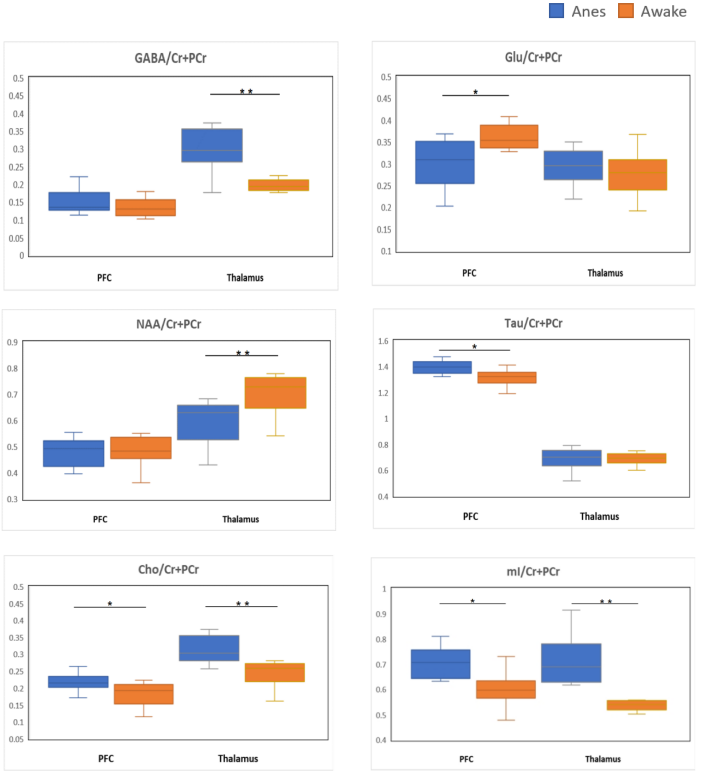
Two VOIs for 1H-MRS measurement were located on PFC and thalamus, respectively (Figure 2). Figure 3 shows the representative metabolite alterations in these two brain regions in awake and anesthetized groups. As shown in Figure 4, compared with the anesthetized mice, the awake group had significantly lower GABA/tCr levels in the thalamus (P=0.002), but no significant alteration in the prefrontal cortex. By contrast, the awake mice show a significant increase of Glu/tCr levels in the prefrontal cortex (P=0.011) and no significant alteration in the thalamus. Note that as for Cho/tCr and mI/tCr, compared with the anesthetized group, the awake group shows a significant decrease in the prefrontal cortex (Cho: P=0.015; mI: P=0.035) and thalamus (Cho: P=0.009; mI: P=0.001). Furthermore, we observed significantly higher NAA/tCr in the thalamus (P=0.007) and lower Tau/tCr in the prefrontal cortex (P=0.017) in awake mice. These results indicate that metabolic profiles in both PFC and thalamus are different between awake and anesthetized states.Glu serves as the main excitatory neurotransmitter, while GABA serves as the inhibitory neurotransmitter in the brain. Our results demonstrated that the effects of anesthesia on excitatory and inhibitory neurotransmitters vary in different brain regions, indicating that the changes of Glu or GABA may be brain-region dependent. The increase of Cho in the anesthetized group could reflect the increase of cell membrane metabolism or cell proliferation. MI levels may have implications in the grading of cerebral astrocytomas [5]. The concentration change of mI may suggest that anesthesia has a negative impact on neuroglial cells. As a neuronal biomarker, the concentration of NAA usually reflects neuronal density and viability [6]. The decrease of NAA in the anesthetized group may suggest impaired neuronal viability due to anesthesia. The reason for the increase of Tau in the anesthetized group remains unclear. One possible explanation is that dynamic diffusion of these molecules occurred during anesthesia [7].
Conclusion
In this work, we developed an MRI-compatible restraint device for the measurement of brain metabolism in awake mice. Using 1H-MRS, we successfully observed the brain metabolic profile of PFC and thalamus in awake mice. In addition, we found metabolic alterations between awake and anesthetized states, indicating that anesthesia has a non-negligible impact on brain metabolism.Acknowledgements
This work was supported in part by grants from the National Natural Science Foundation of China (81873893), Shanghai Municipal Science and Technology Major Project (No.2018SHZDZX01), ZJLab, and Shanghai Center for Brain Science and Brain-Inspired Technology.References
1. Detour J, Elbayed K, Piotto M, Moussallieh FM, Nehlig A, Namer IJ. Ultra fast in vivo microwave irradiation for enhanced metabolic stability of brain biopsy samples during HRMAS NMR analysis. J Neurosci Methods. 2011;201(1):89-97.
2. Epstein AA, Narayanasamy P, Dash PK, et al. Combinatorial assessments of brain tissue metabolomics and histopathology in rodent models of human immunodeficiency virus infection. J Neuroimmune Pharmacol. 2013;8(5):1224-1238.
3. Makaryus R, Lee H, Yu M, et al. The metabolomic profile during isoflurane anesthesia differs from propofol anesthesia in the live rodent brain. J Cereb Blood Flow Metab. 2011;31(6):1432-1442.
4. Takuwa H, Matsuura T, Obata T, Kawaguchi H, Kanno I, Ito H. Hemodynamic changes during somatosensory stimulation in awake and isoflurane-anesthetized mice measured by laser-Doppler flowmetry. Brain Res. 2012; 1472: 107-12.
5. Parthasarathy LK, Seelan RS, Tobias C, et al. Mammalian inositol 3-phosphate synthase: its role in the biosynthesis of brain inositol and its clinical use as a psychoactive agent. In: Majumder AL, Biswas BB, eds. Biology of Inositols and Phosphoinositides: Subcellular Biochemistry. Vol 39. USA: Springer. 2006:293-314.
6. Moffett JR, Arun P, Ariyannur PS, Namboodiri AMA. N-Acetylaspartate reductions in brain injury: impact on post-injury neuroenergetics, lipid synthesis, and protein acetylation. Front Neuroenergetics. 2013;5(DEC):1-19.
7. Baxter CF, Parsons JE, Oh CC, Wasterlain CG, Baldwin RA. Changes of amino acid gradients in brain tissues induced by microwave irradiation and other means. Neurochem Res. 1989;14(9):909-913.
Figures