3586
A high-resolution whole-brain CBF atlas based on more than 100 adult normal mice1Institute of Science and Technology for Brain-Inspired Intelligence, Fudan University, Shanghai, China, 2F.M. Kirby Research Center for Functional Brain Imaging, Kennedy Krieger Research Institute, Baltimore, MD, United States
Synopsis
Arterial spin labeling (ASL) is a powerful MRI technique used to noninvasively measure cerebral blood flow (CBF). In preclinical studies, rodent brain CBF serves as an important indicator in many brain disease models. In this work, we established a whole-brain CBF atlas based on 102 adult normal mice and profiled CBF distributions in 27 brain regions. We found that there is a high correlation of CBF between the left and right hemispheres. Additionally, the high-resolution mouse CBF atlas can be used to distinguish mice with autism disorder, indicating the potential applications of the atlas in preclinical studies.
Introduction
Arterial spin labeling (ASL) MRI is a contrast agent-free technique for noninvasive measurement of cerebral blood flow (CBF), which shows an ability to quantitatively measure tissue perfusion in both clinical and preclinical studies. The mouse is perhaps the most widely used model organism for the study of a variety of brain diseases in preclinical studies. Altered CBF serves as an ideal biomarker in some kinds of brain diseases, such as Alzheimer's disease [1, 2] and brain injury [3]. Currently, most published works use averaged CBF value based on a small sample size that may provide non-negligible bias. Therefore, it is important to understand the normal or standard CBF distributions in different brain structures in mice. However, a rodent CBF atlas based on big sample size is still lacking. This work aimed to build a high-resolution CBF atlas to cover mouse whole brain based on more than 100 mice. In addition, as a demonstration of the method, the CBF values were calculated in a group of SHANK3 [7] mice with autism spectrum disorder (ASD).Materials and Methods
AnimalsThere are two groups of mice used in this work. A total of 102 healthy adult C57BL/6J mice (8 weeks old) were obtained from Shanghai Model Organisms Center (Shanghai, China) to establish CBF atlas. 19 SHANK3 mice with ASD were obtained from Slac Laboratory (Shanghai, China). All experimental protocols were approved by the Animal Ethics Committee of Fudan University.
MRI data acquisition
An 11.7T BioSpec 117/16 USR MRI system equipped with a CryoProbe (Bruker BioSpin, Ettlingen, Germany) was used. A 72 mm volume resonator and a 2×2 phased array coil was used for transmission and image acquisition, respectively. All animals were anesthetized by 1% to 1.5% isoflurane during the MR scanning. Body temperature was maintained at 37°C. Respiration was monitored and maintained at 95-110/min.
We used the drift-corrected steady pulsed imaging and labeling (dSPIL) [4] sequence to obtain ASL data. The dSPIL scheme repeats a label-and-exchange module (LEM) consisting of an un-inverted flow-sensitive alternating inversion recovery (UNFAIR) [6] labeling unit, followed by an exchange time (tmix) to extend the bolus duration to the total experimental time. Multi-slice images are acquired during each exchange time. For each exchange time, four slices are acquired instead of the single slice in the original SPIL study [5].
Both T2 weighted images (T2WI) and ASL were acquired for each mouse. High-resolution T2WI were acquired using a Rapid Acquisition with Relaxation Enhancement (RARE) sequence with the following parameters: TE/TR, 7.5 /5000 ms; RARE factor, 8; spatial resolution, 80 × 80 × 400 μm3. ASL images acquired using dSPIL with parameters: TE/TR: 3.0/5000 ms; repetition:32; RARE factor, 18; scan time: 8min; spatial resolution, 16 × 16 × 100 μm3.
Data Analysis
Motion correction and realignment were performed using SPMMouse based on SPM8 (http://www.fil.ion.ucl.ac.uk/spm/software/spm8/) for MATLAB 2020a (MathWorks, Natick, USA). First, rigid co-registration between mouse template [8] and T2WI was performed. Then, the same process was performed between T2WI and ASL images, and the transform information matrix was applied to the template. With the labels of the anatomical template, CBF values in 27 brain regions were calculated. CBF and ΔM images were processed using home-made code written in MATLAB.
Further, the correlation of CBF in the left and right hemispheres of the whole brain (24 regions) was assessed using the Pearson correlation coefficient. A principal component analysis (PCA) was performed to decompose the different CBF values of the whole brain regions into 3 principal components. A support vector machine (SVM), a supervised machine learning algorithm, was used to classify normal and SHANK3 mice. SVM with RBF kernel was employed to train the models on half ASL data. The rest half was used to test the model.
Results and Discussion
Based on an averaged CBF map (Figure 1), Figure 2 shows a high-resolution whole-brain CBF atlas based on 102 adult normal mice. Different colors represent the CBF values in different brain regions, including amygdala, cerebellar cortex, cerebral cortex (frontal lobe, entorhinal cortex, parieto-temporal lobe), corpus callosum, fasciculus retroflexus, hippocampus, hypothalamus, olfactory bulbs, striatum, thalamus, medulla, pons, midbrain. Except for the last three regions, all the other 12 brain regions are paired in the left and right hemispheres. The CBF results are consistent with other published studies [9].As shown in Figure 3a, the CBF between the left and right hemispheres is highly correlated in 24 brain regions in normal mice. Figure 3b shows the Pearson correlation of CBF in SHANK3 mice. Relative to normal mice, the CBF correlation between the left and right hemispheres is much lower (Figure 3b). As shown in Figure 4, based on the CBF atlas, SHANK3 mice can be successfully divided from normal mice using an SVM classifier. The accuracy of classification is 0.89 and the F1 score was 0.79 after 10-fold cross-validation.
Conclusion
We established a whole-brain CBF atlas based on 102 adult normal mice and profiled CBF distributions in 27 brain regions. We found that there is a high correlation of CBF between the left and right hemispheres. Additionally, the high-resolution mouse CBF atlas can be used to distinguish mice with autism disorder, indicating the potential applications of the atlas in preclinical studies.Acknowledgements
This work was supported in part by grants from the National Natural Science Foundation of China (81873893), Shanghai Municipal Science and Technology Major Project (No.2018SHZDZX01), ZJLab, and Shanghai Center for Brain Science and Brain-Inspired Technology.
References
1. Mughal A, Harraz O F, Gonzales A L, et al. PIP2 improves cerebral blood flow in a mouse model of Alzheimer’s disease. Function, 2021, 2(2): zqab010.
2. Li H, Guo Q, Inoue T, et al. Vascular and parenchymal amyloid pathology in an Alzheimer disease knock-in mouse model: interplay with cerebral blood flow. Molecular neurodegeneration, 2014, 9(1): 1-15.
3. Ohshima M, Tsuji M, Taguchi A, et al. Cerebral blood flow during reperfusion predicts later brain damage in a mouse and a rat model of neonatal hypoxic–ischemic encephalopathy. Experimental neurology, 2012, 233(1): 481-489.
4. Wenjing Xu, Jiadi Xu, and Xiaoyong Zhang. High-resolution whole brain perfusion mapping in mice by a drift-corrected steady pulsed imaging and labeling sequence. Proc. Intl. Soc. Mag. Reson. Med. 27 (2020): ePoster..
5. Xu J, Qin Q, Wu D, et al. Steady pulsed imaging and labeling scheme for noninvasive perfusion imaging. Magn Reson Med. 2016;75(1):238-248. doi:10.1002/mrm.25641*
6. Tanabe JL, Yongbi M, Branch C, Hrabe J, Johnson G, Helpern JA. MR perfusion imaging in human brain using the UNFAIR technique. J Magn Reson Imaging. 1999;9(6):761-767.
7. Zhou Y, Kaiser T, Monteiro P, et al. Mice with Shank3 mutations associated with ASD and schizophrenia display both shared and distinct defects. Neuron, 2016, 89(1): 147-162.
8. Dorr A E, Lerch J P, Spring S, et al. High resolution three-dimensional brain atlas using an average magnetic resonance image of 40 adult C57Bl/6J mice. Neuroimage, 2008, 42(1): 60-69.
9. Lei H, Pilloud Y, Magill A W, et al. Continuous arterial spin labeling of mouse cerebral blood flow using an actively-detuned two-coil system at 9.4 T//2011 Annual International Conference of the IEEE Engineering in Medicine and Biology Society. IEEE, 2011: 6993-6996.
Figures
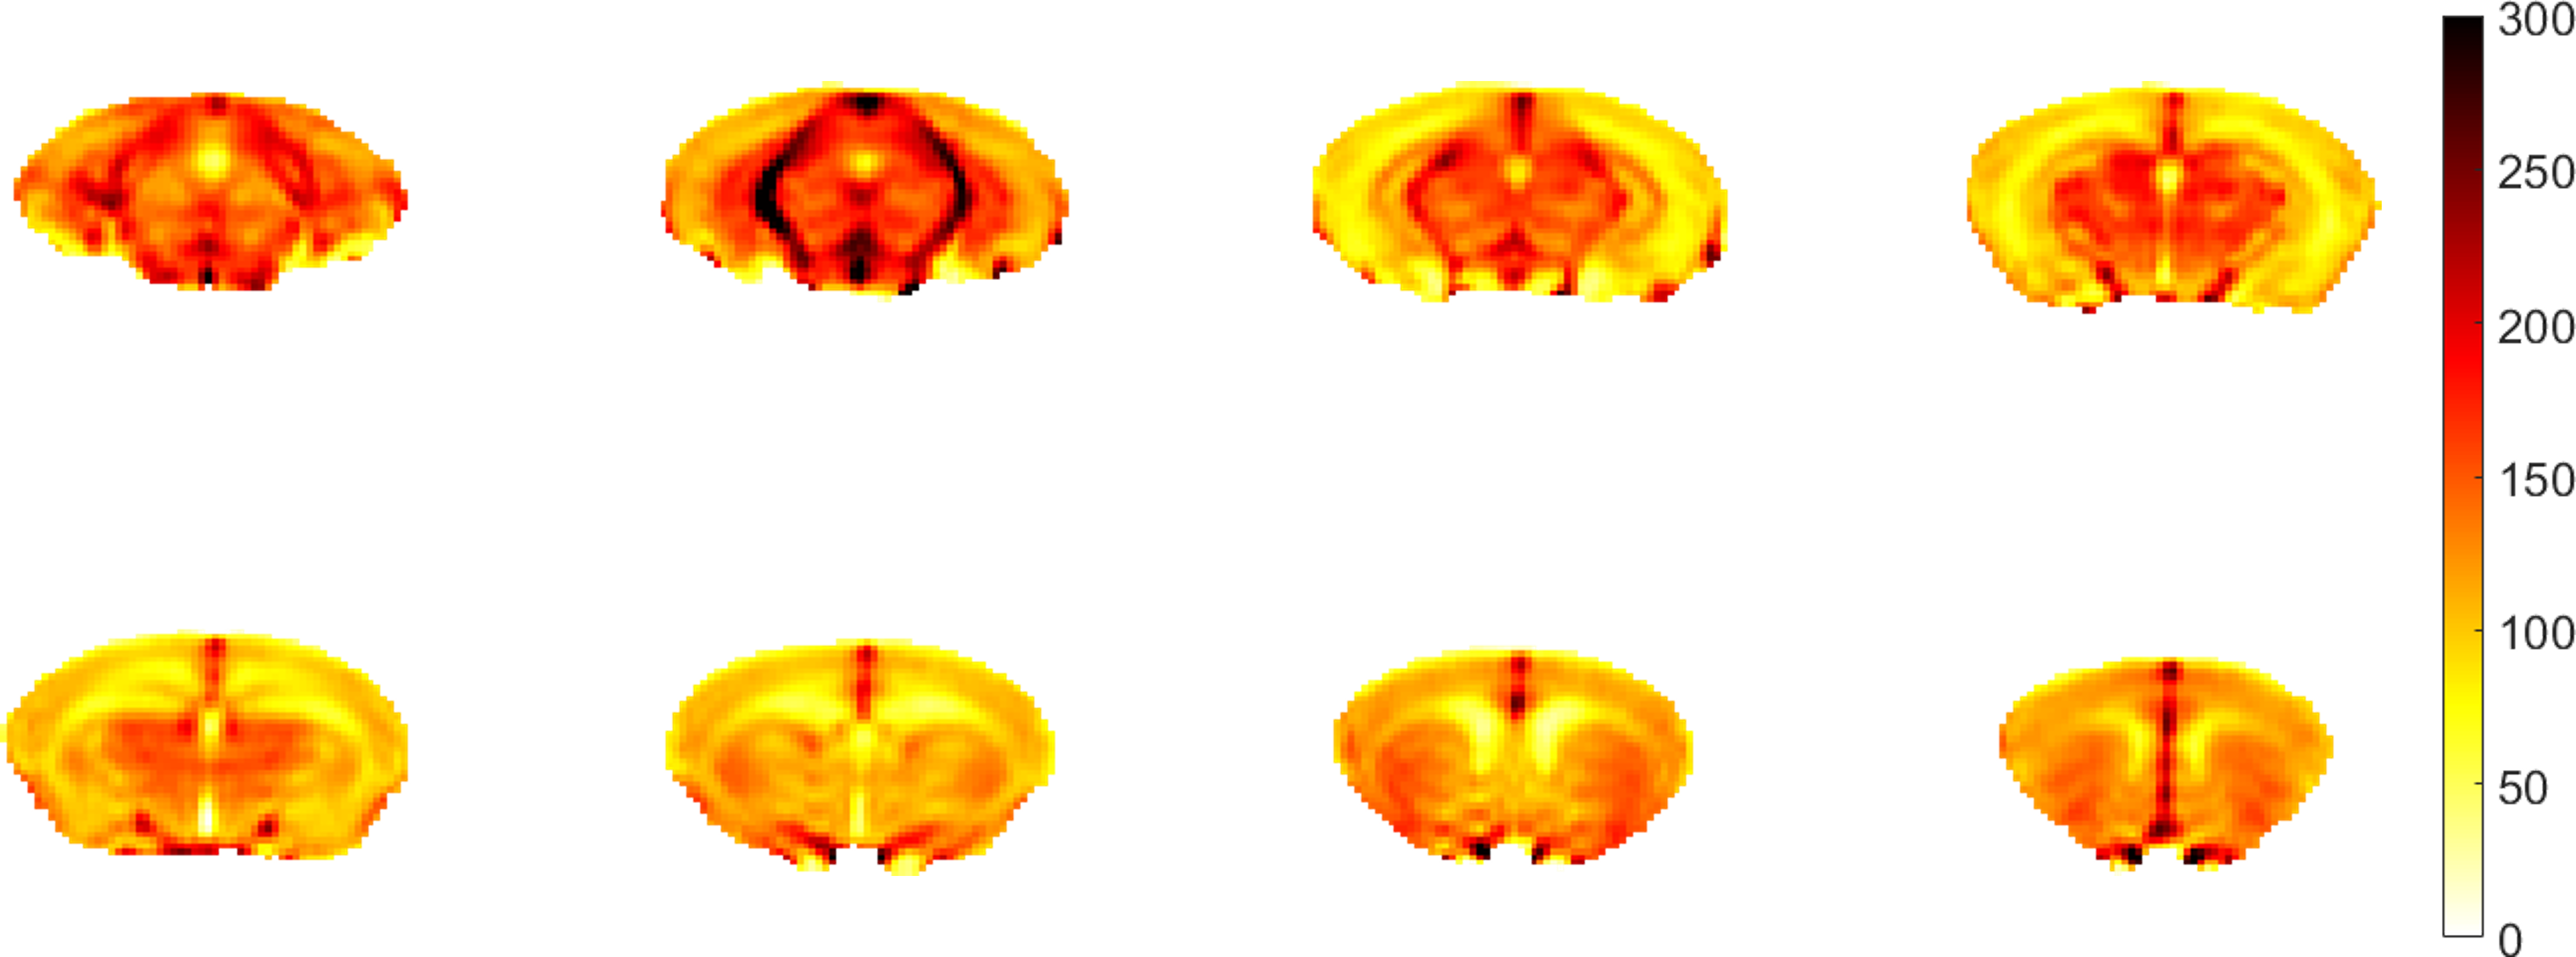
Figure 1. A representative averaged CBF map. The color bar indicates CBF values in the mouse brain (CBF/100g/min).
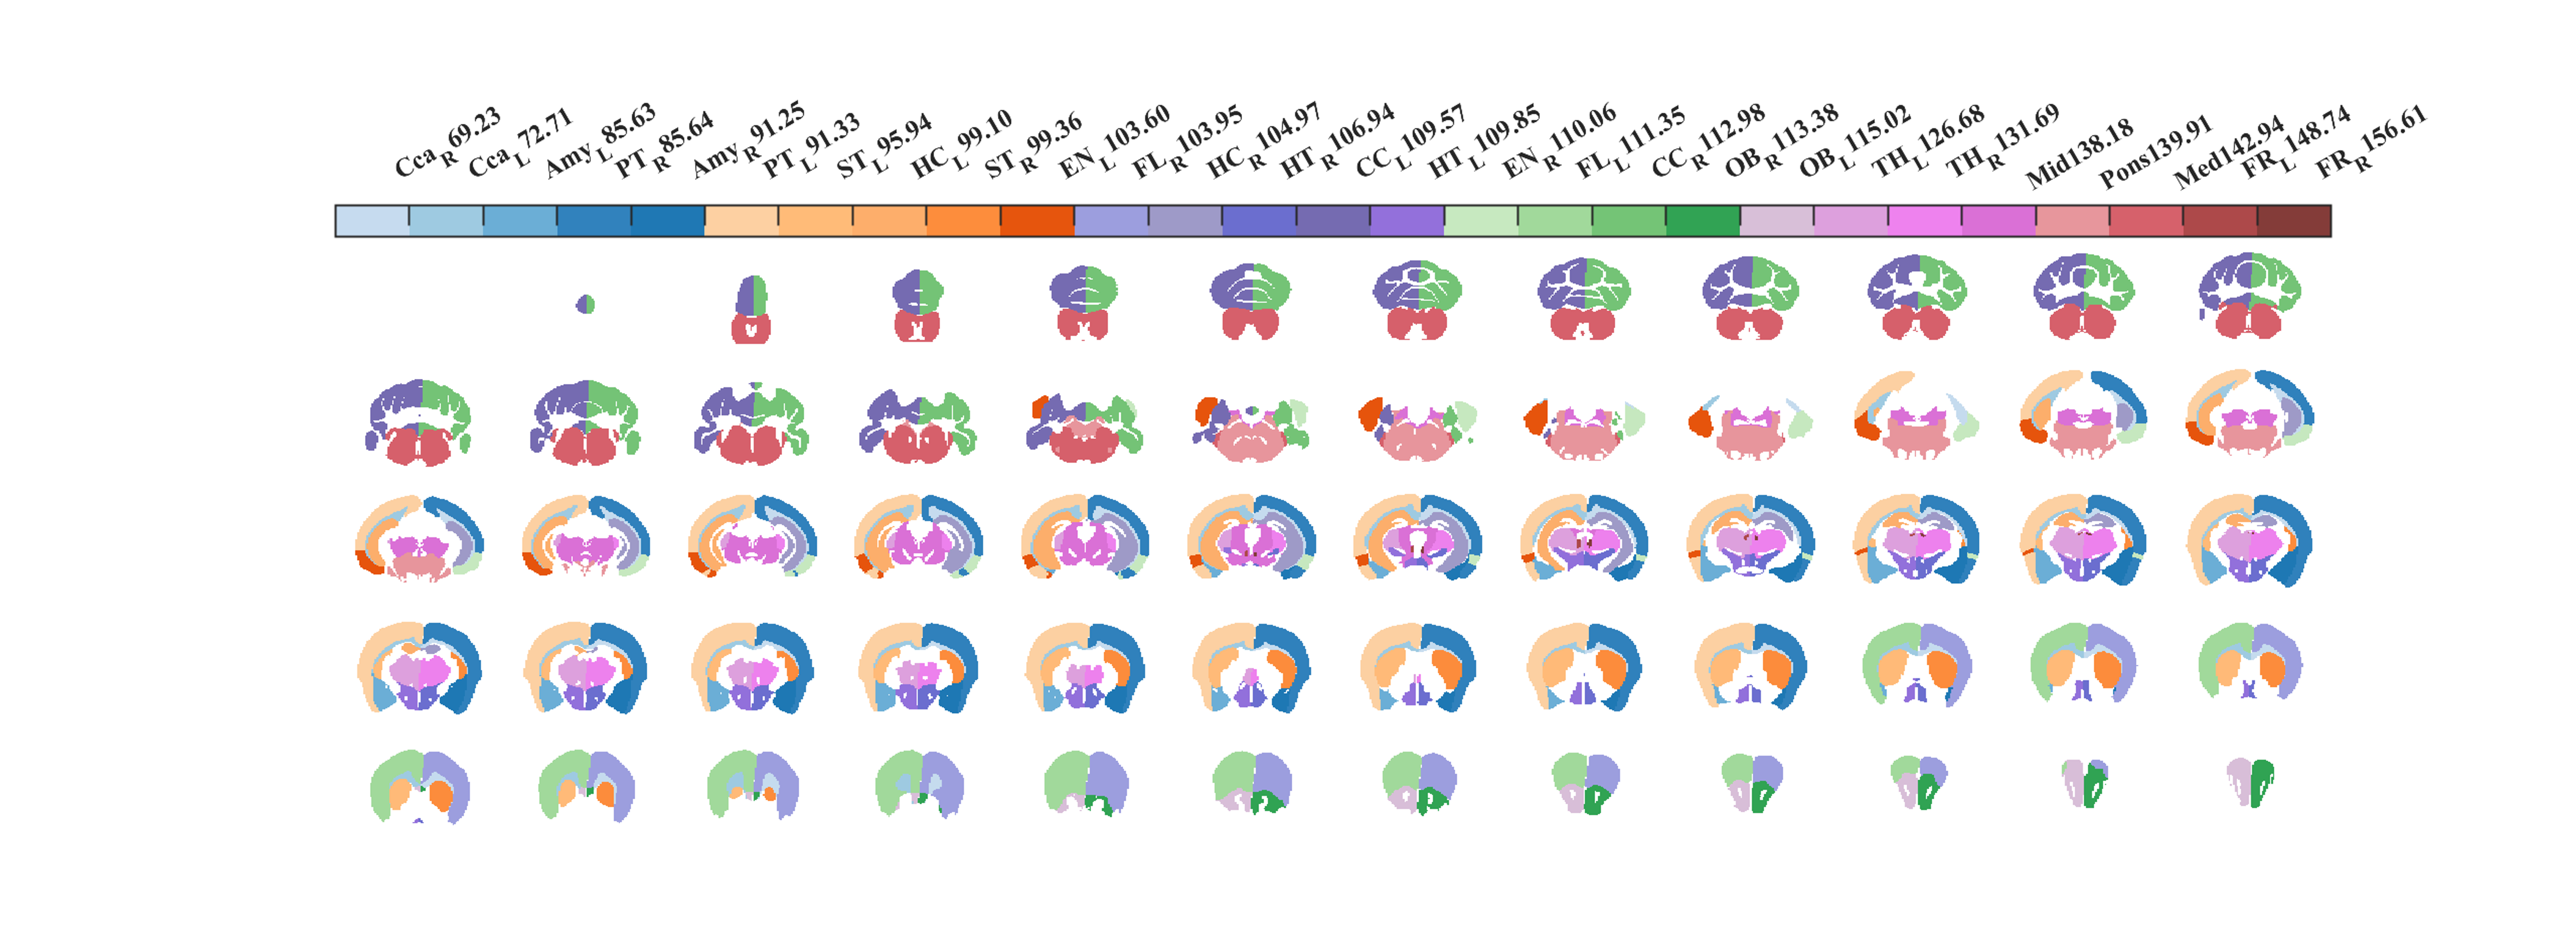
Figure 2. A high-resolution whole-brain mouse CBF atlas. This template contains 27 brain regions, in which different colors represent the CBF values in different brain regions.
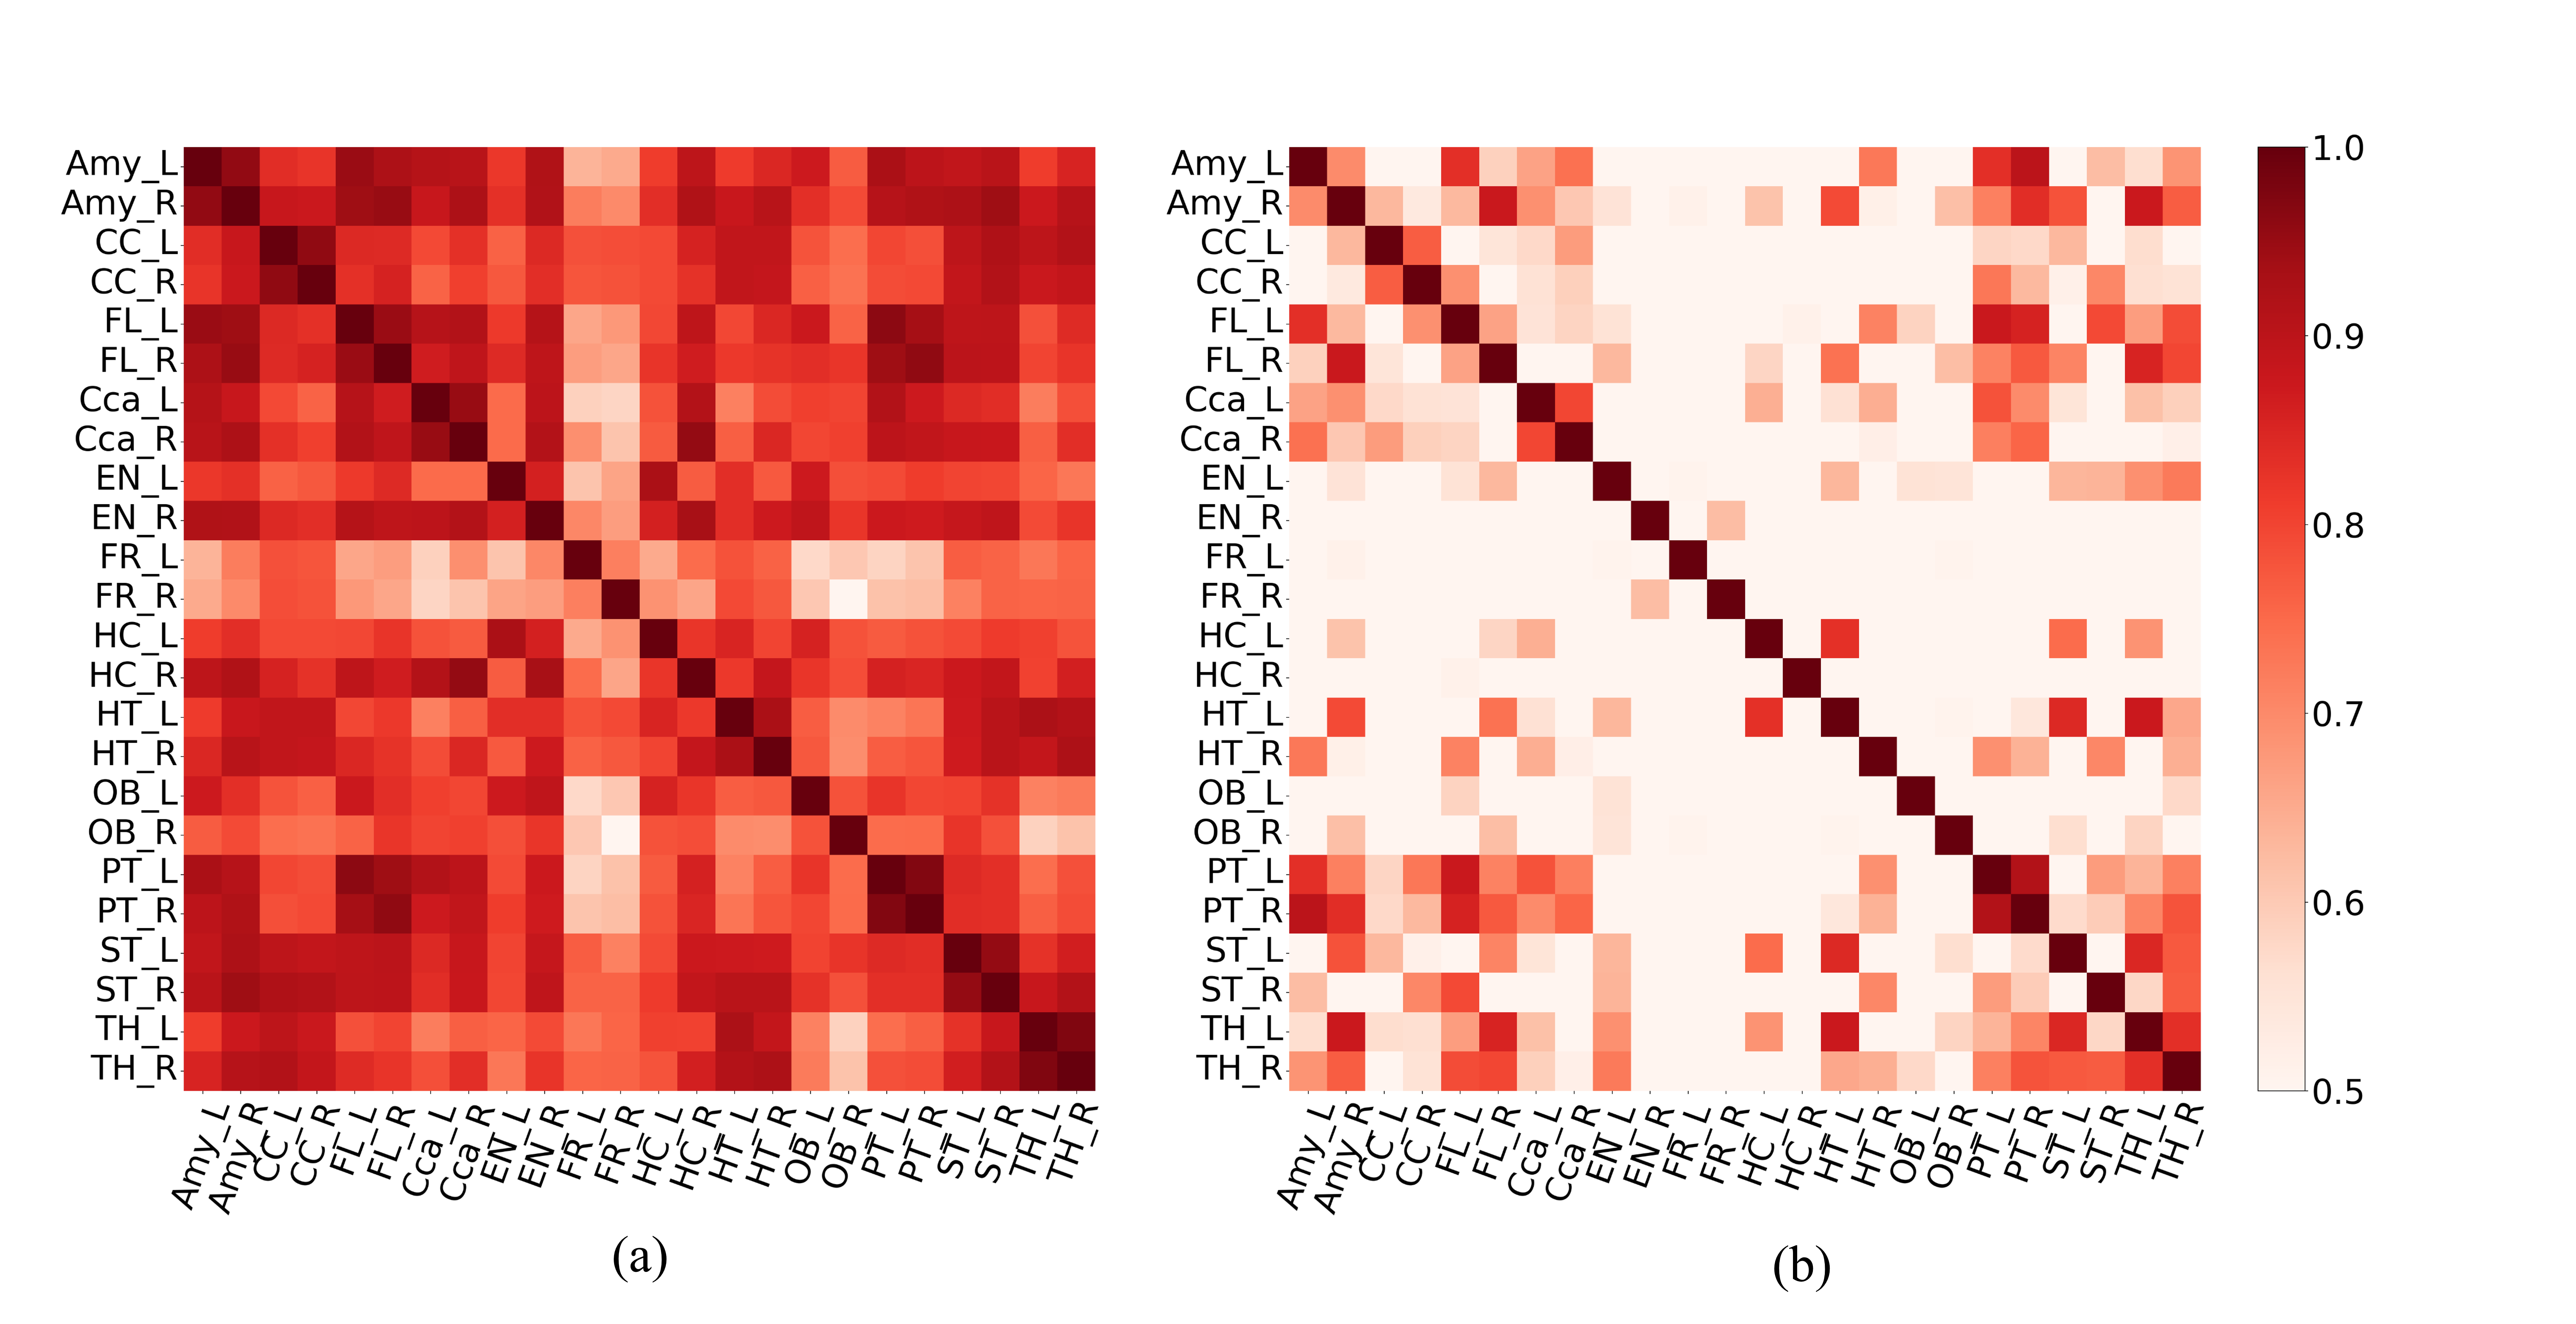
Figure 3. CBF correlation map between the left and right hemispheres. (a) 24 brain regions were calculated in normal mice. Most of the correlations are higher than 0.6. (b) The correlations were investigated in 24 brain regions in SHANK3 mice. Most of the correlations are lower than 0.6.
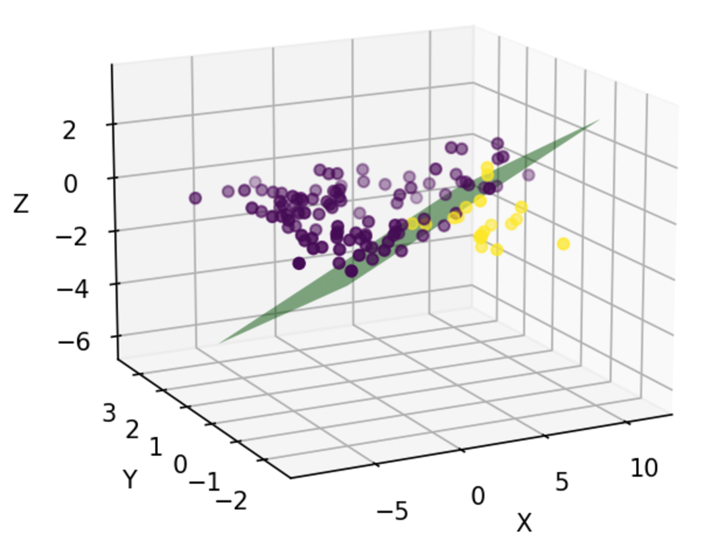
Figure 4. Classification of normal and SHANK3 mice using CBF. SHANK3 mice can be classified from normal mice with an accuracy of 0.89 and the f1-score of 0.79 after 10-fold cross-validation.