3576
Assessment of MRF for Simultaneous T1 and T2 Quantification and Water-Fat Separation in the Liver at 0.55T1Department of Radiology, University of Michigan, Ann Arbor, MI, United States, 2Department of Biomedical Engineering, University of Michigan, Ann Arbor, MI, United States
Synopsis
This study aims to assess the feasibility of performing MRF in the liver and examine the feasibility of water-fat separation using rosette MRF at low field. MRF sequences using spiral and rosette trajectories were implemented on a 0.55T scanner. T1 and T2 quantification in the liver was achieved in a single breath-hold of <15s with in-plane resolution of 1.56×1.56mm2 and slice thickness of 5mm. In addition, water-fat separation was achieved along with T1 and T2 quantification with no time penalty using rosette MRF.
Introduction
The goal of this work is to 1) assess the feasibility of performing MR Fingerprinting (MRF) in the liver on a 0.55T scanner; 2) compare T1 and T2 measurements made with MRF in the liver at 0.55T to values previously reported using clinically standard techniques; and 3) examine the feasibility of water-fat separation using rosette MRF at low field. MRF has been shown to enable efficient and accurate quantification of relaxation times in a variety of organs at 1.5 and 3 T1–4, and in the brain at 0.55T5. While low-field MRI systems may offer efficient imaging due to shorter T1, longer T2/T2*, potentially improved field homogeneity, and lower cost compared to clinical 1.5T and 3T scanners, the lower SNR inherent at lower field may pose challenges for MRF. While the MRF acquisition can be lengthened to combat the lower SNR at lower field strengths in organs such as the brain, this option is not possible in the liver, where data must be collected in a breathhold. Additionally, the much smaller chemical shift of fat at 0.55T compared to 1.5T and 3T makes it challenging to achieve the robust fat suppression required for quantitative mapping in the liver. In this work, the potential of rosette MRF, which has been demonstrated for fat-water separation in cardiac applications6, is explored for the quantification of T1 and T2 in the liver at 0.55 T.Methods
Two MRF sequences using spiral and rosette trajectories, respectively, were implemented on a 0.55T scanner (Siemens Free.Max, Erlangen, Germany). The lower maximal gradient amplitude and slew rate of this scanner were accommodated (15mT/m and 40mT/m/ms). The spiral trajectory (Figure1a) has a readout duration of 11.9ms with FOV 300x300mm2 and matrix size 192x192. The rosette trajectory (Figure1b) was designed for the same FOV and matrix size, as well as fat signal suppression at 0.55T with a readout duration of 9.87ms.For both spiral and rosette MRF, 1000 time points were acquired using a FISP readout following an inversion pulse with inversion time of 21ms 2. The flip angles were sinusoidally ramped up to 70 degrees2 with fixed TR/TE of 15ms/1.6ms for spiral MRF and 13ms/1.6ms for rosette MRF. The total acquisition time was 15s/13s during a breath-hold for spiral/rosette MRF. In-plane resolution was 1.56x1.56mm2, and slice thickness was 5mm for all phantom and in vivo experiments. The MRF dictionary incorporating slice profile imperfection correction was generated using Bloch equation simulations7. A low-rank reconstruction with l1-TV regularization was used to generate the final T1 and T2 maps and proton density images8. For rosette MRF, as described in previous work6, fat images were generated by demodulating the acquired data at the fat frequency; a B0 map was generated by dividing the data at two echoes; and B0 correction was performed to generate the final water T1 and T2 maps and water and fat proton density images.
The accuracy of these low-field MRF methods for T1 and T2 quantification was validated in the ISMRM/NIST phantom. The means and standard deviations of the T1 and T2 values in the T2 layer within physiological range measured using MRF were compared with gold standard values acquired using inversion recovery spin-echo and single-echo spin-echo methods. Six healthy subjects were scanned after written informed consent in this IRB-approved study. A transverse slice in the liver was acquired using the proposed spiral and rosette MRF sequences. ROIs in the liver were drawn manually, and the mean and standard deviation in T1 and T2 values were calculated.
Results
In the ISMRM/NIST phantom, T1 and T2 measurements using spiral and rosette MRF were in good agreement with the reference values (Figure 2). In the liver, the averaged T1 and T2 values measured by spiral MRF were 369.8±18.3 ms and 42.2±5.2 ms. The averaged T1 and T2 values measured by rosette MRF were 372.2±19.5 ms and 47.6±2.9 ms. Representative T1 and T2 maps, and proton density images in a healthy subject are shown in Figure 3.Discussion
Both spiral and rosette MRF are feasible at 0.55T using a low-rank reconstruction, and both achieved good image quality in the liver in a single ~15s breath-hold. Rosette MRF enables fat suppression in the water T1 and T2 maps, and proton density image. Furthermore, a fat image could also be generated from the same dataset with no penalty in acquisition time. T1 values measured by spiral MRF and rosette MRF are comparable, and both are higher than literature values (339ms measured by MOLLI)9. This trend is consistent with previous findings in cardiac MRF at 1.5T and 3T compared with MOLLI measurements6. MRF T2 measurements are lower than literature values (66ms measured by T2prep-bSSFP) 9, which is also consistent with previous findings in MRF measurements of the liver at 3T4. Rosette MRF generated higher T2 values than spiral MRF. Previous work has also reported similar findings in the heart at 1.5T and 3T6.Conclusions
This study shows that it is feasible to measure T1 and T2 simultaneously in the liver using MRF at 0.55T within the acquisition time of 15s. In addition, water-fat separation can be achieved along with T1 and T2 quantification with no time penalty using rosette MRF.Acknowledgements
This work is supported by NSF/CBET 1553441, NIH/NHLBI R01HL094557, and Siemens Healthineers (Erlangen, Germany).References
1. Ma, D. et al. Magnetic resonance fingerprinting. Nature 495, 187–92 (2013).
2. Jiang, Y., Ma, D., Seiberlich, N., Gulani, V. & Griswold, M. MR fingerprinting using fast imaging with steady state precession (FISP) with spiral readout. Magn. Reson. Med. 74, 1621–1631 (2015).
3. Hamilton, J. I. et al. MR fingerprinting for rapid quantification of myocardial T1, T2, and proton spin density. Magn. Reson. Med. 77, 1446–1458 (2017).
4. Chen, Y. et al. MR Fingerprinting for Rapid Quantitative Abdominal Imaging. Radiology 279, 278–286 (2016).
5. Campbell-Washburn, A. E., Jiang, Y., Körzdörfer, G., Nittka, M. & Griswold, M. A. Feasibility of MR fingerprinting using a high-performance 0.55 T MRI system. Magn. Reson. Imaging 81, 88–93 (2021).
6. Liu, Y., Hamilton, J., Eck, B., Griswold, M. & Seiberlich, N. Myocardial T1 and T2 quantification and water–fat separation using cardiac MR fingerprinting with rosette trajectories at 3T and 1.5T. Magn. Reson. Med. (2021). doi:10.1002/mrm.28404
7. Hamilton, J. I. et al. Investigating and reducing the effects of confounding factors for robust T1 and T2 mapping with cardiac MR fingerprinting. Magn. Reson. Imaging 53, 40–51 (2018).
8. Hamilton, J. I. et al. Simultaneous multislice cardiac magnetic resonance fingerprinting using low rank reconstruction. NMR Biomed. 32, e4041 (2018).
9. Campbell-Washburn, A. E. et al. Opportunities in interventional and diagnostic imaging by using high-performance low-field-strength MRI. Radiology 293, 384–393 (2019).
Figures
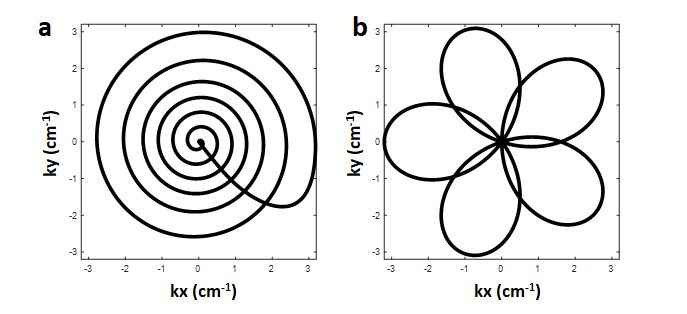
Figure 1. One arm of the spiral (a) and rosette (b) trajectories used in the low-field MRF sequences.
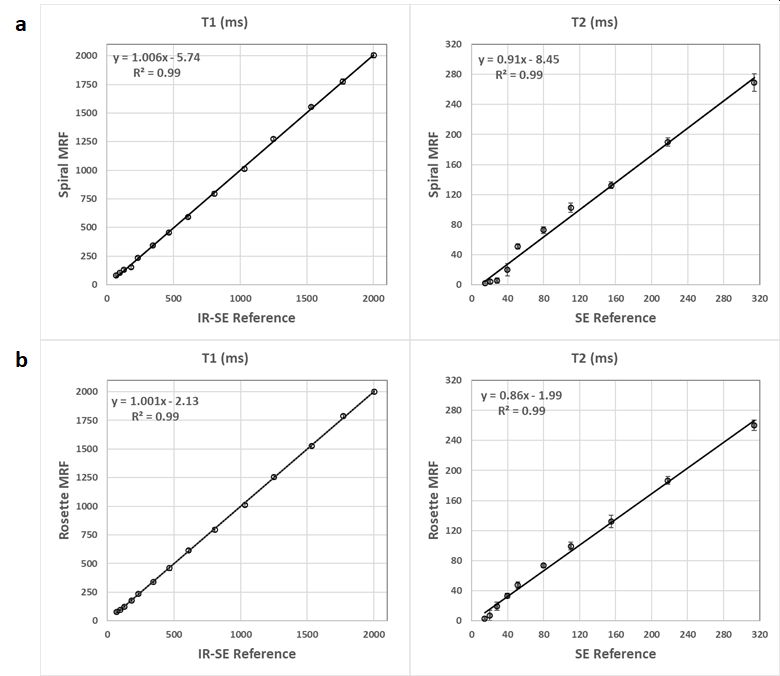
Figure 2. T1 and T2 measurements in the T2 layer of the ISMRM/NIST phantom using spiral MRF (a) and rosette MRF (b) at 0.55T compared with reference values acquired using inversion recovery spin-echo for T1 and single-echo spin-echo for T2.
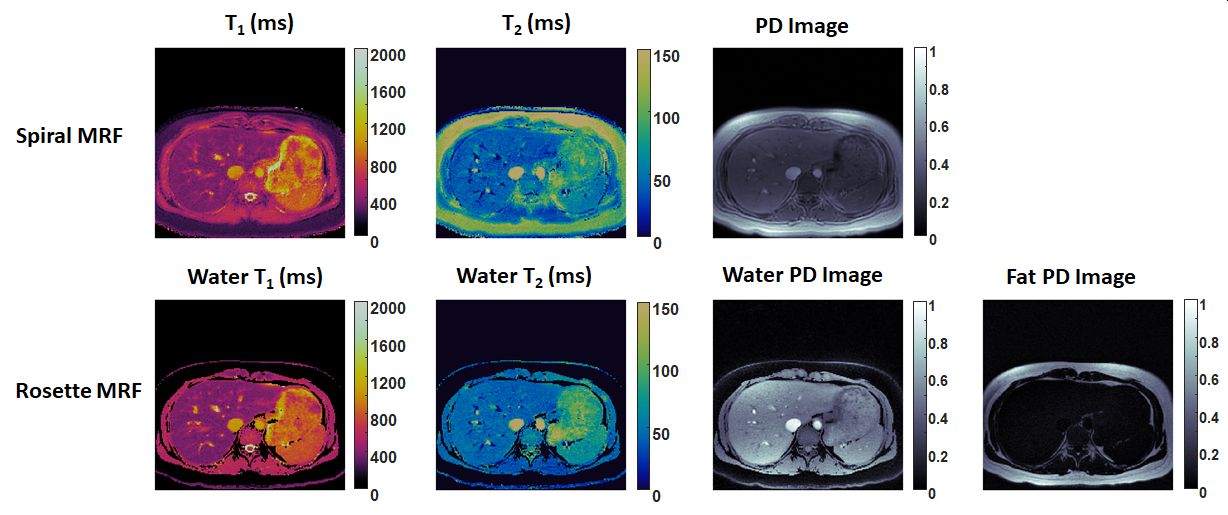
Figure 3. Representative T1 and T2 maps, and proton density (PD) images in the liver in a healthy subject acquired using spiral MRF (top row) and rosette MRF (bottom row) at 0.55T. In-plane resolution was 1.56x1.56mm2; slice thickness was 5mm.