3573
Quality-of-life Worsening Predicted Using Baseline Hyperpolarized 3He MRI Ventilation Texture Features and Machine-Learning1Department of Medical Biophysics, Western University, London, ON, Canada, 2Robarts Research Institute, Western University, London, ON, Canada, 3Division of Respirology, Department of Medicine, Western University, London, ON, Canada, 4School of Biomedical Engineering, Western University, London, ON, Canada
Synopsis
Texture analysis may be used to extract quantitative information from hyperpolarized 3He MR ventilation images to help explain clinically-relevant outcomes and disease progression. We aimed to combine texture analysis with machine-learning to generate classification models for predicting worsening quality-of-life in ex-smokers with and without COPD. We identified six texture feature contributors, which outperformed standard imaging and clinical variables, with the top machine-learning model achieving a classification accuracy of 80.2% at predicting worsening quality-of-life within 2-3 years. These pilot results suggest that 3He MRI texture features may provide additional prognostic information to predict clinically-relevant changes in quality-of-life in ex-smokers.
INTRODUCTION:
X-ray computed tomography (CT) based measurements of emphysema and airways disease have shown to provide prognostic information,1 yet none of the currently developed CT biomarkers are able to reflect longitudinal changes in clinically-relevant outcomes in patients with chronic obstructive pulmonary disease (COPD).2 This is important because longitudinal changes in quality-of-life are associated with changes in lung function and mortality.3,4 Pulmonary hyperpolarized 3He MRI provides a way to measure lung ventilation and parenchyma microstructure in patients with COPD, utilizing ventilation defect percent (VDP) and terminal airspace enlargement measurements, which are associated with COPD outcomes,5 correlate with longitudinal changes in quality-of-life6 and are sensitive to disease-related changes earlier than either CT or standard pulmonary function tests.7,8 Currently no imaging measurements except VDP6 have been observed to predict changes in quality-of-life. Here, we evaluated matched ex-smoker participants who underwent 3He MRI scans at baseline and follow-up visits, approximately 2-3 years apart. A pipeline was developed to extract texture features from ventilation images and predictive models for longitudinal worsening in quality-of-life were generated using various machine learning approaches. The predictive power of clinical measurements, ventilation imaging and first-, higher-order and transform texture features9 were evaluated for identifying participants with longitudinal change in St. George's Respiratory Questionnaire (SGRQ) score greater than the minimal-clinically-important-difference (MCID).10METHODS:
We retrospectively evaluated baseline and follow-up (2.4±0.6 years) data of 50 ex-smokers (between ages 40-85, with smoking history >10 pack years) with and without a diagnosis of COPD, who provided informed consent to perform spirometry, 3He MRI and thoracic CT scans.11 Spirometry was acquired according to the American Thoracic Society/European Respiratory Society guidelines.12 COPD severity was defined according to the Global-Initiative-for-Chronic-Obstructive-Lung-Disease (GOLD) grades.13Thoracic CT scans were acquired while participants were in supine position using a 64-slice Lightspeed VCT scanner (GE Healthcare, Milwaukee, WI) during single breath hold of 1L bag of N2 gas. The total effective dose of 1.8mSv was received for the scan. (64×0.625mm, 120kVp, 100-effective-mA, tube-rotation-time=500ms, pitch=1.0, slice thickness=1.25mm, slices=200-250).
MRI was acquired using a whole-body 3.0 T Discovery MR750 (GE Healthcare, Milwaukee, WI), a whole-body radiofrequency coil and a fast-gradient-recalled echo (FGRE) sequence with a partial echo implementation to acquire the conventional 1H images using the following parameters: total-acquisition-time=8s, repetition-time[TR]/echo time[TE]/flip angle= 4.7ms/1.2ms/30°, field-of-view[FOV]=40×40cm2, bandwidth[BW]=24.4kHz, matrix=128×80 (zero-padded to 128×128), partial echo percent=62.5%, slices=15-17, slice thickness=15mm, 0-gap. Hyperpolarized 3He ventilation images were acquired using an FGRE sequence with a partial echo and following parameters: Acquisition-time=10s, TR/TE/flip angle= 3.8ms/1.0ms/7°, FOV=40×40cm2, matrix=128×80 (zero-padded to 128×128), BW=48.8kHz, partial echo percent=62.5%, slices=15-17, slice-thickness=15mm, 0-gap.14
We dichotomized 50 ex-smoker participants based on the MCID in SGRQ score of 4 points.10 Group differences were evaluated for clinical and imaging parameters between ∆SGRQ<MCID (n=34) and ∆SGRQ≥MCID (n=16) groups using independent samples t-test. The presence of CT emphysema measured as RA950 was defined using a 6% threshold.15 Custom features were extracted from the gray-level run-length, gap-length, zone-size, dependence and co-occurrence-matrices via PyRadiomics platform.9 Feature selection was performed using principle component analysis (PCA) and Boruta analysis with a random forest classifier. Shapiro-Wilk tests were used to determine the normality of the data distribution. Non-parametric tests were performed for non-normally distributed data. Model performance was evaluated using area-under-the-receiver-operator-curve(AUC), sensitivity and specificity metrics.
RESULTS:
We identified six texture feature predictors which significantly contributed to machine-learning models used to predict participants with longitudinal quality-of-life worsening, defined by ∆SGRQ≥MCID. There were no significant differences at baseline or between groups. Worsening quality-of-life predictive models using only ventilation features achieved the highest classification accuracy of 80.2% with a Gaussian Naïve Bayes algorithm. Neither the addition of quantitative CT and MRI measurements nor standard clinical variables significantly improved model performances, with the top classification models achieving 74% and 68% accuracy, respectively. The features ranked and selected from PCA and Boruta analysis to be included in the models were: First Order-Skewness, Low-Gray-Level-Zone-Emphasis (LGLZE), Wavelet-based: LH-Correlation, HL-GLCM-Idmn, LL-GLCM-Idn; and LoG-NGTDM-Coarseness transform feature. The best performing non-texture variable from baseline data was CT-RA950 (AUC=0.609), which was outperformed by the Wavelet-LH-GLCM-Correlation feature (AUC=0.788) and other selected texture features in the models. Additionally, this texture feature at baseline significantly correlated (r=0.2-0.5, p<.05) with the longitudinal changes in SGRQ, and the longitudinal change in this texture feature also correlated with the change in VDP, previously shown to be the only biomarker to correlate with longitudinal change in quality-of-life.6DISCUSSION:
We developed an algorithm to identify 3He MR ventilation features that predicted participants who would experience worsening quality-of-life within 2-3 years. Based on the mathematical equations of Skewness and GLCM-Correlation features9 they measure joint probabilities of occurrence of specified pixel pairs, and the asymmetry of the distribution of values about the mean pixel value. GLCM-Idmn and Idn features capture lung regions with high signal variations or heterogeneity and spatial coarseness related to local ventilation defects. Used together with machine-learning, these texture features independently provided the highest accuracy and outperformed both the CT and MR imaging and clinical variables used in models for predicting longitudinal worsening in quality-of-life within 2-3 years in ex-smoker participants.CONCLUSIONS:
We identified baseline hyperpolarized 3He MRI texture features which independently predicted and correlated with longitudinal worsening in quality-of-life, providing additional context and supporting previous findings.6Acknowledgements
No acknowledgement found.References
1. Haruna, A. et al. CT scan findings of emphysema predict mortality in COPD. Chest 138, 635-640, doi:10.1378/chest.09-2836 (2010).
2. Chapman, K. R. et al. Intravenous augmentation treatment and lung density in severe α1 antitrypsin deficiency (RAPID): a randomised, double-blind, placebo-controlled trial. Lancet 386, 360-368, doi:10.1016/s0140-6736(15)60860-1 (2015).
3. Lutter, J. I. et al. Health-related quality of life associates with change in FEV(1) in COPD: results from the COSYCONET cohort. BMC Pulm Med 20, 148, doi:10.1186/s12890-020-1147-5 (2020).
4. Gudmundsson, G. et al. Mortality in COPD patients discharged from hospital: the role of treatment and co-morbidity. Respir Res 7, 109, doi:10.1186/1465-9921-7-109 (2006).
5. Kirby, M., Pike, D., Coxson, H. O., McCormack, D. G. & Parraga, G. Hyperpolarized (3)He ventilation defects used to predict pulmonary exacerbations in mild to moderate chronic obstructive pulmonary disease. Radiology 273, 887-896, doi:10.1148/radiol.14140161 (2014).
6. Kirby, M. et al. MRI ventilation abnormalities predict quality-of-life and lung function changes in mild-to-moderate COPD: longitudinal TINCan study. Thorax 72, 475-477, doi:10.1136/thoraxjnl-2016-209770 (2017).
7. Fain, S. B. et al. Early emphysematous changes in asymptomatic smokers: detection with 3He MR imaging. Radiology 239, 875-883, doi:10.1148/radiol.2393050111 (2006).
8. Kirby, M. et al. On the role of abnormal DL(CO) in ex-smokers without airflow limitation: symptoms, exercise capacity and hyperpolarised helium-3 MRI. Thorax 68, 752-759, doi:10.1136/thoraxjnl-2012-203108 (2013).
9. van Griethuysen, J. J. M. et al. Computational Radiomics System to Decode the Radiographic Phenotype. Cancer Research 77, e104-e107, doi:10.1158/0008-5472.can-17-0339 (2017).
10. Jones, P. W. St. George's Respiratory Questionnaire: MCID. Copd 2, 75-79, doi:10.1081/copd-200050513 (2005).
11. Parraga, G. et al. Hyperpolarized 3He ventilation defects and apparent diffusion coefficients in chronic obstructive pulmonary disease: preliminary results at 3.0 Tesla. Invest Radiol 42, 384-391, doi:10.1097/01.rli.0000262571.81771.66 (2007).
12. Miller, M. R. et al. Standardisation of spirometry. Eur Respir J 26, 319-338, doi:10.1183/09031936.05.00034805 (2005).
13. Vestbo, J. et al. Global strategy for the diagnosis, management, and prevention of chronic obstructive pulmonary disease: GOLD executive summary. Am J Respir Crit Care Med 187, 347-365, doi:10.1164/rccm.201204-0596PP (2013).
14. Kirby, M. et al. Longitudinal Computed Tomography and Magnetic Resonance Imaging of COPD: Thoracic Imaging Network of Canada (TINCan) Study Objectives. Chronic Obstr Pulm Dis 1, 200-211, doi:10.15326/jcopdf.1.2.2014.0136 (2014).
15. Lynch, D. A. et al. CT-Definable Subtypes of Chronic Obstructive Pulmonary Disease: A Statement of the Fleischner Society. Radiology 277, 192-205, doi:10.1148/radiol.2015141579 (2015).Figures
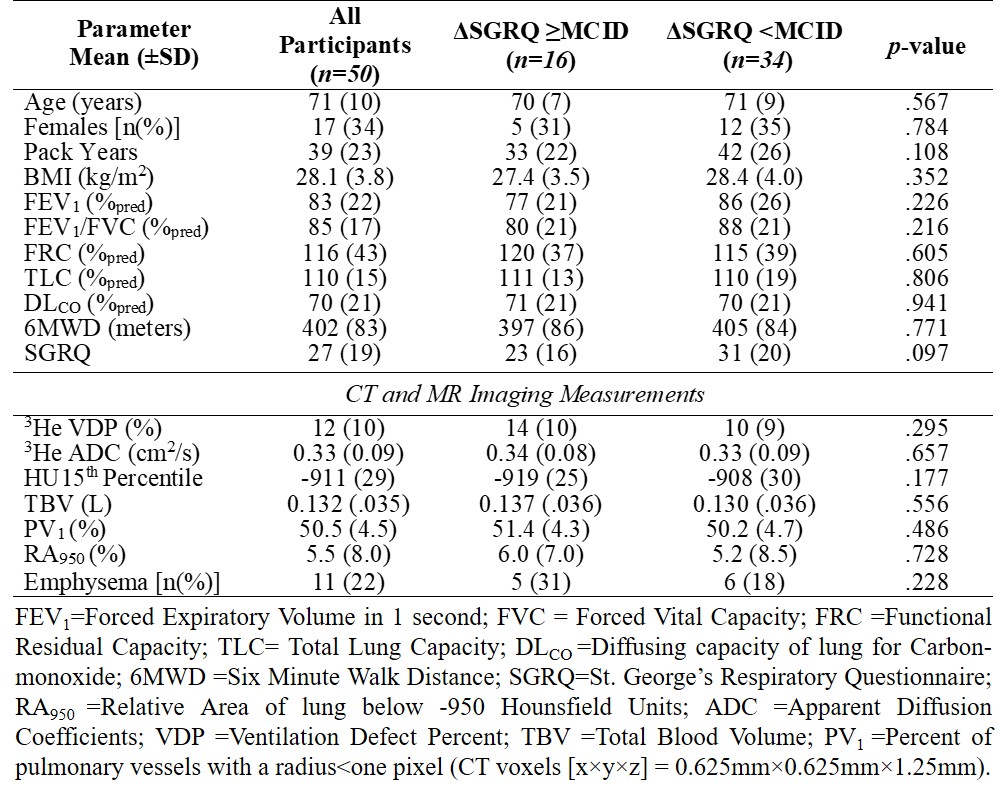
Table 1. Participant baseline demographics, pulmonary function and imaging information.
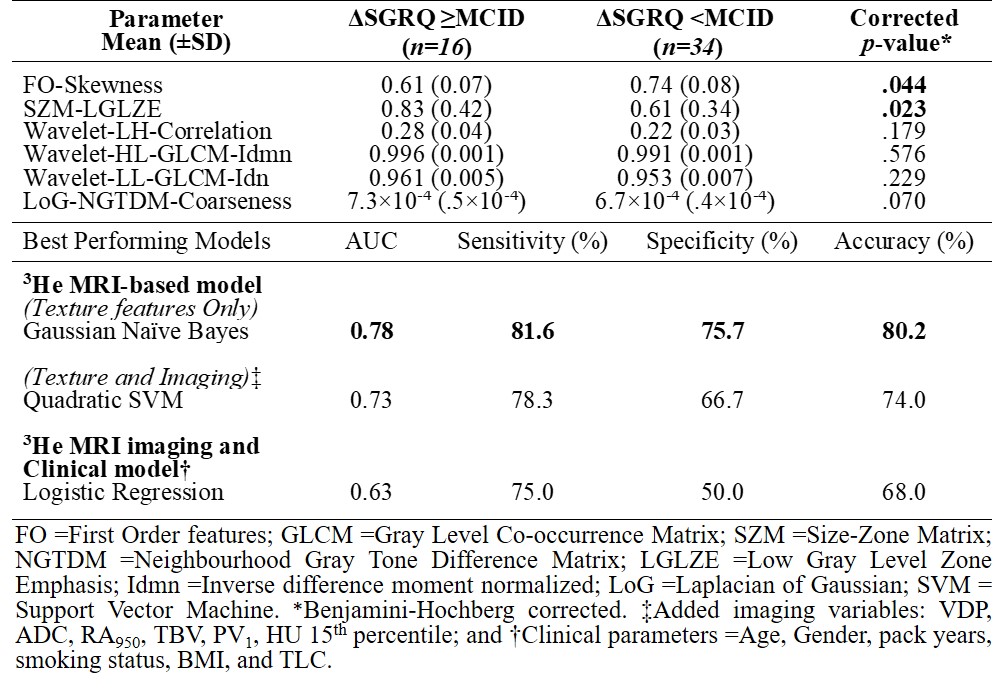
Table 2. Feature selection results from PCA and Boruta Analysis with corresponding classification accuracies using various parameter combinations for predicting worsening quality-of-life.
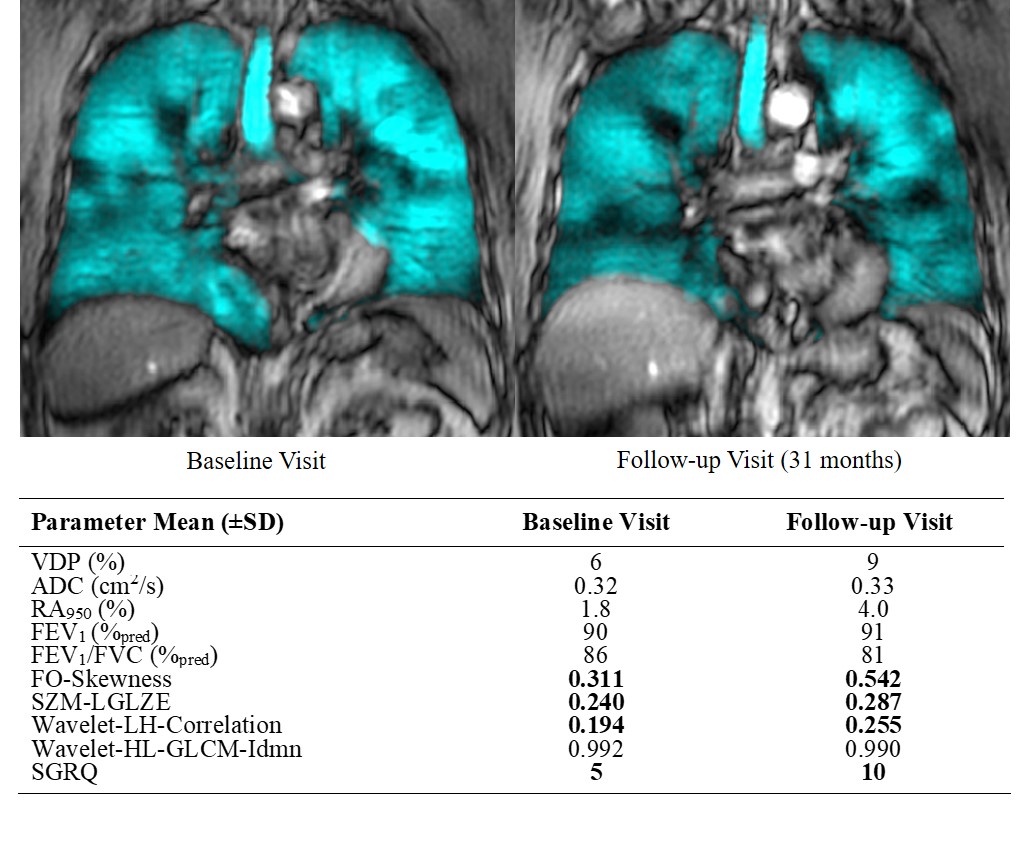
Figure 1. Baseline and 31-month follow-up visit 3He MRI ventilation images with associated texture and imaging measurements of a 67-year-old male ex-smoker participant without a COPD diagnosis, with 16 pack years and rapid quality-of-life worsening, with no abnormalities in standard imaging and clinical measurements. FO=First-order; SZM=Size-Zone Matrix; LGLZE =Low Gray Level Zone Emphasis; LH=low-high pass; HL=High-low pass; GLCM=Gray Level Co-occurrence Matrix. Idmn=Inverse difference moment normalized.
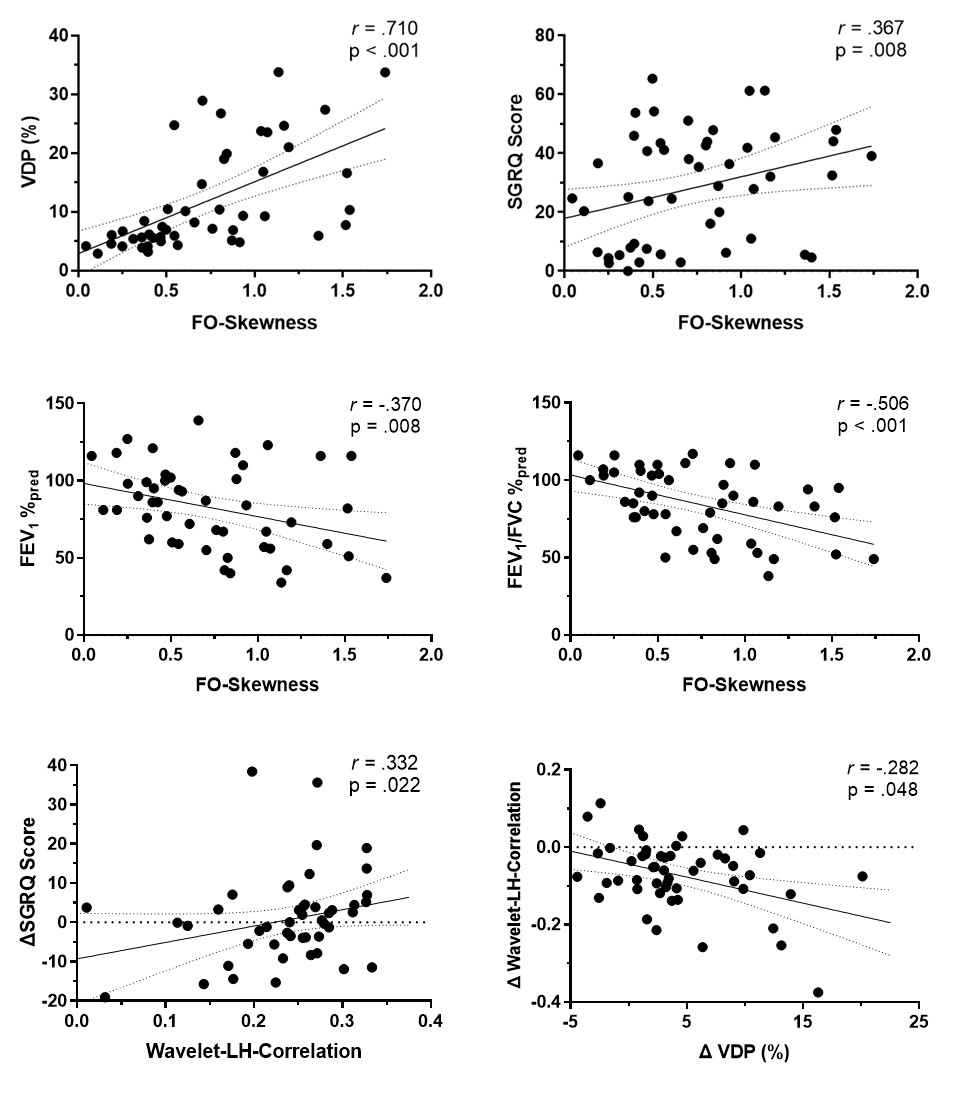
Figure 2. Spearman correlations of a sample texture feature predictor with clinical parameters and longitudinal quality-of-life worsening. Changes in texture feature correlated with change in VDP at follow-up.