3571
Mapping Pyruvate-to-Lactate Rate Constants in Hyperpolarized Data with bSSFP Acquisitions1Radiology, University of California, San Francisco, San Francisco, CA, United States, 2UC Berkeley - UCSF Graduate Program in Bioengineering, Berkeley, CA, United States, 3HeartVista, Los Altos, CA, United States
Synopsis
Using a metabolite-specific bSSFP sequence for hyperpolarized [1-13C]pyruvate MRI has been shown to increase SNR significantly, yet specialized kPL methods have not been developed for this sequence. A kPL fitting method for bSSFP lactate acquisition was developed and voxel-wise kPL fitting was performed on four renal cell carcinoma subjects. The kPL values and maps were compared to and showed agreement with lactate over pyruvate AUC ratio maps and spoiled gradient echo kPL values and maps.
Introduction
Hyperpolarized (HP) [1-13C]pyruvate MRI has shown promise for in vivo characterization and stratification of cancer. In renal cell carcinoma (RCC), a relationship between increased cancer aggressiveness and pyruvate-to-lactate conversion has been shown.1,2 Therefore, it is crucial to quantify pyruvate-to-lactate conversion from dynamic pyruvate and lactate images.A direct method for quantification is to compute the lactate over pyruvate area-under-the-curve (AUC) ratio. However, this technique does not take into account relaxation rates, acquisition timings or B1 variations. Instead a pharmacokinetic model can be fit to discern a pyruvate-to-lactate rate constant, kPL. This method has been demonstrated using a one-compartment model for data acquired with a spoiled gradient echo (GRE) sequence.3
A frequency-specific balanced steady state free precession (bSSFP) lactate acquisition method has been proposed for HP C-13 MRI.4 The authors showed that using a bSSFP sequence increases lactate SNR 2.5-fold. To take advantage of this sequence, quantification methods for bSSFP data must be developed. Previously used kPL fitting methods cannot be used for bSSFP due to the inherent differences between GRE and bSSFP acquisitions, including T2 weighting and flip angle. In this work, a bSSFP model to use for kPL fitting was developed. Voxel-wise kPL maps were generated for RCC patient data and compared to AUC ratio maps and GRE kPL maps using the previously proposed kPL fitting method.3
Methods
The bSSFP lactate acquisition was modelled using the Bloch equations as a sequence of excitation followed by relaxation/metabolic conversion. Excitation was modelled with rotation matrices and, relaxation and metabolic conversion was modelled by the following differential equations:$$P_z'(t) = -R_{1P} P_z(t) - k_{PL} P_z(t) + u(t) $$
$$L_z'(t) = -R_{1L} L_z(t) + k_{PL} P_z(t)$$
where R1P and R1L are the reciprocals of pyruvate and lactate T1, Pz and Lz are the longitudinal magnetizations of pyruvate and lactate, and u(t) is the estimated input from pyruvate. Metabolic conversion was only considered across the longitudinal components.
The initial pyruvate and lactate magnetizations were estimated for a set of kPL values. The kPL that minimized the squared distance between the measured and modelled data was reported. The pyruvate T1, lactate T1 and lactate T2 were fixed to physiologic values: 45s, 45s and 1s, respectively.5,6 Flip angles were adjusted using B1 maps. HP C-13 data from four RCC patients acquired with a frequency-specific lactate bSSFP sequence were used. The first three subjects also had corresponding GRE acquisitions from the same day. The kPL and AUC ratio maps were computed within the kidney ROI.
Results
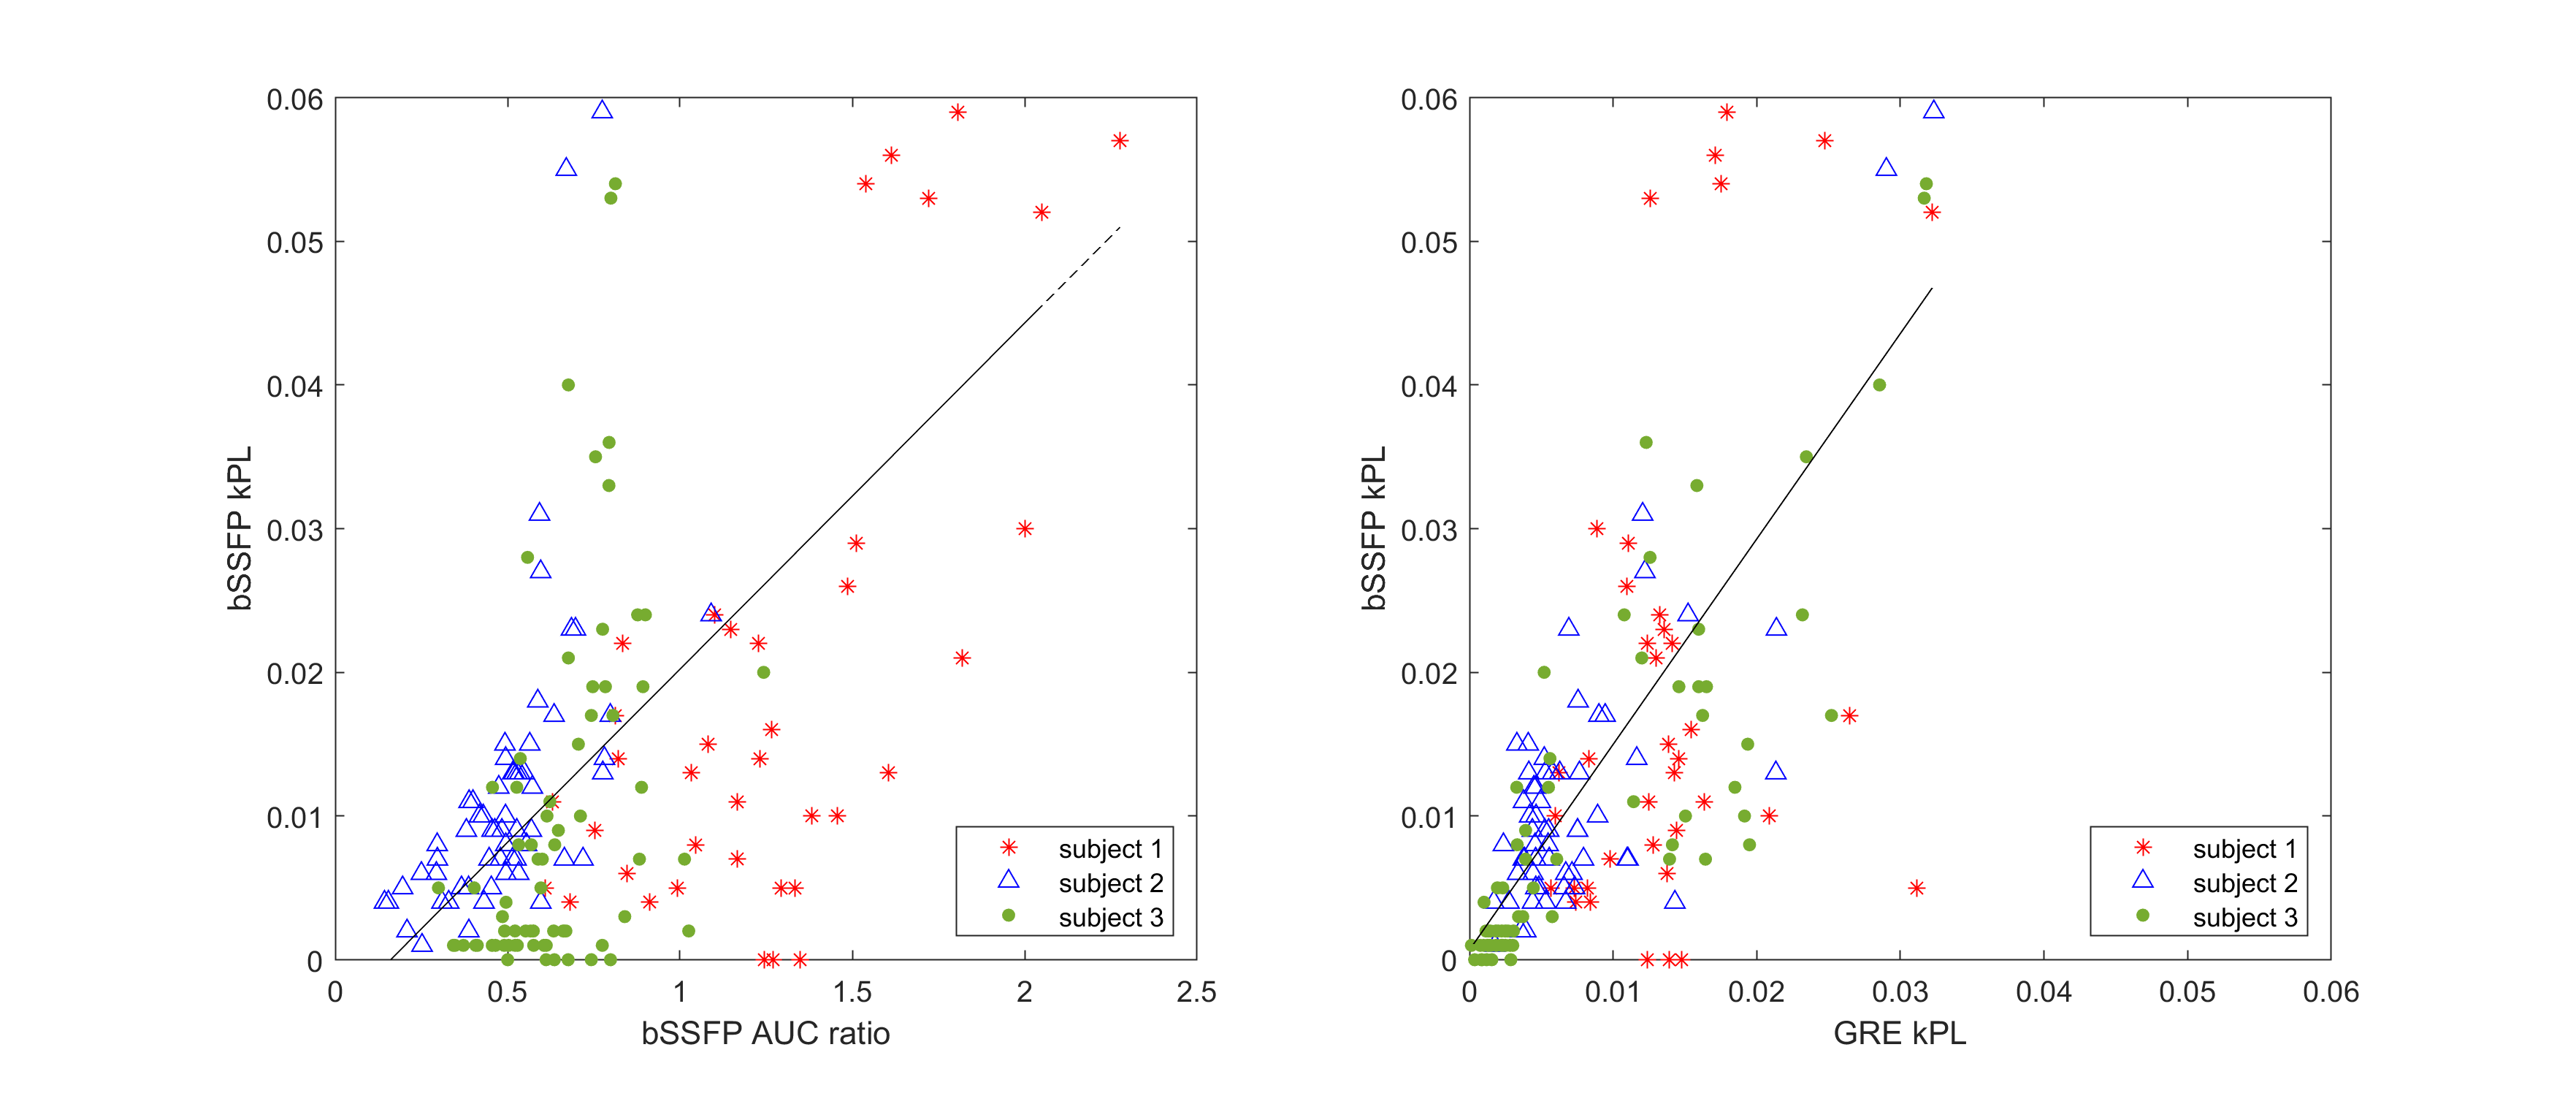
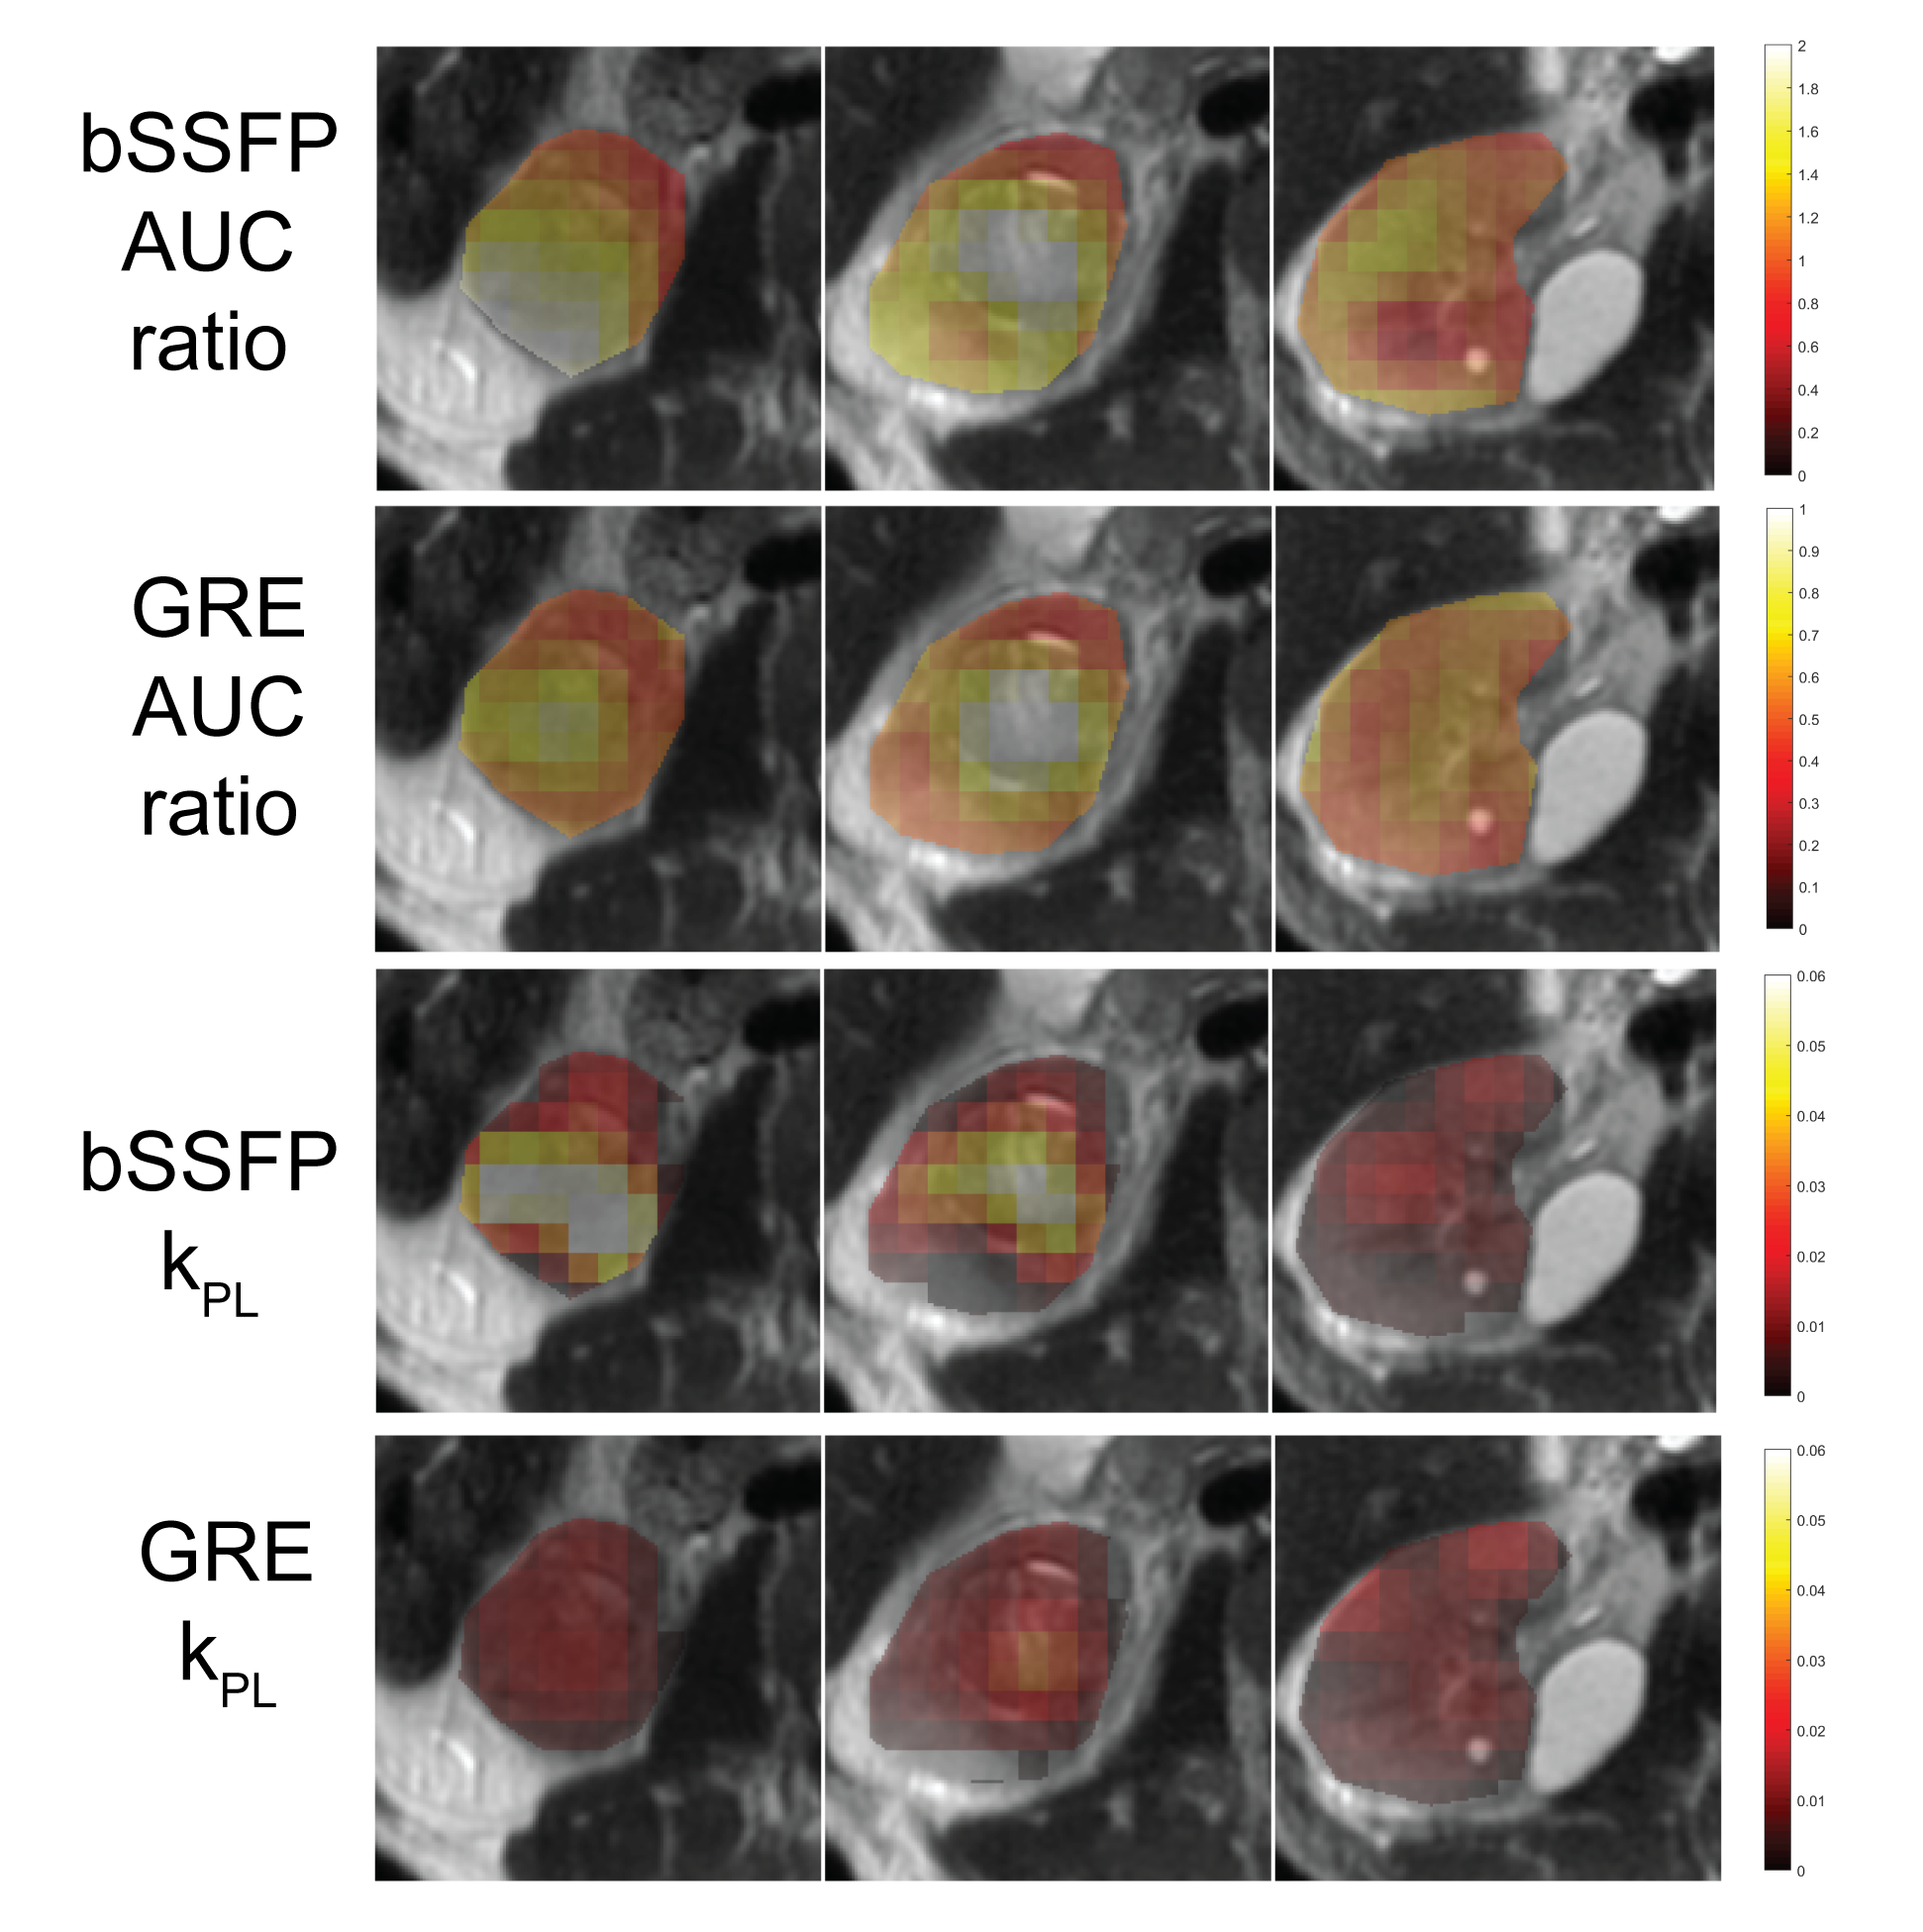
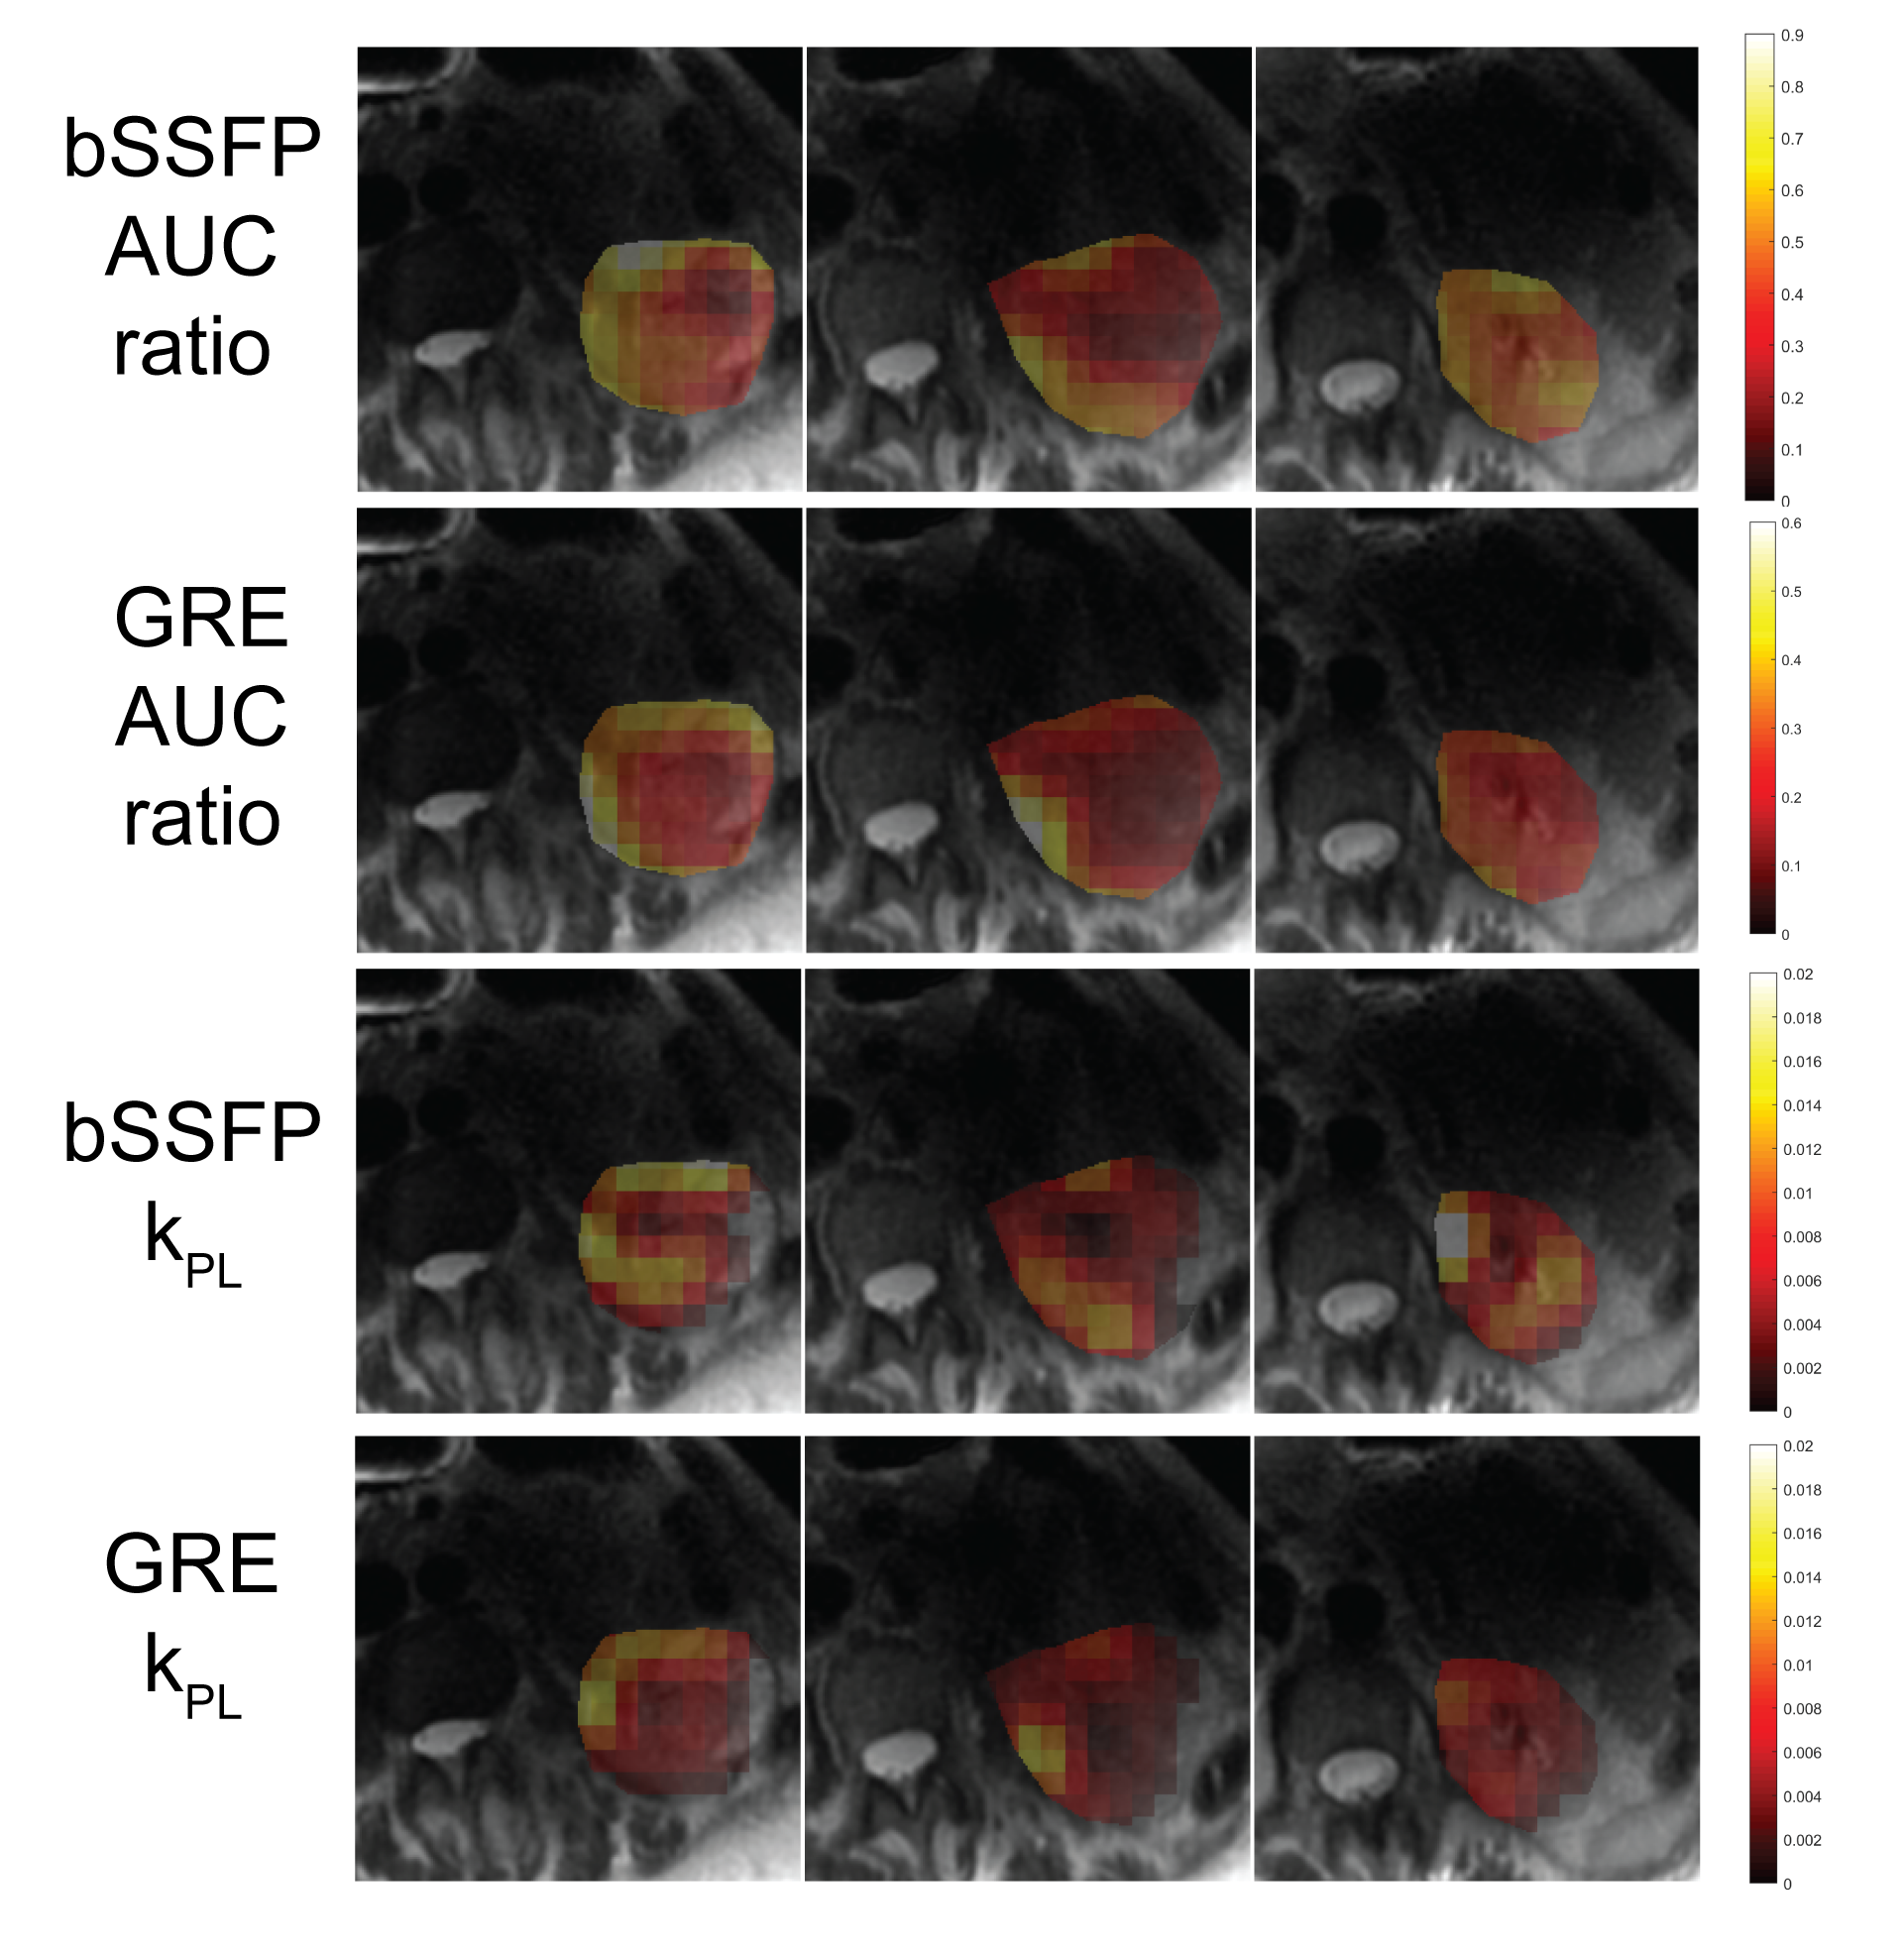
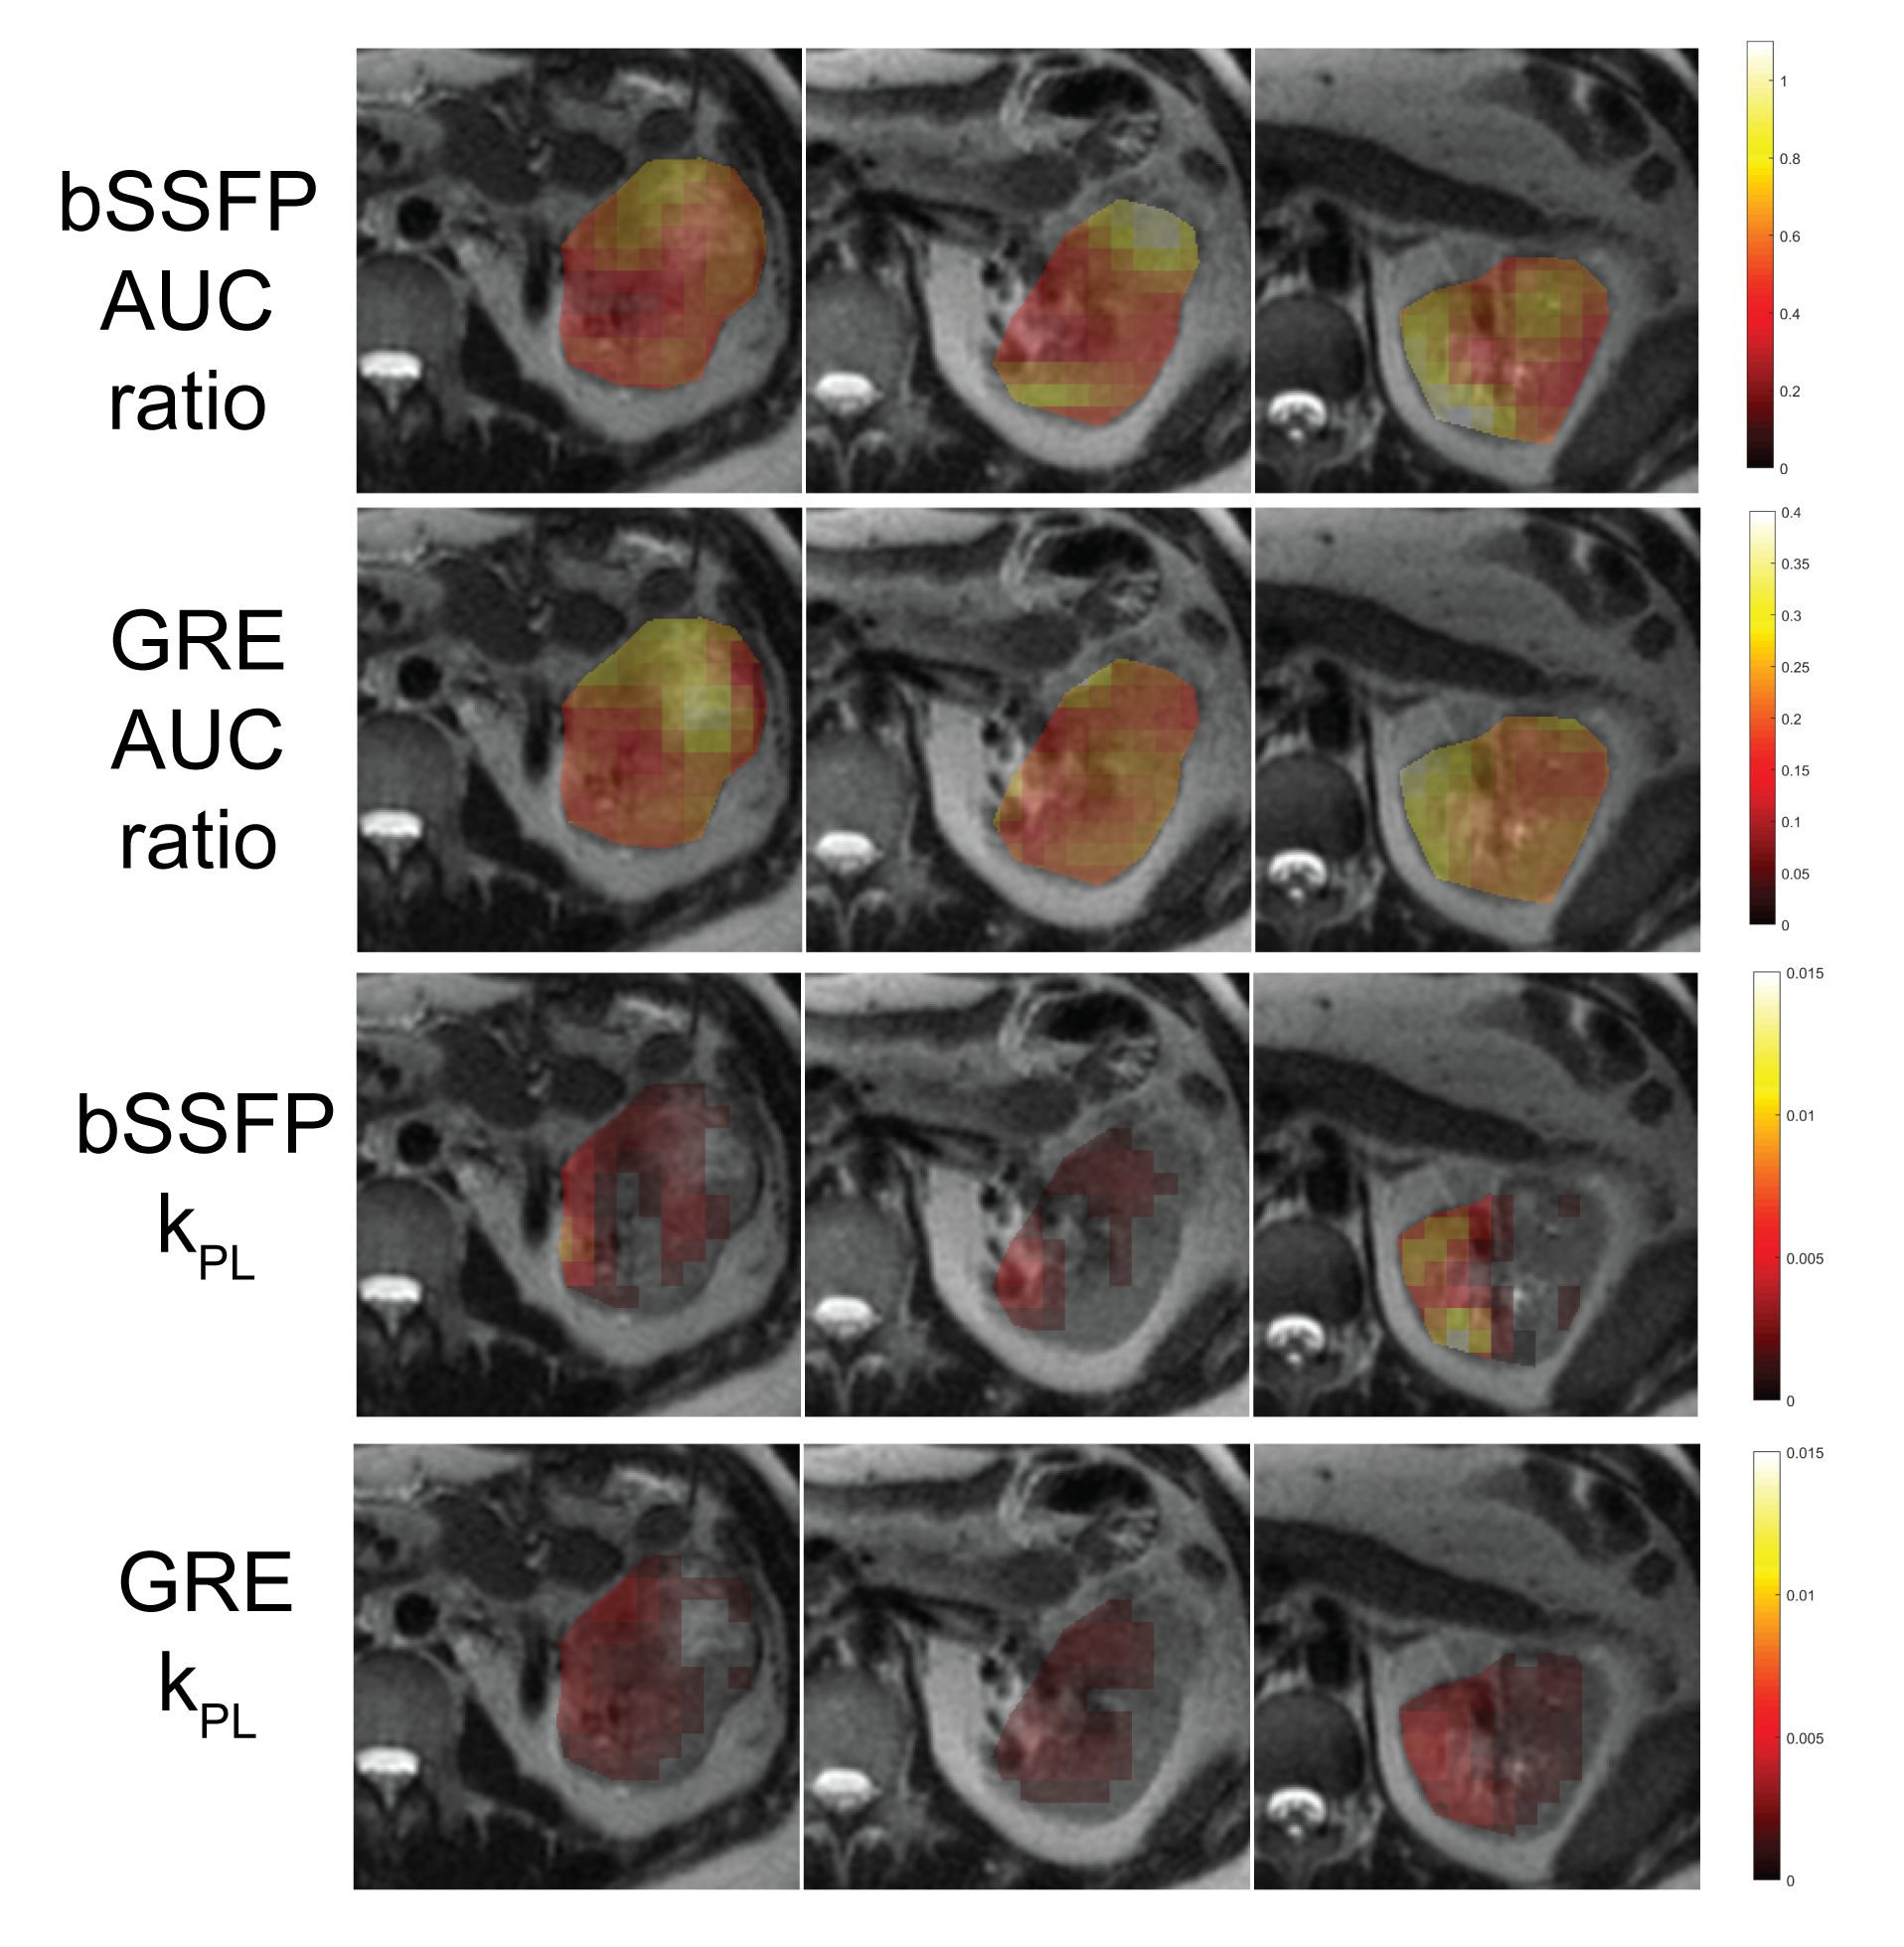
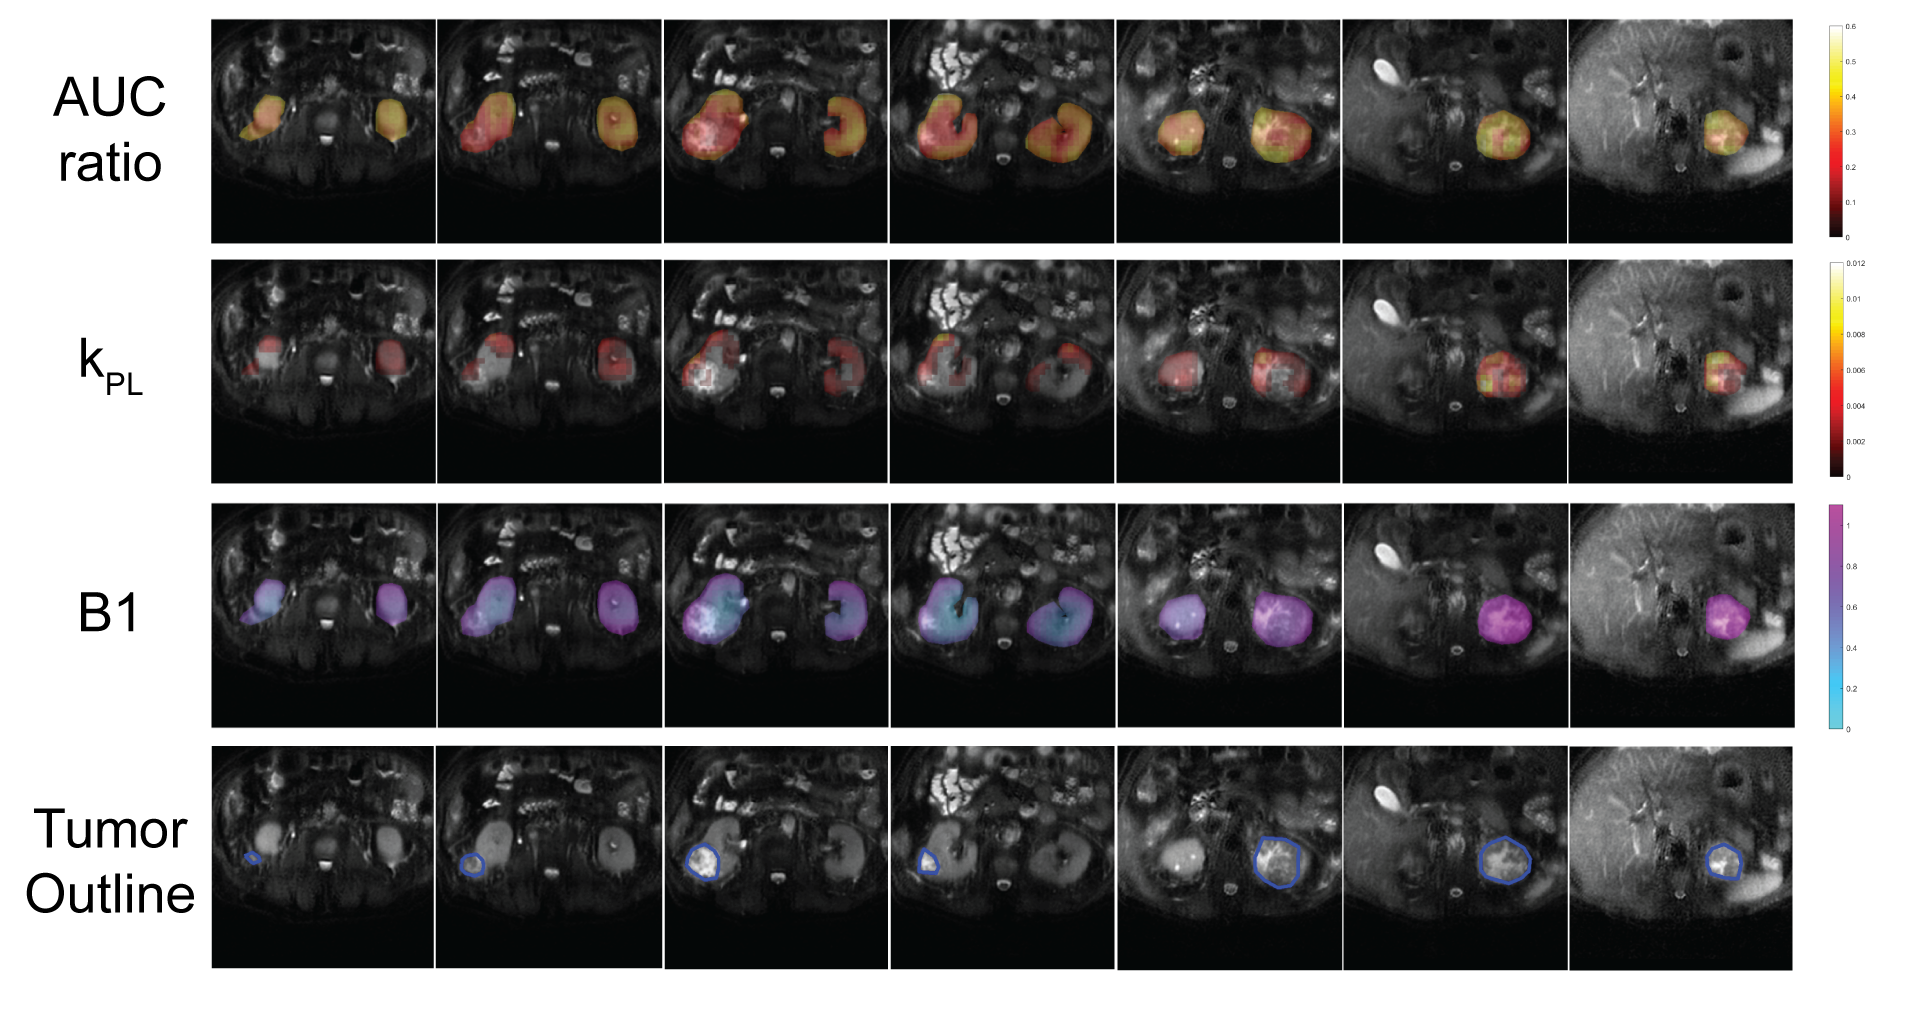
Voxel-wise correlation plots for the first three subjects were created (Figure 1). The first plot compared bSSFP AUC ratio with the bSSFP kPL. The computed line-of-best-fit had an R-squared of 0.309. The second plot computed the correlation between the kPL fit on the GRE data with the bSSFP kPL. This line-of-best-fit had an R-squared of 0.405 and slope of 1.43. Notably, the range of bSSFP and GRE kPLs were similar across the subjects.The bSSFP kPL, GRE kPL, bSSFP AUC ratio and GRE AUC ratio maps were also displayed for the three subjects (Figures 2,3,4). The bSSFP kPL and GRE kPL show similar contrasts across the subjects. The bSSFP kPL, bSSFP AUC ratio and B1 map of a fourth case with bilateral RCC was also displayed (Figure 5).
Discussion and Conclusion
The correlation plot (Figure 1) and kPL maps of the first three subjects (Figures 2,3,4) suggest the bSSFP kPL fitting is working as intended. We expect a positive linear relationship between the AUC ratio and kPL which is shown in figure 1.3 A slope of 1.43 was reported between the GRE kPL and bSSFP kPL. The deviation of the slope from 1 can be explained due to the choice of T1 and T2. The bSSFP model is sensitive to T1 and T2. In future work, this effect of T1 and T2 will be investigated.Interestingly, the AUC ratios are different across the three subjects. This can be seen in figure 1. This difference can be accounted to varied acquisition timings or B1 variations. In contrast, the kPL values are similar between the three subjects. The bSSFP model takes into account these differences in acquisition parameters and B1.
In subject 4, the kPL map is constant across the kidneys while the AUC ratio and B1 varies between the two kidneys (Figure 5). The AUC ratio is affected by B1 changes whereas the kPL corrects for the B1 and therefore, presents a more uniform metabolic contrast.
In this work, a kPL fitting model for bSSFP-acquired HP data was developed and validated voxel-wise on RCC patients. We have shown there may be advantages to using kPL because it accounts for changes in B1 and data acquisition timings.
Acknowledgements
This work was supported by NIH Grants P41EB013598, R21DK130002, R01CA249909 and American Cancer Society Grant RSG‐18‐005‐01‐CCE. ND would like to thank the American Heart Association and the Quantitative Biosciences Institute at UCSF as funding sources of this work. ND is supported by a Postdoctoral Fellowship of the American Heart Association.References
1. Shuyu Tang, Maxwell V. Meng, James B. Slater, Jeremy W. Gordon, Daniel B. Vigneron, Bradley A. Stohr, Peder E. Z. Larson, and Zhen Jane Wang. Metabolic imaging with hyperpolarized 13Cpyruvate magnetic resonance imaging in patients with renal tumors—Initial experience. Cancer, 2021.
2. Kayvan R. Keshari, Renuka Sriram, Bertram L. Koelsch, Mark Van Criekinge, David M. Wilson, John Kurhanewicz, and Zhen J. Wang. Hyperpolarized 13C-pyruvate magnetic resonance reveals rapid lactate export in metastatic renal cell carcinomas. Cancer Research, 73(2):529–538, 2013.
3. Peder E.Z. Larson, Hsin Yu Chen, Jeremy W. Gordon, Natalie Korn, John Maidens, Murat Arcak, Shuyu Tang, Mark Criekinge, Lucas Carvajal, Daniele Mammoli, Robert Bok, Rahul Aggarwal, Marcus Ferrone, James B. Slater, Sarah J. Nelson, John Kurhanewicz, and Daniel B. Vigneron. Investigation of analysis methods for hyperpolarized 13C-pyruvate metabolic MRI in prostate cancer patients. NMR in Biomedicine, 31(11), 2018.
4. Shuyu Tang, Robert Bok, Hecong Qin, Galen Reed, Mark VanCriekinge, Romelyn Delos Santos, William Overall, Juan Santos, Jeremy Gordon, Zhen Jane Wang, Daniel B. Vigneron, and Peder E. Z. Larson. A metabolite-specific 3D stack-of-spiral bSSFP sequence for improved lactate imaging in hyperpolarized [1- 13C]pyruvate studies on a 3T clinical scanner. Magnetic Resonance in Medicine, 84(3):1113–1125, 2020.
5. Naeim Bahrami, Christine Leon Swisher, Cornelius Von Morze, Daniel B Vigneron, and Peder E Z Larson. Kinetic and perfusion modeling of hyperpolarized (13)C pyruvate and urea in cancer with arbitrary RF flip angles. Quantitative imaging in medicine and surgery, 4(1):24–32, 2014.
6. Yi Fen Yen, Patrick Le Roux, Dirk Mayer, Randy King, Daniel Spielman, James Tropp, Kim Butts Pauly, Adolf Pfefferbaum, Shreyas Vasanawala, and Ralph Hurd. T2 relaxation times of 13C metabolites in a rat hepatocellular carcinoma model measured in vivo using 13C-MRS of hyperpolarized [113C]pyruvate. NMR in Biomedicine, 23(4):414–423, 2010.
Figures