3569
Quantitative Evaluation of Pyruvate Uptake and Metabolism in Cells using Mass Spectrometry and Hyperpolarized 13C NMR1The University of Texas MD Anderson Cancer Center UTHealth Graduate School of Biomedical Sciences, Houston, TX, United States, 2Department of Imaging Physics, The University of Texas MD Anderson Cancer Center, Houston, TX, United States, 3Department of Radiation Physics, The University of Texas MD Anderson Cancer Center, Houston, TX, United States, 4Department of Head and Neck Surgery, The University of Texas MD Anderson Cancer Center, Houston, TX, United States, 5Department of Bioinformatics and Computational Biology and The Proteomics and Metabolomics Core Facility, The University of Texas MD Anderson Cancer Center, Houston, TX, United States, 6Department of Biochemistry and Molecular Biology, University of Florida, Gainesville, FL, United States, 7Department of Otolaryngology-Head and Neck Surgery, Baylor College of Medicine, Houston, TX, United States, 8Department of Radiation Oncology, The University of Texas MD Anderson Cancer Center, Houston, TX, United States, 9Department of Molecular and Cellular Oncology, The University of Texas MD Anderson Cancer Center, Houston, TX, United States
Synopsis
Metabolic imaging of hyperpolarized pyruvate can provide new insight into cancer progression and therapeutic response. Pharmacokinetic modeling can be used to determine kPL, the apparent rate constant for conversion of hyperpolarized pyruvate into lactate. Quantitative evaluation of signal evolution in vivo can be challenging due to nonstationary signal and multiple barriers between the intravascular precursor and its intracellular conversion into lactate. In this work, we evaluated intracellular kPL using suspensions of anaplastic thyroid cancer and prostate cancer cells. A pharmacokinetic model with two physical compartments and two chemical pools was utilized for quantitative analysis.
Introduction
Metabolic imaging of the conversion of hyperpolarized (HP) [1-13C]-pyruvate into lactate has demonstrated strong clinical potential for characterization of tumor metabolism and response to therapy1-5. Pharmacokinetic (PK) modeling and analysis6 can be used to determine kPL, the apparent rate constant for conversion of HP pyruvate into lactate. However, further validation is needed to demonstrate the potential of this metabolic imaging biomarker to guide clinical care. HP pyruvate is administered by intravenous injection and must extravasate from vasculature and cross the cell membrane before interacting with intracellular enzymes that mediate chemical conversion to lactate. Due to the difficulty distinguishing between signals arising from intravascular, extracellular/extravascular, and intracellular compartments, simplified precursor-product models are often used to analyze HP MRI data; however, these models can be biased by changes in vascular function or membrane transport, and generally under-estimate the true intracellular chemical conversion rate. Improved understanding of the intracellular conversion rate could lead to more robust analyses of clinical and in vivo HP MRI data. Therefore, we sought to characterize intracellular kPL in an intuitive closed model system involving cancer cell suspensions.Methods
HP NMR: HP [1-13C]-pyruvate was prepared using a HyperSense dissolution dynamic nuclear polarization system (Oxford Instruments, Abingdon, UK) as previously described7, and all NMR experiments were conducted using a Spectrospin DPX-300 NMR spectrometer equipped with a broadband 10 mm NMR probe (Bruker, Billerica, MA, USA). Approximately 1×10⁷ cells (Hth-83 anaplastic thyroid cancer; LNCap and PC3 prostate cancer) were suspended in 900 μL of cell media and added to a 10 mm Shigemi tube, along with 100 μL of D2O. Approximately 181 µL of 20 mM HP [1-13C]-pyruvate was delivered to cell samples in the NMR, resulting in a final HP pyruvate concentration of approximately 3.07 mM/L8. A pulse-acquire sequence with a 10° excitation angle and a 2 s repetition time was used to acquire dynamic 13C spectra.Ion Chromatography Mass Spectrometry: A secondary method for assessing uptake and conversion of pyruvate was carried out using IC-MS following exposure to [U-13C3]-pyruvate in media. Cells were expanded and cultured in standard R10 media. At the start of each measurement, the media was discarded and cells were exposed to fresh R10 media that contained 1.0 mM of [U-13C3]-pyruvate. Plates of cells were subjected to U-Pyr exposure times of 0, 5, 15, 30, 45, and 60 s. Following U-Pyr exposure, cells were washed with ice-cold buffer, frozen with liquid N2, and prepared for targeted tracer analysis using an Orbitrap Fusion Tribrid mass spectrometer (Thermo Fisher Scientific, San Jose, CA, USA).
Pharmacokinetic Modeling: A closed PK model with two physical compartments (intracellular, extracellular) and two chemical pools (pyruvate, lactate)6 was used to analyze HP NMR and IC-MS data. The following differential equations relate exchange between pyruvate and lactate in extracellular media (e) and within cells (ic):
$$\frac{\partial Pyr_{e}(t)}{\partial t}=\frac{k_{ecp}}{v_{e}}Pyr_{ic}(t)-(\frac{k_{ecp}}{v_{e}}+R_{Pyr})Pyr_{e}(t)$$
$$\frac{\partial Lac_{e}(t)}{\partial t}=\frac{k_{ecl}}{v_{e}}Lac_{ic}(t)-(\frac{k_{ecl}}{v_{e}}+R_{Lac})Lac_{e}(t)$$
$$\frac{\partial Pyr_{ic}(t)}{\partial t}=k_{LP}Lac_{ic}(t)+\frac{k_{ecp}}{v_{ic}}Pyr_{e}(t)-(k_{PL}+\frac{k_{ecp}}{v_{ic}}+R_{Pyr}+k_{PX})Pyr_{ic}(t)$$
$$\frac{\partial Lac_{ic}(t)}{\partial t}=k_{PL}Pyr_{ic}(t)+\frac{k_{ecl}}{v_{ic}}Lac_{e}(t)-(k_{LP}+\frac{k_{ecl}}{v_{ic}}+R_{Lac}+k_{LX})Lac_{ic}(t)$$
Here, kecp and kecl represent the transport of pyruvate and lactate across the cell membrane. ve denotes the extracellular volume fraction and vic denotes the intracellular volume fraction. The apparent rate constant for chemical conversion of HP pyruvate to lactate is given by kPL, and the reverse reaction rate is given by kLP. RPyr and RLac denote losses due to T1 relaxation, when appropriate for analyzing NMR data, and kPX and kLX represent conversion of pyruvate and lactate to chemical endpoints outside of the model (for IC-MS data). Excitation losses were modeled as instantaneous following each excitation, and the total observed pyruvate and lactate signals were calculated as the sum of compartmental signals weighted by their respective volume fractions. To assess the uniqueness of the solutions, nuisance variables were fit to the data while kPL was varied across a supraphysiological range of values.
Results
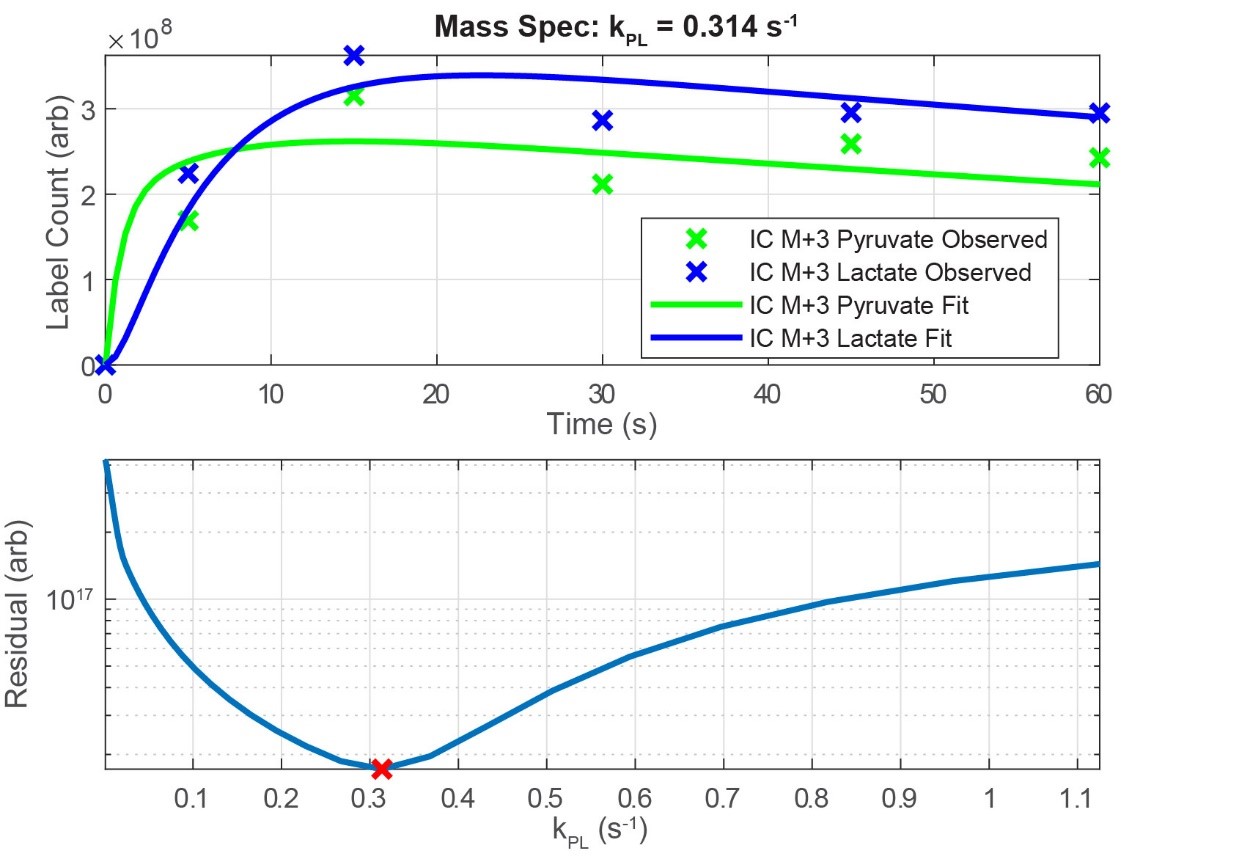
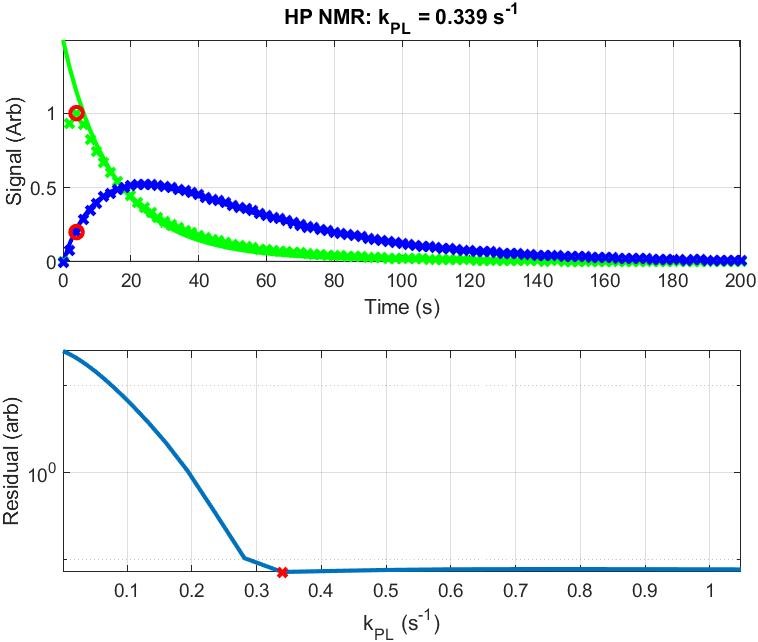
IC-MS data revealed surprisingly rapid uptake and conversion of M+3 labeled pyruvate, which was reproducible across replicates and cell lines. Representative data in Figure 1 shows mass labels in intracellular pyruvate and lactate at ~70% of their equilibrium value after only 5 s exposure to 1 mM [U-13C3]-pyruvate in normal media. Analysis of HP NMR data shows a range of virtually equivalent solutions beginning at a threshold kPL value (Figure 2); above this point, nuisance variables (and kLP in particular) counteract effects of higher kPL values to yield indistinguishable signal curves. Both modalities indicate intracellular kPL > 0.3 s-1 for Hth-83 cells.Discussion and Conclusion
PK analysis of HP NMR and IC-MS data shows good agreement in the apparent rate constant for intracellular conversion of HP [1-13C]-pyruvate and [U-13C3]-pyruvate into lactate. The values for kPL observed in this study are higher than those observed using traditional precursor-product models because conversion is only permitted within the intracellular volume fraction, which was carefully estimated by counting cells and measuring average cell diameter. More accurate understanding of intracellular kPL will enhance our ability to characterize changes in HP MRI signal evolution in vivo.Acknowledgements
This work was supported by funding from the National Cancer Institute (R01CA211150) and the National Institute of Diabetes and Digestive and Kidney Diseases (R01DK105346) of the National Institutes of Health, and the Cancer Prevention and Research Institute of Texas (RP170366). The content is solely the responsibility of the authors and does not necessarily represent the official views of the sponsors.References
1. Kurhanewicz J, Vigneron DB, Ardenkjaer-Larsen JH, et al. Hyperpolarized (13)C MRI: Path to Clinical Translation in Oncology. Neoplasia. 2019;21(1):1-16.
2. Kurhanewicz J, Vigneron DB, Brindle K, et al. Analysis of cancer metabolism by imaging hyperpolarized nuclei: prospects for translation to clinical research. Neoplasia. 2011;13(2):81-97.
3. Nelson SJ, Kurhanewicz J, Vigneron DB, et al. Metabolic imaging of patients with prostate cancer using hyperpolarized [1-(1)(3)C]pyruvate. Sci Transl Med. 2013;5(198):198ra108.
4. Aggarwal R, Vigneron DB, Kurhanewicz J. Hyperpolarized 1-[(13)C]-Pyruvate Magnetic Resonance Imaging Detects an Early Metabolic Response to Androgen Ablation Therapy in Prostate Cancer. Eur Urol. 2017;72(6):1028-1029.
5. Woitek R, McLean MA, Gill AB, et al. Hyperpolarized (13)C MRI of Tumor Metabolism Demonstrates Early Metabolic Response to Neoadjuvant Chemotherapy in Breast Cancer. Radiol Imaging Cancer. 2020;2(4):e200017.
6. Bankson JA, Walker CM, Ramirez MS, et al. Kinetic Modeling and Constrained Reconstruction of Hyperpolarized [1-13C]-Pyruvate Offers Improved Metabolic Imaging of Tumors. Cancer Res. 2015;75(22):4708-4717.
7. Lee, J., Ramirez, M. S., Walker, C. M., Chen, Y., Yi, S., Sandulache, V. C. et al. High-throughput hyperpolarized (13)C metabolic investigations using a multi-channel acquisition system. J. Magn. Reson. 260, 20–27 (2015).
8. Chen, Y., Maniakas, A., Tan, L. et al. Development of a rational strategy for integration of lactate dehydrogenase A suppression into therapeutic algorithms for head and neck cancer. Br J Cancer 124, 1670–1679 (2021).
Figures