3562
Frequency Drift of "Cold" Scanner at 3T -- its Implication in MR Spectroscopy1School of Health Sciences, Purdue University, West Lafayette, IN, United States, 2Department of Radiology and Imaging Sciences, Indiana University School of Medicine, Indianapolis, IN, United States, 3Imaging institute, Cleveland Clinic, Cleveland, OH, United States
Synopsis
Frequency drift from EPI-based sequences prior to MRS scans is a known issue. Running MRS scans ‘from cold’ is suggested for the greatest scanner stability, with some equilibration period for systems with overnight energy-saving mode. Running MRS scans before scanner reaches an equilibration period can result in large frequency drifts. Under these conditions, the effect of running fMRI scans seem to be negligible. Applying frequency and phase correction can make the final spectrum appear to be qualitatively similar between scans with big and negligible drift.
Introduction
Potential detrimental effects of frequency drift resulting from heat generated due to rapidly switching gradients during EPI-based sequences prior to MRS scans is a known issue. A multi-site study involving 99 MRI scanners from 3 major manufacturers showed moderate to severe drift following fMRI scans in a small number of scanners. Running MRS scans or other B0 field sensitive sequences ‘from cold’ (the 1st scan of the day) is suggested for the greatest scanner stability, with some equilibration period to be allowed for systems in overnight energy-saving mode [1]. Harris et al [2] showed frequency drift in pre-fMRI MRS scans “from cold” of similar magnitude to that in post-fMRI. Another suggestion by Siemens is to wait at least for 30 minutes (60-90 minutes is better) in the morning until the frequency drift of the scanner reaches an equilibration for Siemens scanners with ECO (energy-saving) mode. We systematically studied (i) the effect of “cold” scanner frequency drifts, (ii) the effect of fMRI scans on such drifts and (iv) any potential effect on MR spectra on two 3T Siemens Prisma scanners at different centers.Methods
A water-based phantom was scanned with a 20-channel coil on two Siemens Prisma 3T scanners, (i) immediately after turning the scanner on, (ii) allowing for different equilibration periods and (iii) after the scanner has been left on overnight. Our protocol was similar to the protocol used in the multi-site study [1]. Non-water suppressed and water-suppressed PRESS data were acquired (TR/TE = 5000/35 ms; FA = 90°; 720 averages; voxel size = 2 × 2 × 2 cm3), before and after a BOLD-weighted 10-minute fMRI sequence (TR/TE = 3000/30 ms; 197 volumes; FOV = 217 x 217 mm2) as in Hui et al [1]. Raw data was processed with MATLAB (R2020a, MathWorks, Natick, USA). The unsuppressed water peak in each average was modeled to get the center frequency, the change of which over time was calculated in the same way as Hui et al [1]. The drift rate was also measured for each acquisition. In addition, (i) effect of idle time (in-lieu of fMRI scans) between 2 MRS scans and (ii) spectral quality with standard frequency- and phase-correction (MRspa) [3] obtained from MRS performed “from cold” and after equilibration were studied.Results
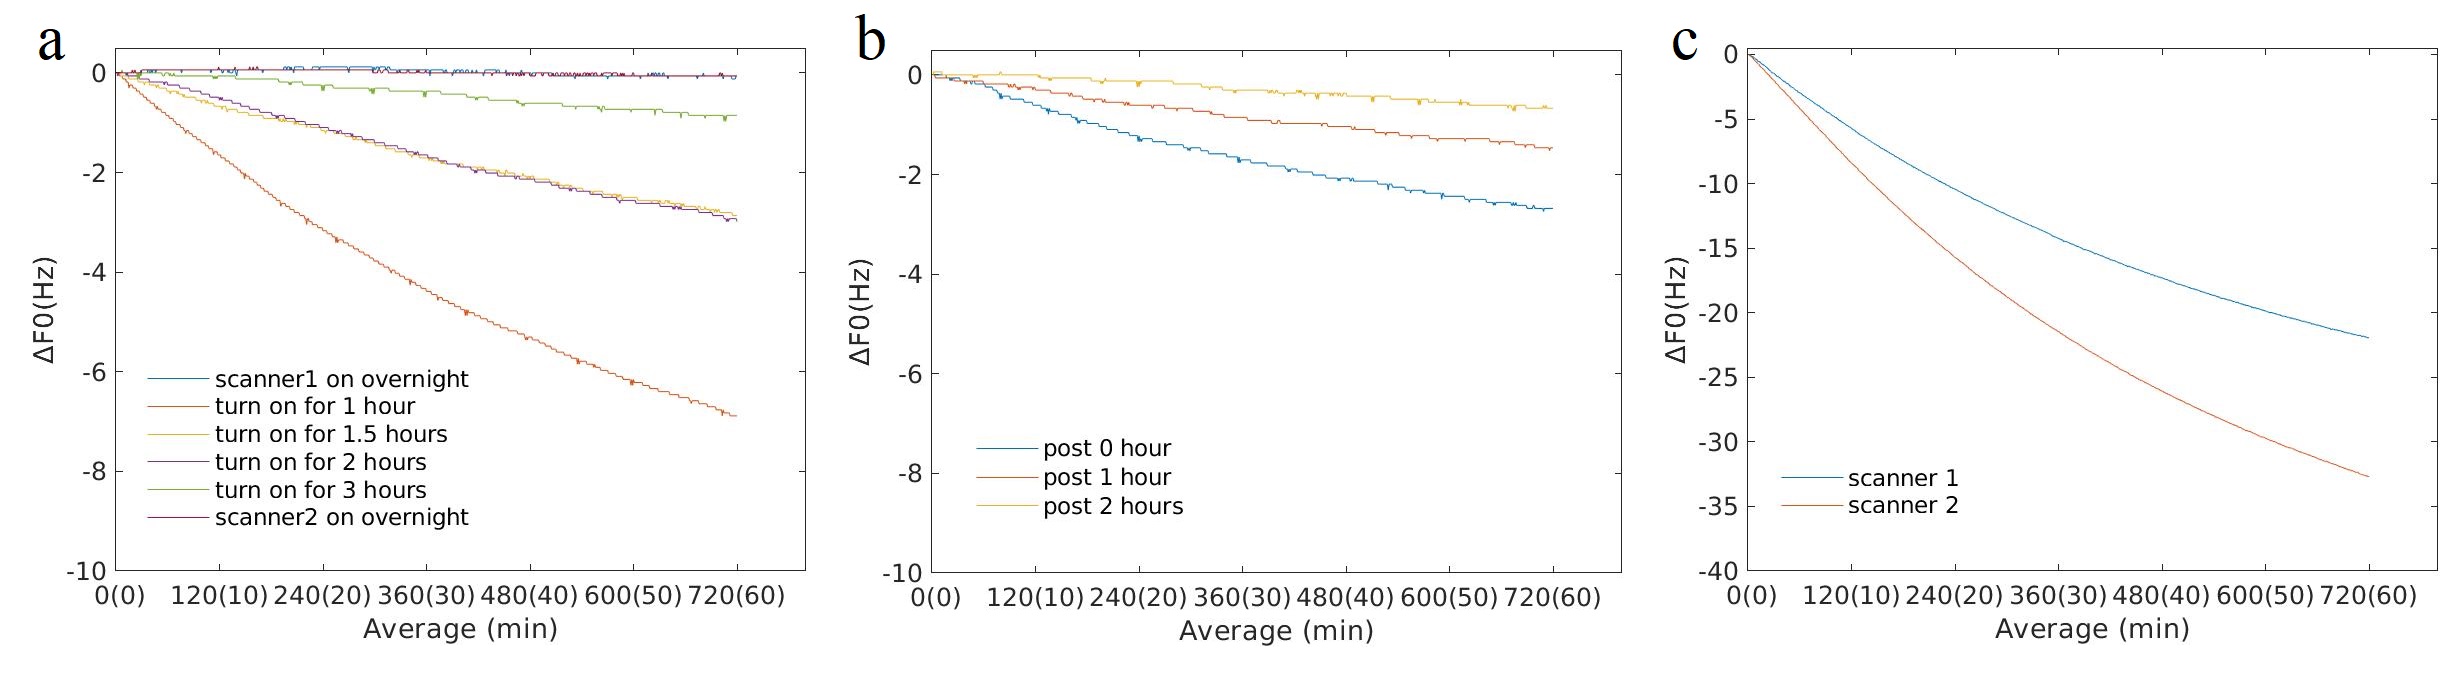
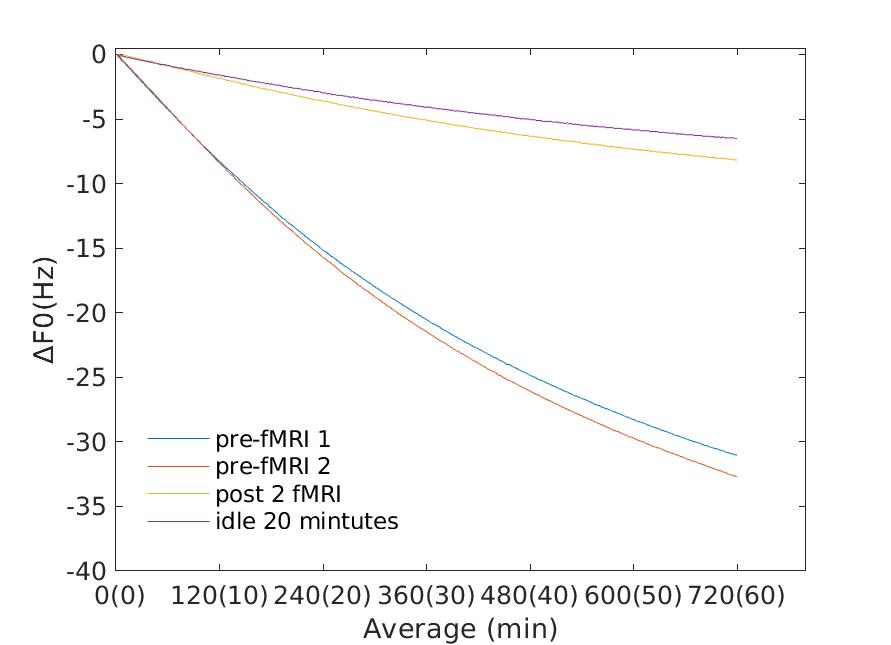
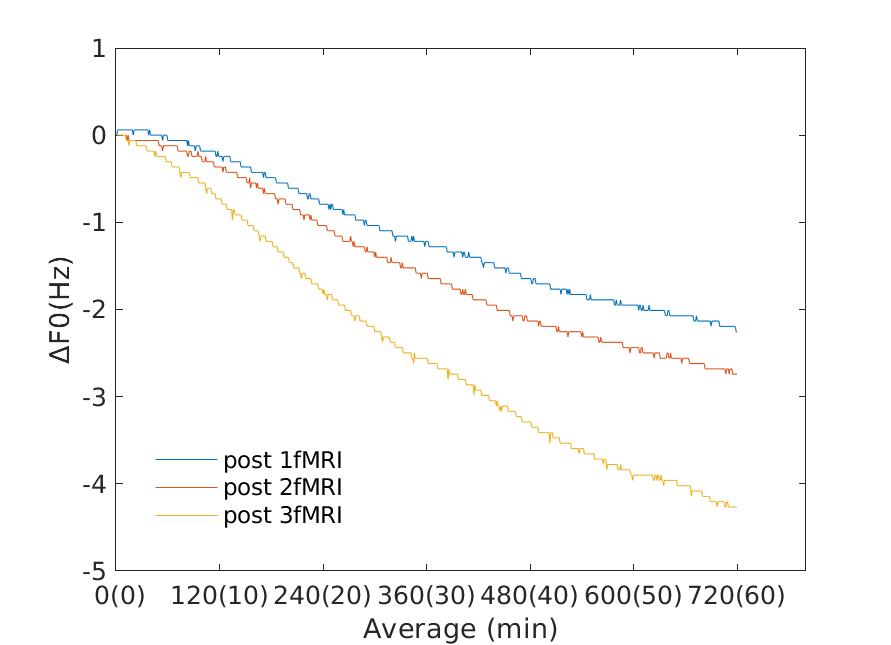
Pre-fMRI frequency drift traces from different days and at different time after switching the scanner on are shown in Fig.1a. Post-fMRI frequency drift traces from different days and at different time after one 10-minute fMRI scan are shown in Fig.1b. Scanners drifted by up to 6.9 Hz within 1 hour after starting up the scanner (Fig.1a) and by up to 2.7 Hz within 1 hour after a 10-minute fMRI scan. Drift rates were ≤0.085 Hz/min before and after fMRI. Average absolute frequency drift across 60 transients (~5 min) was ≤ 0.32 ±0.08 Hz and ≤ 0.21 ±0.09 Hz respectively before and after fMRI during 1 hour MRS scan. However, the frequency drift of a “cold” scanner could be much higher as shown in Fig.1c. The effect of leaving the scanner idle for 20 minutes compared with running 2 fMRI scans is shown in Fig.2. Frequency drift during post-fMRI MRS was 26% of that during pre-fMRI MRS with two fMRI scans and it was 20% with scanner idle for 20 minutes. Frequency drift traces (Fig.3) were also measured with increasing the number of fMRI scans to 2 and 3 on different days. Before this experiment (Fig.3), the scanner was undisturbed for longer than 3 hours or was turned on for 3 hours.Discussion
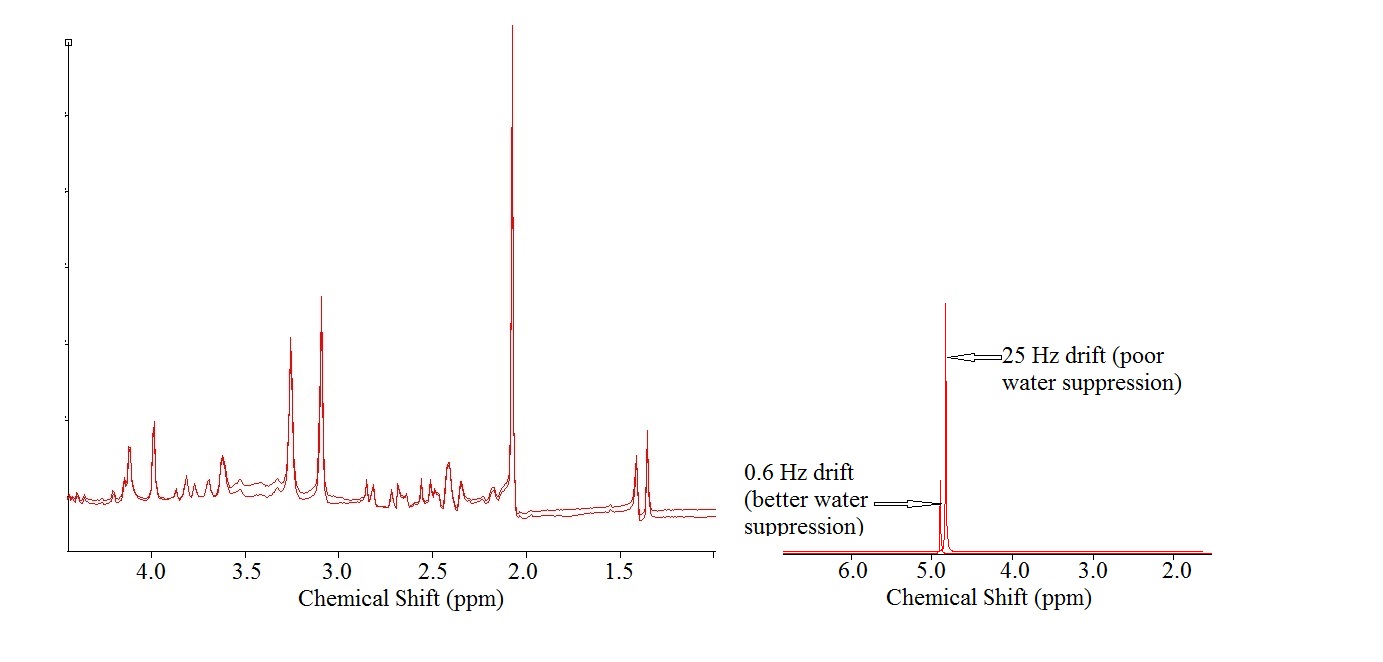
As can be seen from Fig.1, running MRS scans by not allowing for the scanner to reach its equilibration can result in large frequency drifts, which is expected to have several detrimental effects, e.g. poor water and lipid suppression, frequency selective pulse imperfection (problematic in J-difference editing), chemical shift displacement error, etc. Under these conditions, the effect of running fMRI scans seem to be negligible as leaving the scanner idle for 20 minutes between 2 MRS scans has a similar effect as running 2 10-minute-long fMRI scans between the 2 MRS scans (20% vs 26%). As seen from Fig. 4, applying standard cross-correlation based frequency correction and least-square based phase correction in MRspa [3], can make the final spectrum appear to be qualitatively similar between scans with as much as 25 Hz drift and negligible (0.6 HZ) drift. However, as expected, the scan with 25 Hz drift had ~4 times higher residual water signal due to poor water suppression. In the current study, both scanners showed less frequency drift for both pre-fMRI and post-fMRI than the corresponding drifts reported in the multisite study, even with increasing fMRI duration. The effect of fMRI up to 30 minutes caused less frequency drift compared to the “morning drift”. This shows that reaching an equilibration is more important than running an MRS scan after an fMRI scan to minimize drift effects.Conclusion
Running scans “from cold” prior to the scanner reaching equilibration is detrimental to MRS scans due to excessive frequency drift on Siemens Prisma Scanners. Under these circumstances running fMRI prior to MRS does not have any additional impact.Acknowledgements
No acknowledgement found.References
1. Hui S, Mikkelsen M, et al. Frequency Drift in MR Spectroscopy at 3T. NeuroImage. 2021, 241, 118430.
2. Harris A, Glaubitz B, et al. Impact of frequency drift on gamma-aminobutyric acid-edited MR spectroscopy. Magn. Reson. Med. 2014;72:941–948.
3. MRspa. Magnetic Resonance signal processing and analysis. 2015 Sep; https://www.cmrr.umn.edu/downloads/mrspa/
Figures