3558
Physics-based network fine-tuning for robust susceptibility mapping from high-pass filtered phase1Cornell University, New York, NY, United States, 2Weill Cornell Medicine, New York, NY, United States
Synopsis
A network fine-tuning step based on signal physics is proposed for deep learning based quantitative susceptibility mapping using high-pass filtered phase only to susceptibility. The proposed method showed better robustness compared to the pre-trained networks without fine-tuning when the test dataset deviated from the training dataset, such as a change in voxel size or high-pass filter cutoff frequency.
Introduction
Susceptibility-Weighted Imaging (SWI) [1] is an MRI method to visualize susceptibility sources such as veins, calcifications and hemorrhage. SWI is obtained from the high-pass filter phase (HPFP) of gradient-echo (GRE) data which are sensitive to tissue susceptibility differences. In contrast, Quantitative susceptibility mapping (QSM) [2] measures tissue susceptibility quantitatively by solving a dipole inversion problem starting from unfiltered complex GRE data. Recently, [3] used deep neural networks to predict QSM from HPFP data given the existing large amount of SWI HPFP data already acquired. In this study, we show that this method suffers inferior predictions when the test data properties deviate from those of the training data. Additionally, we show that incorporating the signal physics (thehigh-pass phase filtering and the dipole convolution) into the network using fine-tuning can overcome these limitations.Methods
MRI was performed on 30 patients with multiple sclerosis (MS) using a 3T Siemens scanner with a multi-echo 3D gradient echo (GRE) sequence. Imaging parameters included: FA=15°, FOV = 24.0 cm, TE1 = 6.3 ms, TR = 49 ms, #TE = 10, ΔTE = 4.1 ms, acquisition matrix = 260 × 320 × 48, voxel size = 0.75 × 0.75 × 3 mm3. Local tissue field was estimated using non-linear fitting across multi-echo phase data [4], followed by phase unwrapping and background field removal [5]. QSM was reconstructed using Morphology Enabled Dipole Inversion (MEDI) [6]. HPFP at echo time 20 ms was simulated from the reconstructed QSM by dipole convolution followed by k-space Gaussian high-pass filtering with cutoff frequency (FC) 5/8 of the largest in-plane matrix size (320). 20/2/8 of 30 patients were used as training/validation/test datasets to predict QSM from the simulated HPFP. MRI was also performed on 8 healthy volunteers with both single-echo (echo time = 20 ms) and multi-echo GRE using the same 3T Siemens scanner and imaging parameters. HPFP were computed from the scanner using single-echo GRE data directly. QSM was computed similar as in the patient data. This formed a second test set with prospective HPFP inputs and the corresponding QSM references.Two 3D UNets [7] were concatenated sequentially (denoted as U2Net ) as the network architecture to predict QSM from HPFP. 3D patches with patch size 64*64*32 were extracted for training and validation. A L1 loss function and Adam optimizer [8] with learning rate 1e-3 and number of epochs 100 were used on an RTX2080Ti GPU. During test time, the pre-trained network was fine-tuned using the following high-pass filtering dipole convolution forward model on the whole 3D volume:
$$\Big{\|} \angle \Big{(}\frac{Me^{i(d*x)}}{G*(Me^{i(d*x)})}\Big{)} - f_{SWI} \Big{\|}_2^2$$
Where $$$\angle$$$ the angle of complex data, $$$G$$$ the Gaussian low pass filter with fixed FC 5/8, $$$M$$$ the magnitude image at echo time, $$$d$$$ the spatial dipole kernel, $$$x = U2Net(f_{SWI})$$$ the susceptibility map output of the network with input HPFP $$$f_{SWI}$$$. Network weights were fine-tuned using the above loss function and Adam optimizer with 1e-4 learning rate and 3 steps of gradient descent. For simulated HPFP test dataset, input HPFP with various cutoff frequencies (2/8, 3/8, 4/8, 5/8 and 6/8) or voxel sizes (0.577, 0.750, 0.938 and 1.25 mm in-plane isotropic resolution) were simulated and used as input to the networks to test their robustness against image parameter change. RMSE, HFEN and SSIM were used as quantitative metrics. For prospective HPFP test dataset, HPFP acquired from the scanner was fed into the networks directly and the output QSM was compared to multi-echo GRE QSM. Mean susceptibility values of Caudate Nucleus, Globus pallidus and Putamen were measured and compared. For all experiments, the following methods were compared: UNet, UNet with fine tuning (UNetFT), concatenated UNets (U2Net), and the proposed method U2NetFT, combining U2Net with fine tuning.
Results
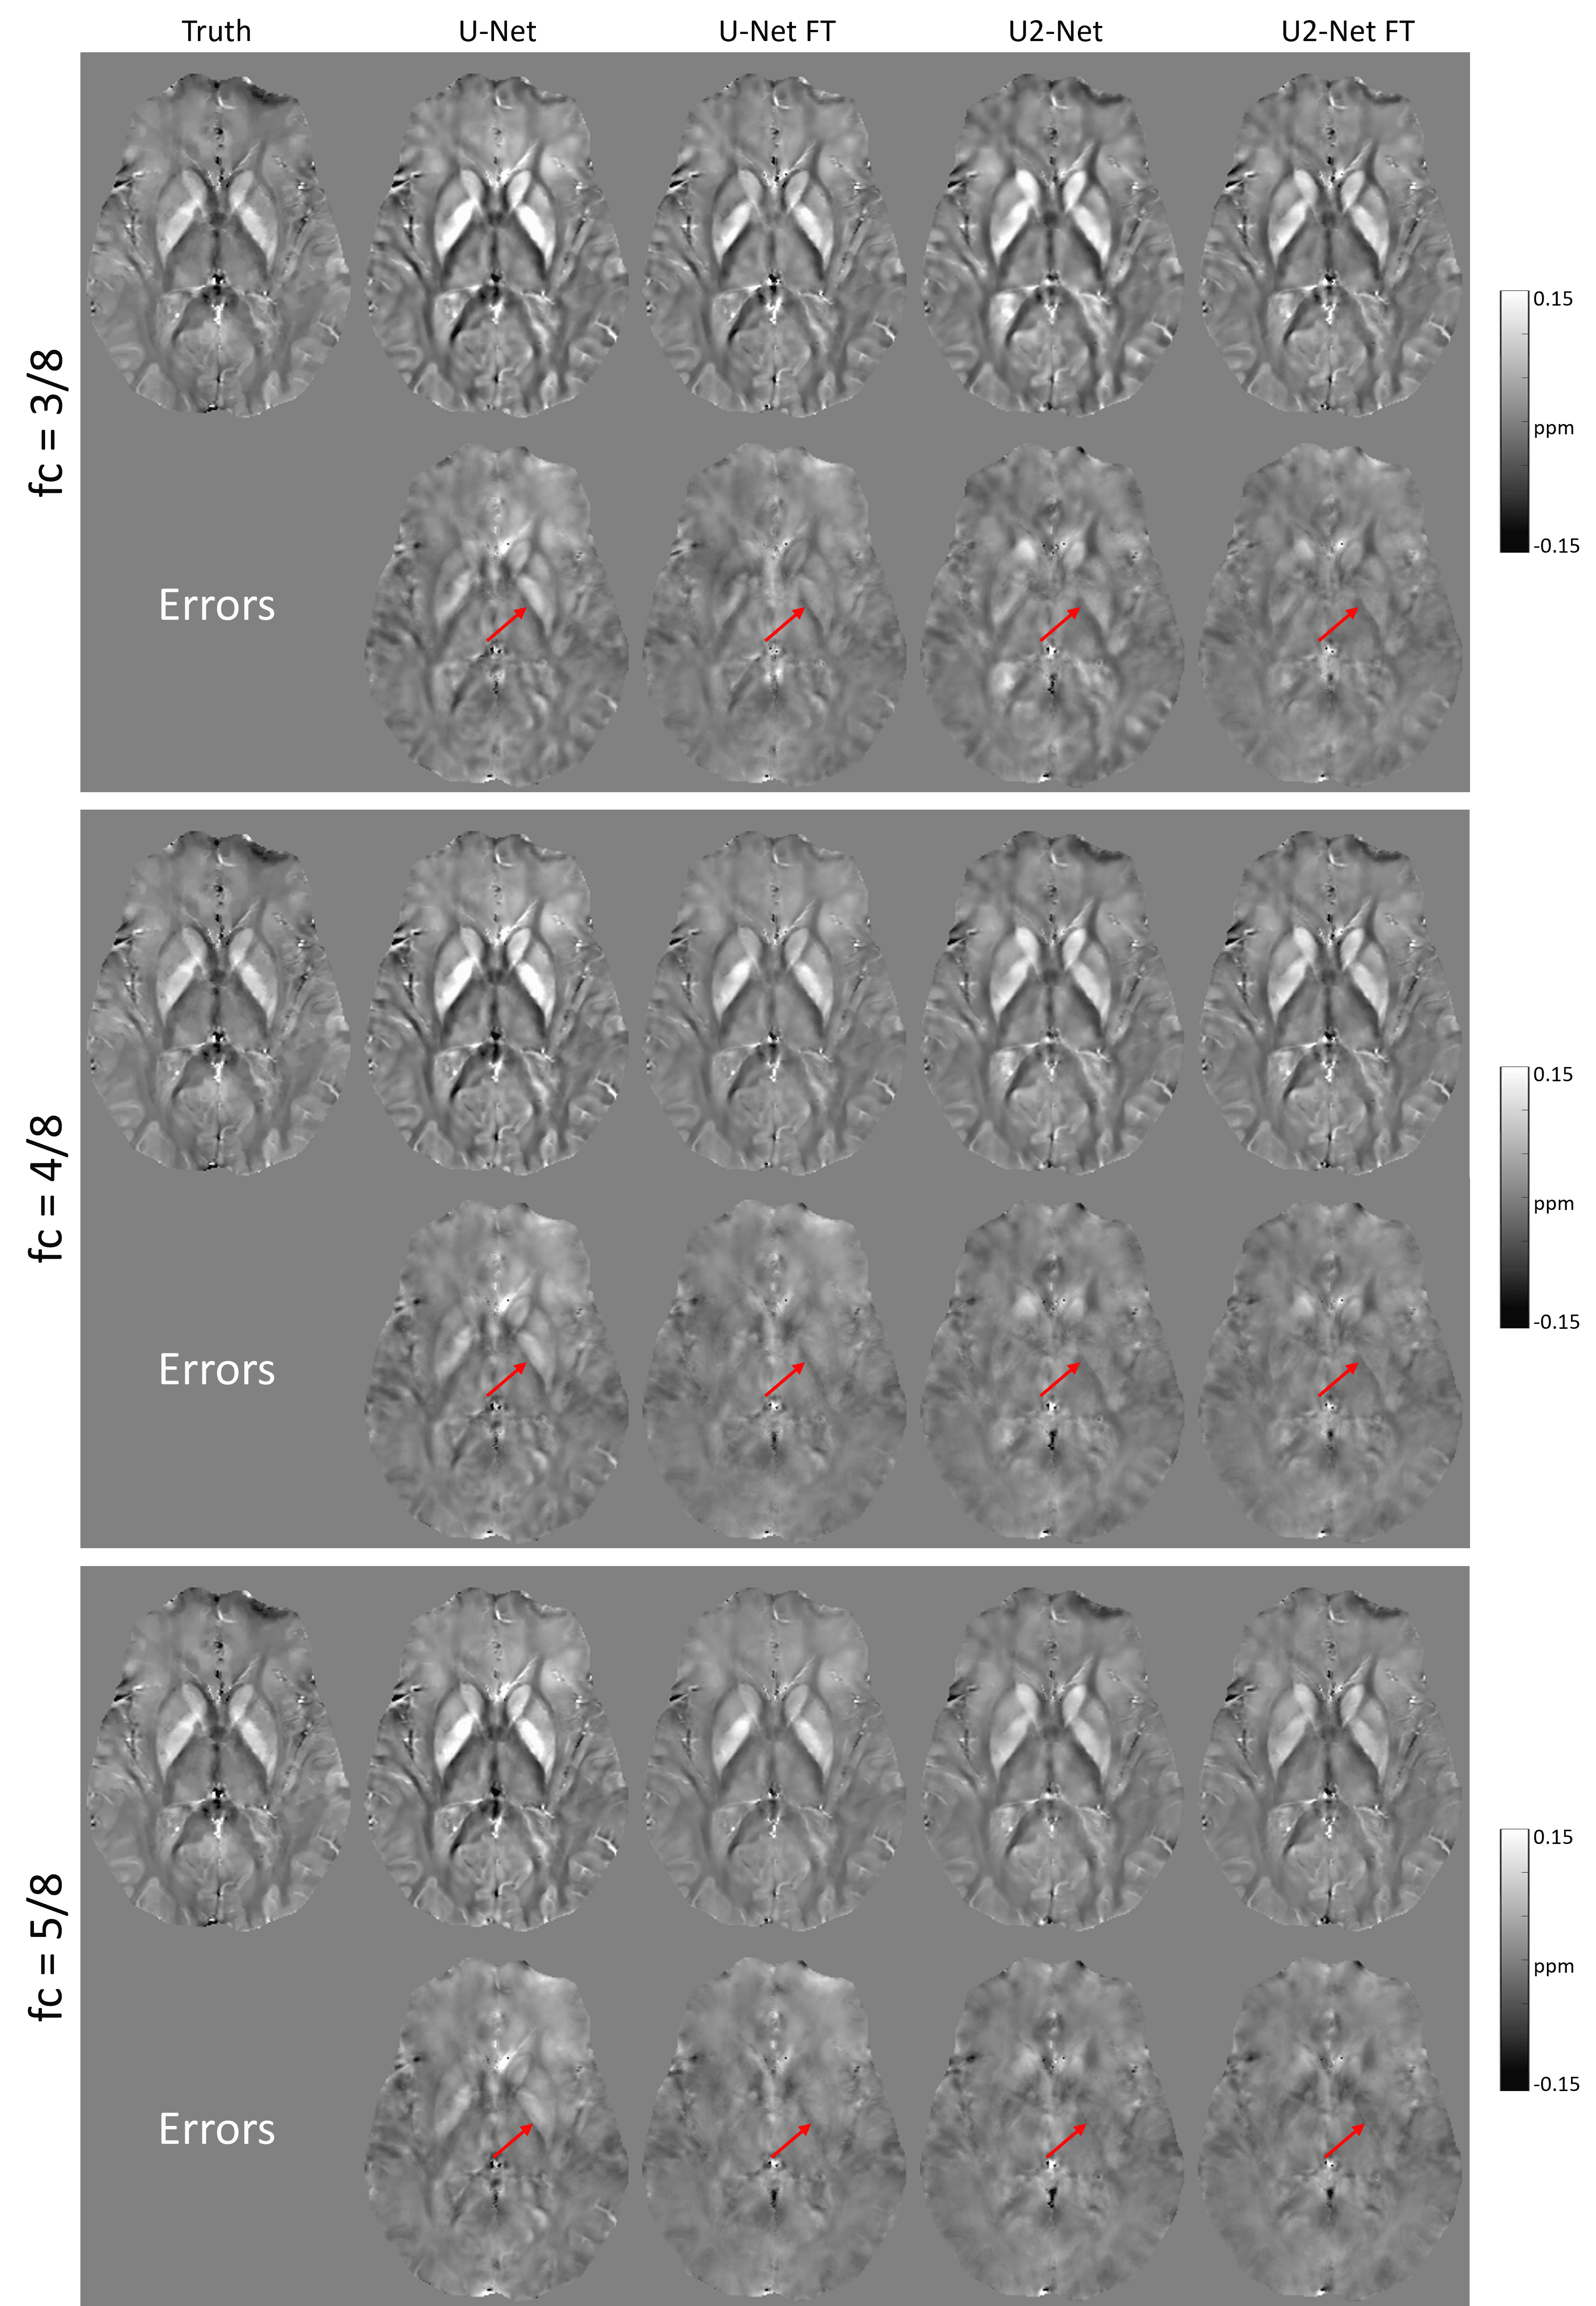
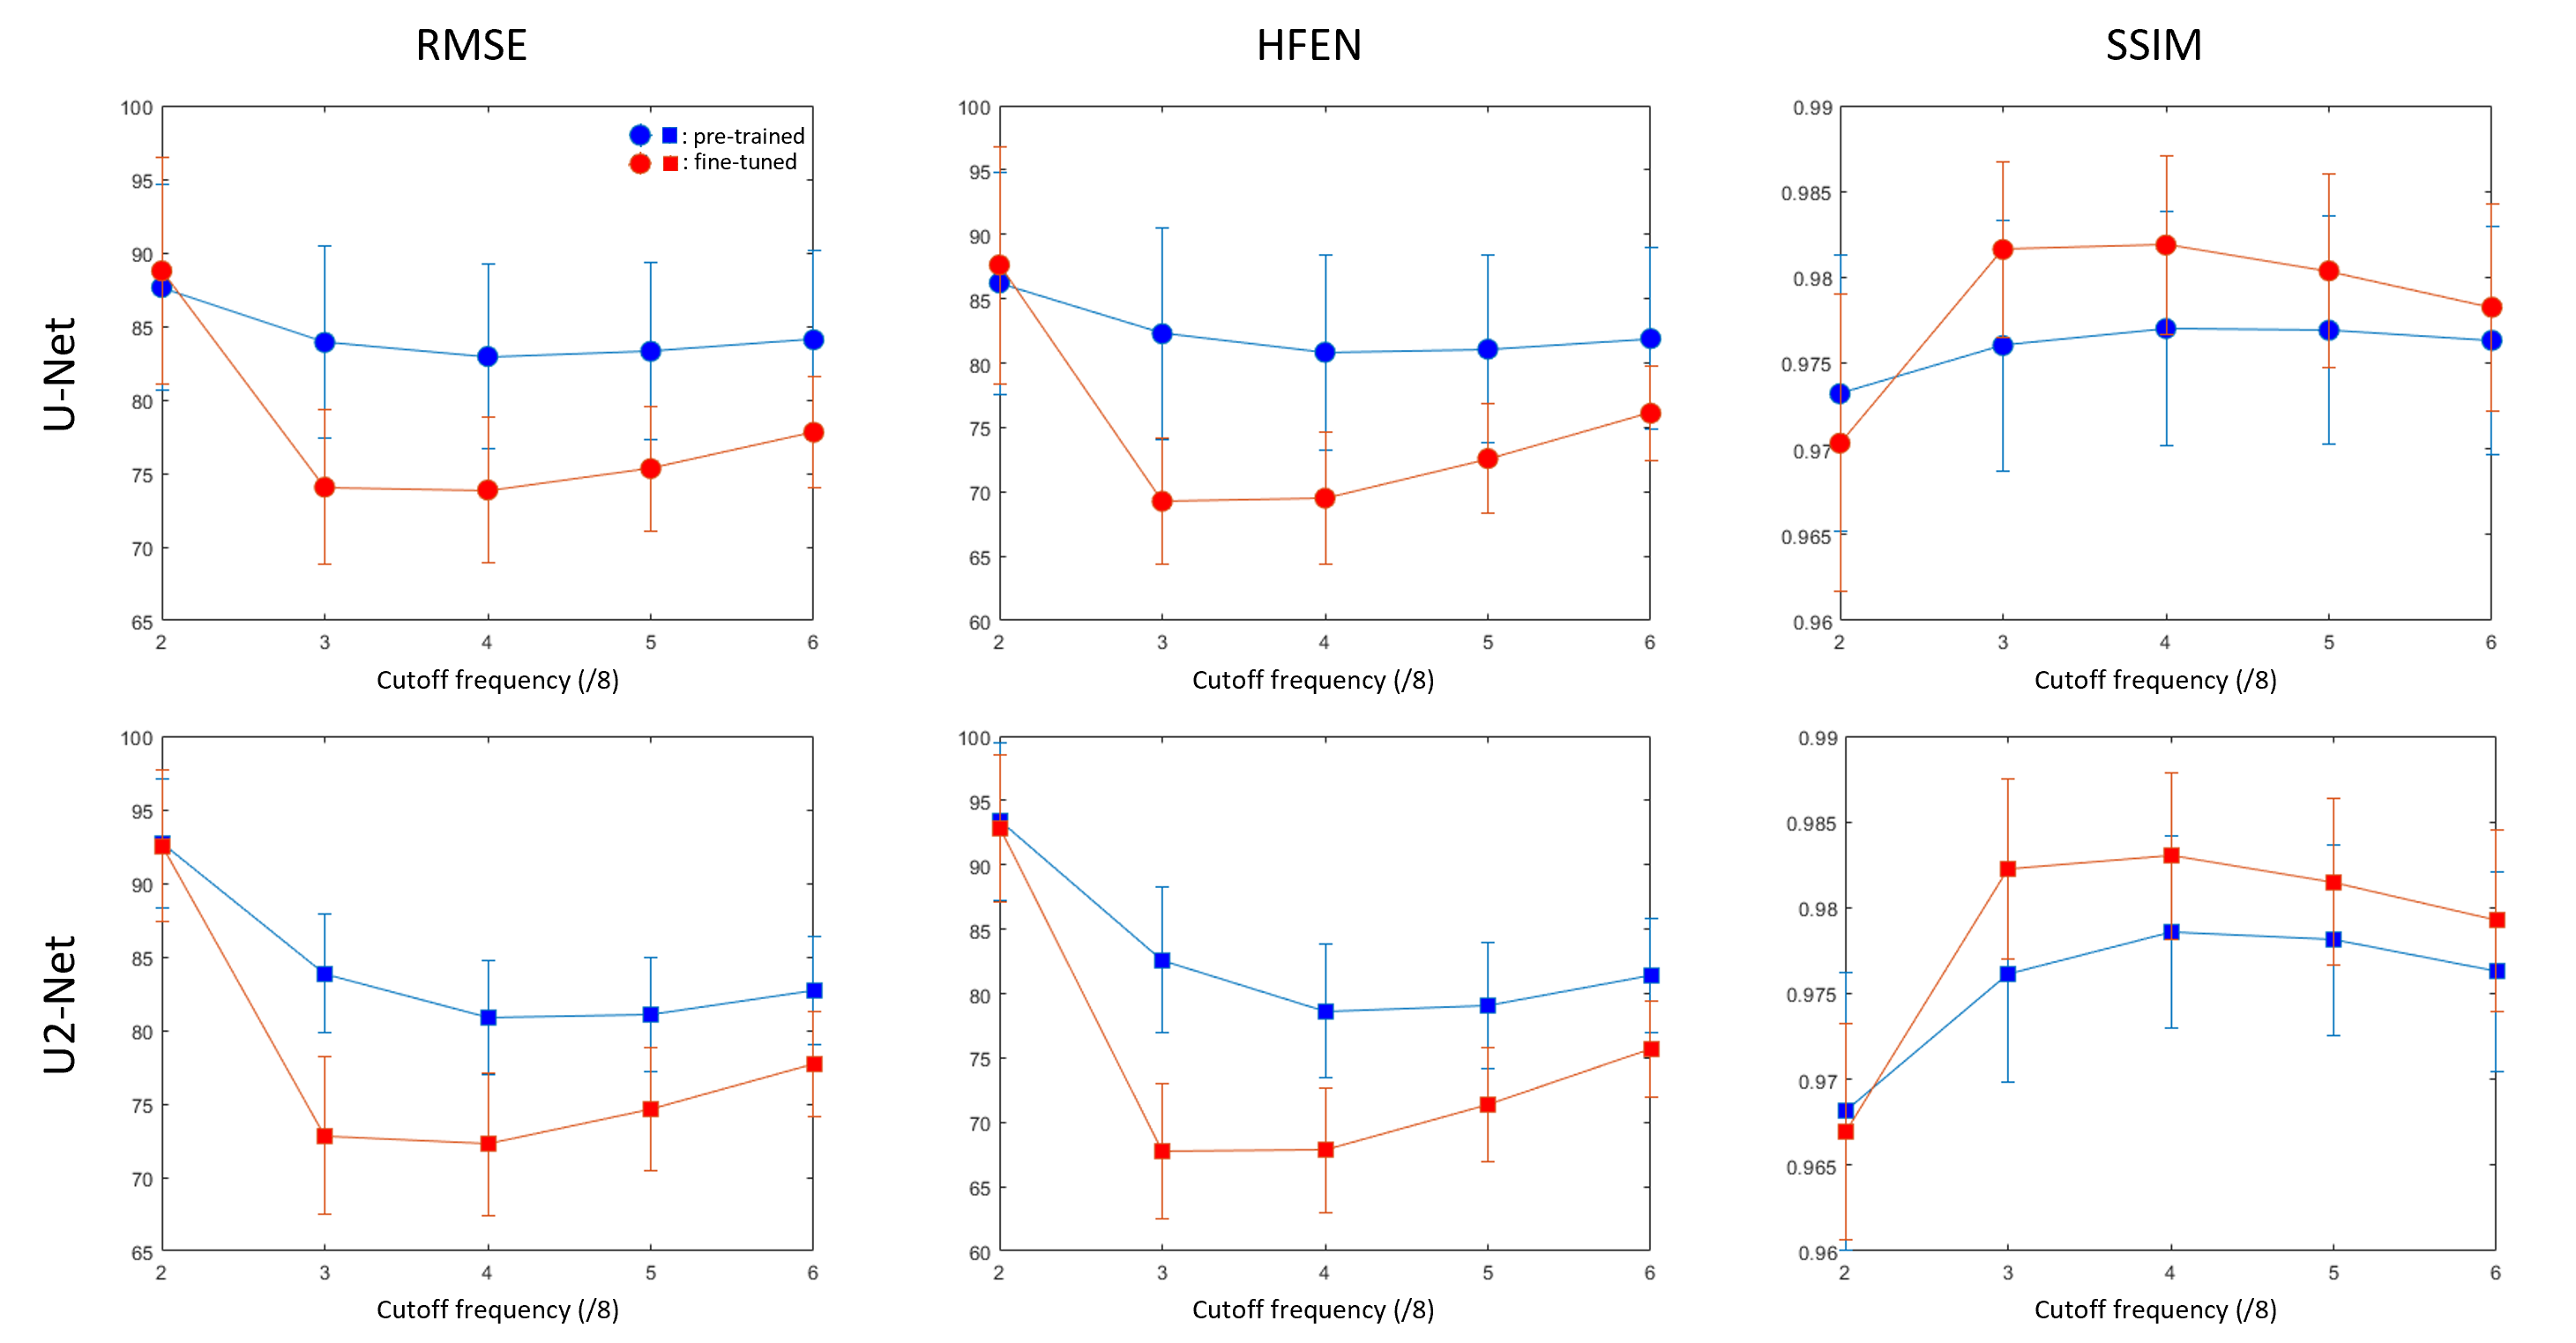
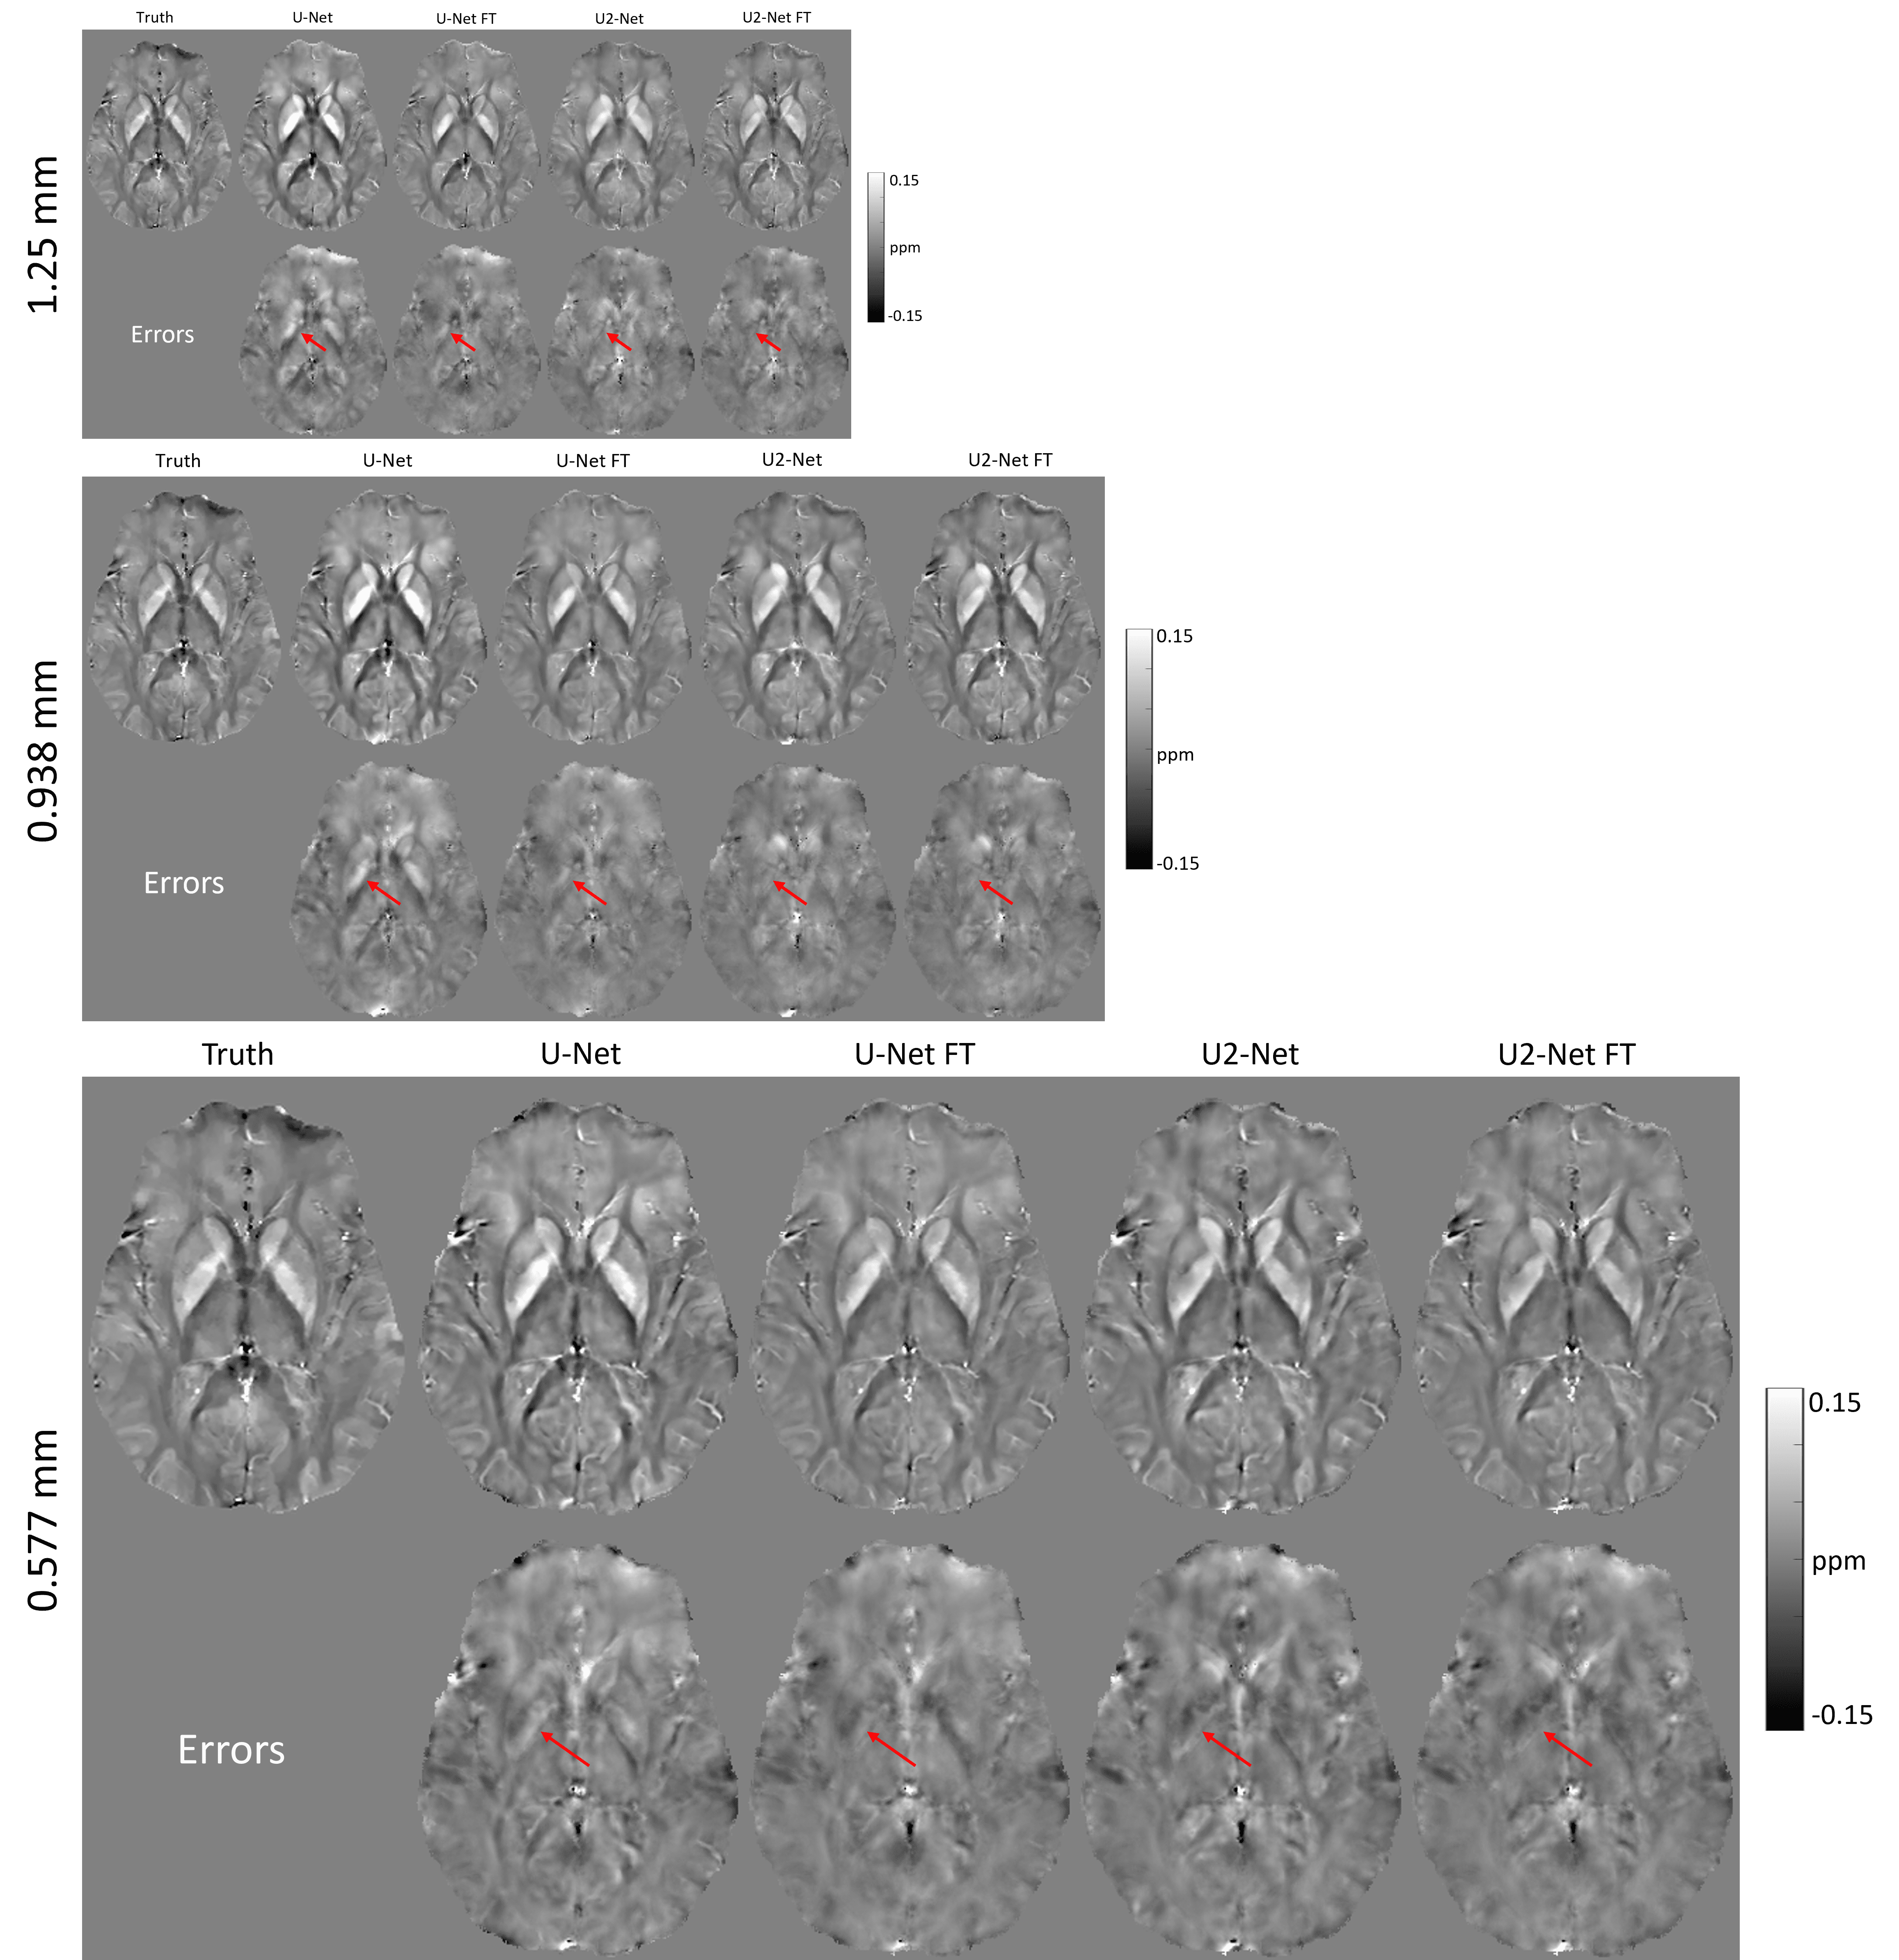
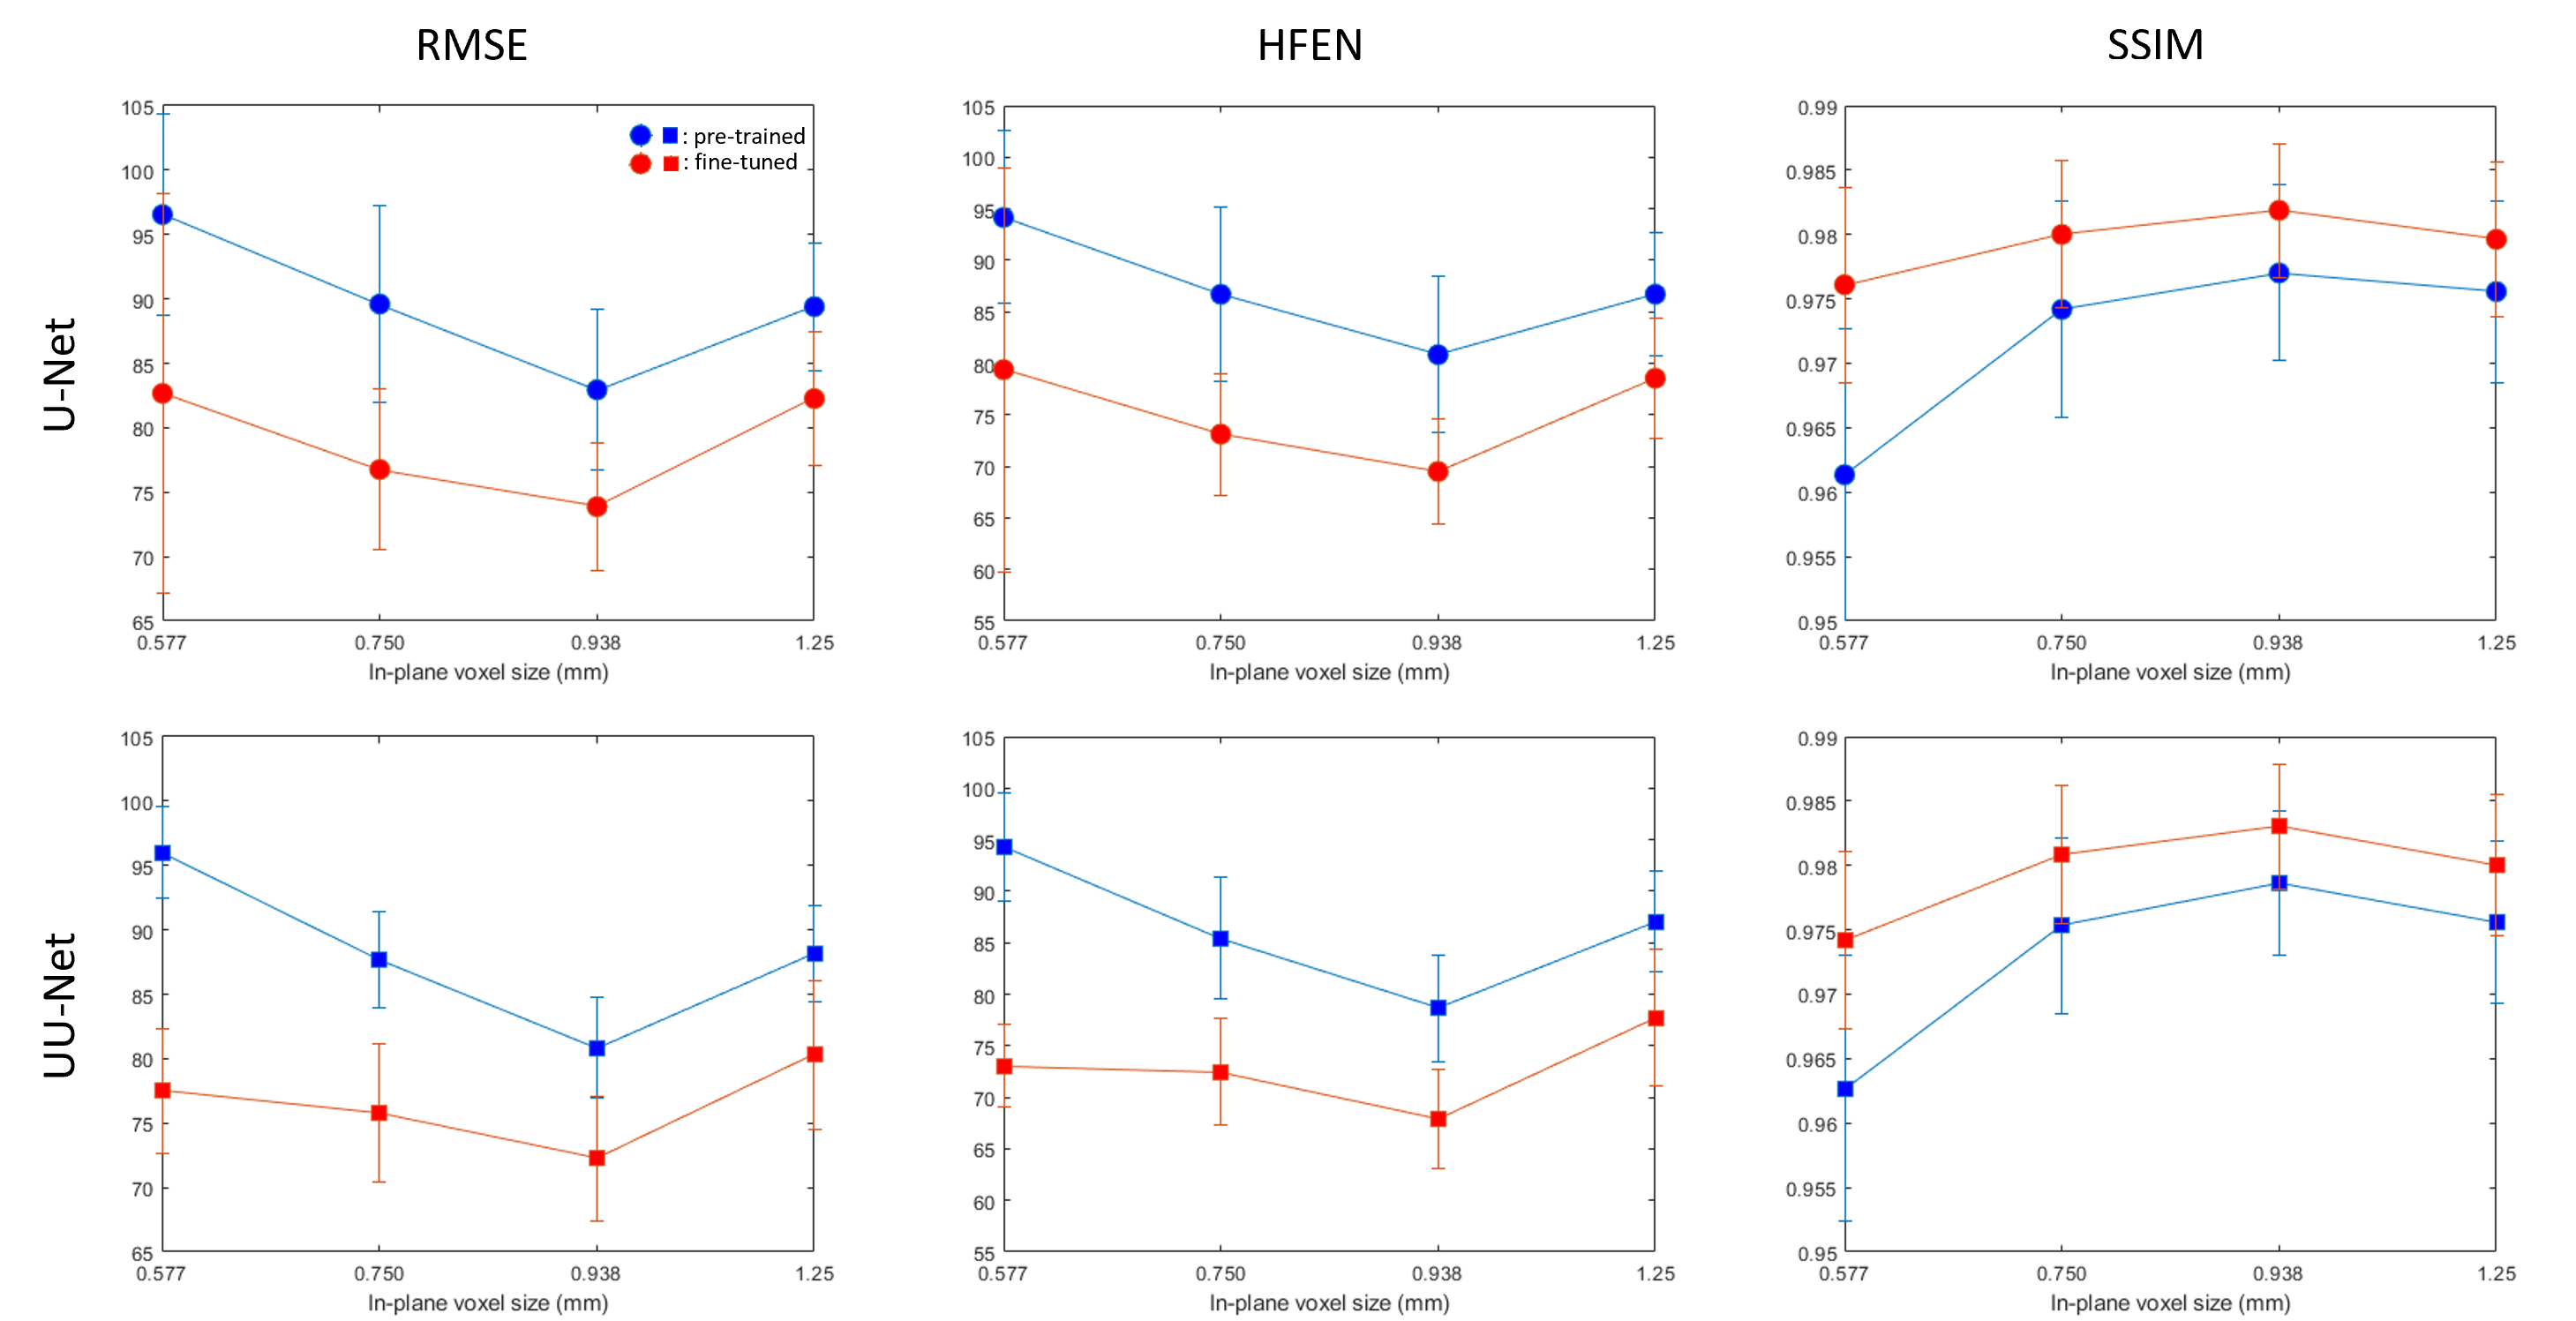
Figure 1 shows the predicted QSM of one simulated test data at different FCs. At FC = 3/8, over-estimations of globus pallidus (red arrows) by UNet and U2Net were reduced after fine tuning. At FC = 4/8 and 5/8, UNet shows apparent overestimation of the globus pallidus (red arrows), which was reduced after after fine-tuning. Quantitative metrics are shown in Figure 2. Reconstructions were consistently improved after fine-tuning at all FCs tested in the experiment.Figure 3 shows the predicted QSMs of one simulated test data at different voxel sizes. At 1.25mm, over-estimations of global pallidus (red arrows) by UNet and U2Net were reduced after fine-tuning. At 0.938mm and 0.577mm, apparent over-estimations of globus pallidus (red arrows) were showed in UNet, but were reduced after fine-tuning as well. Quantitative metrics are shown in Figure 4. Reconstructions were consistently improved after fine-tuning at all voxel sizes tested in the experiment.
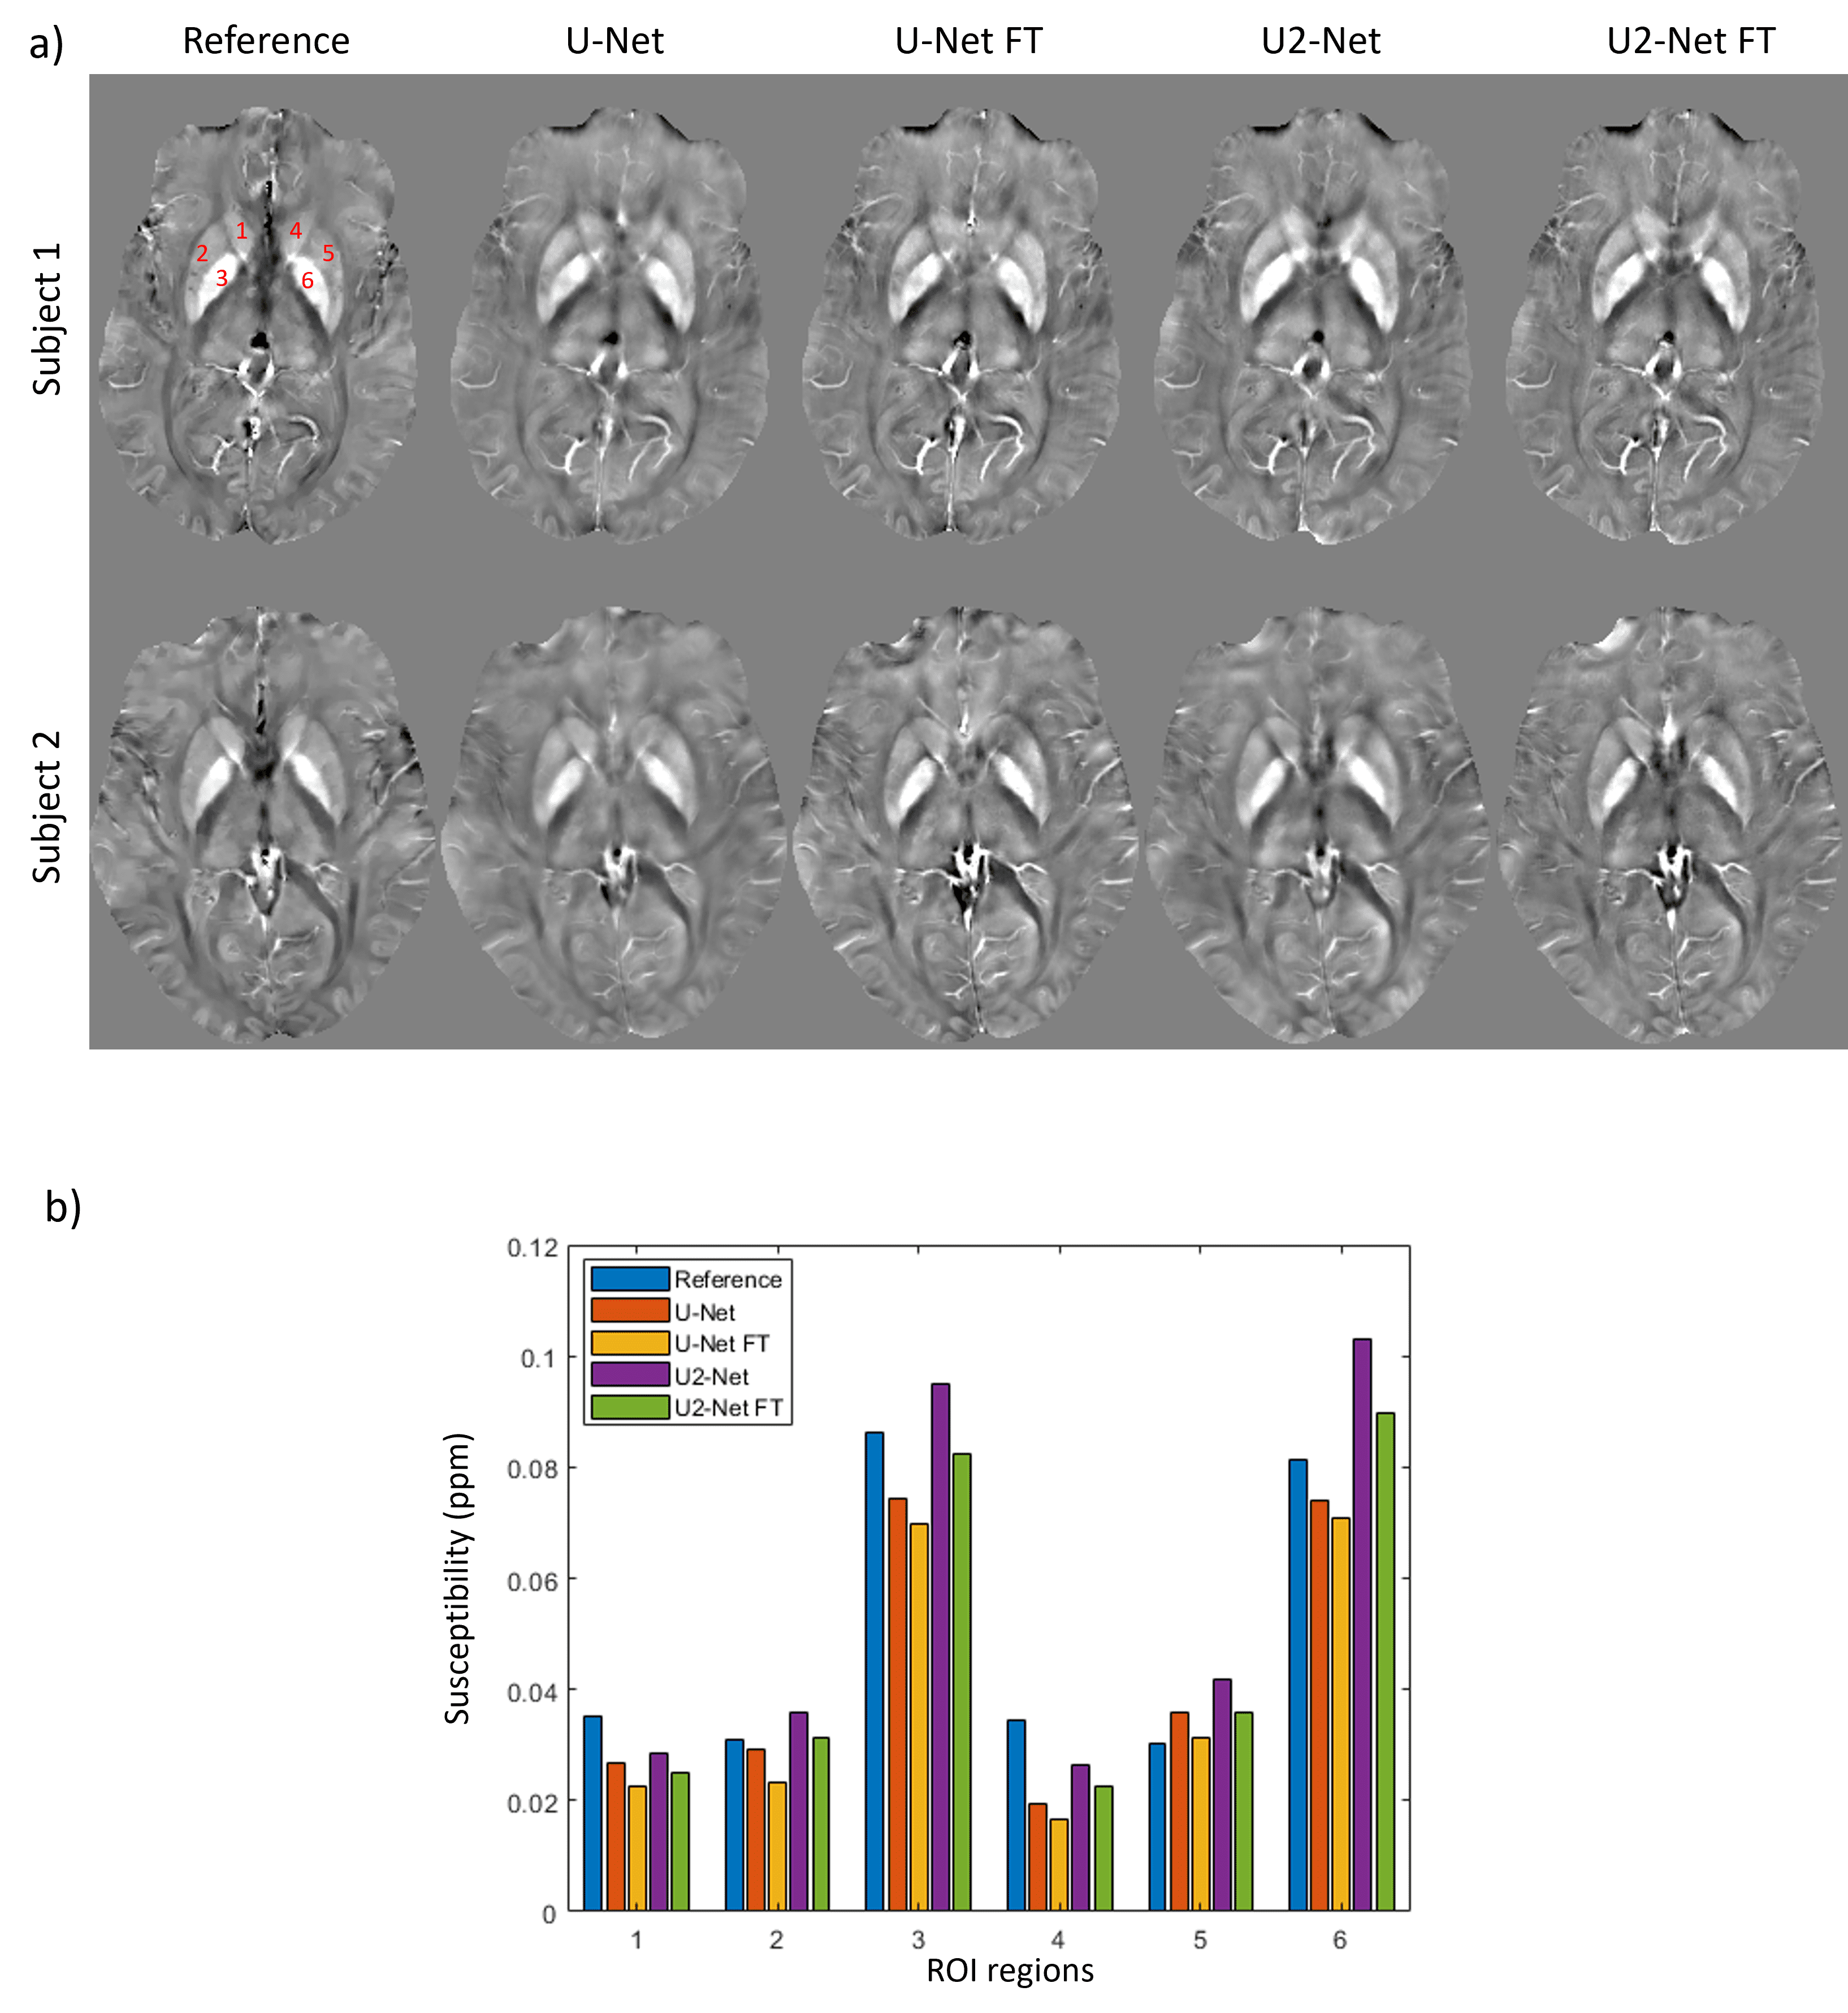
Figure 5(a) shows the predicted QSMs of two prospectively acquired HPFP data. For both cases, UNet and U2Net were visually blurry compared to the reference QSMs but became sharper after fine-tuning. ROIs (indexed with red numbers in Figure 5(a) reference QSM) analysis was shown in Figure 5(b). Under-estimations were observed in both UNet and UNet FT. Over-estimation of U2Net at globus pallidus were reduced by U2Net FT.
Conclusions
Network fine-tuning using dipole convolution and high-pass filtering combined physical model improved the robustness of the pre-trained HPFP-to-QSM networks.Acknowledgements
No acknowledgement found.References
1.Haacke, E. Mark, et al. Magnetic Resonance in Medicine 52.3 (2004): 612-618.
2.de Rochefort, Ludovic, et al. Magnetic Resonance in Medicine 63.1 (2010): 194-206.
3. Kames, Christian, et al. Magnetic Resonance in Medicine (2021).
4. Liu, Tian, et al. Magnetic resonance in medicine 69.2 (2013): 467-476.
5. Liu, Tian, et al. NMR in Biomedicine 24.9 (2011): 1129-1136.
6. Liu, Jing, et al. Neuroimage 59.3 (2012): 2560-2568.
7. Çiçek, Özgün, et al. MICCAI. Springer, Cham, 2016.
8. Kingma, Diederik P., and Jimmy Ba. arXiv preprint arXiv:1412.6980 (2014).
Figures