3557
Quantitative Susceptibility Mapping of the Ex Vivo Human Brainstem with Luxol Fast Blue Staining Correlation1Electrical and Computer Engineering, CORNELL UNIVERSITY, New York City, NY, United States, 2Department of Radiology, Weill Cornell Medicine, New York City, NY, United States, 3Department of Radiology, Shandong Provincial Hospital Affiliated to Shandong First Medical University, Jinan, Shandong, Jinan, Shandong, China, 4Department of Radiology, Hainan General Hospital, Hainan Hospital Affiliated to Hainan Medical College, Hainan, China, 5Department of Pathology and Laboratory Medicine, Weill Cornell Medicine and New York Presbyterian Hospital, New York City, NY, United States
Synopsis
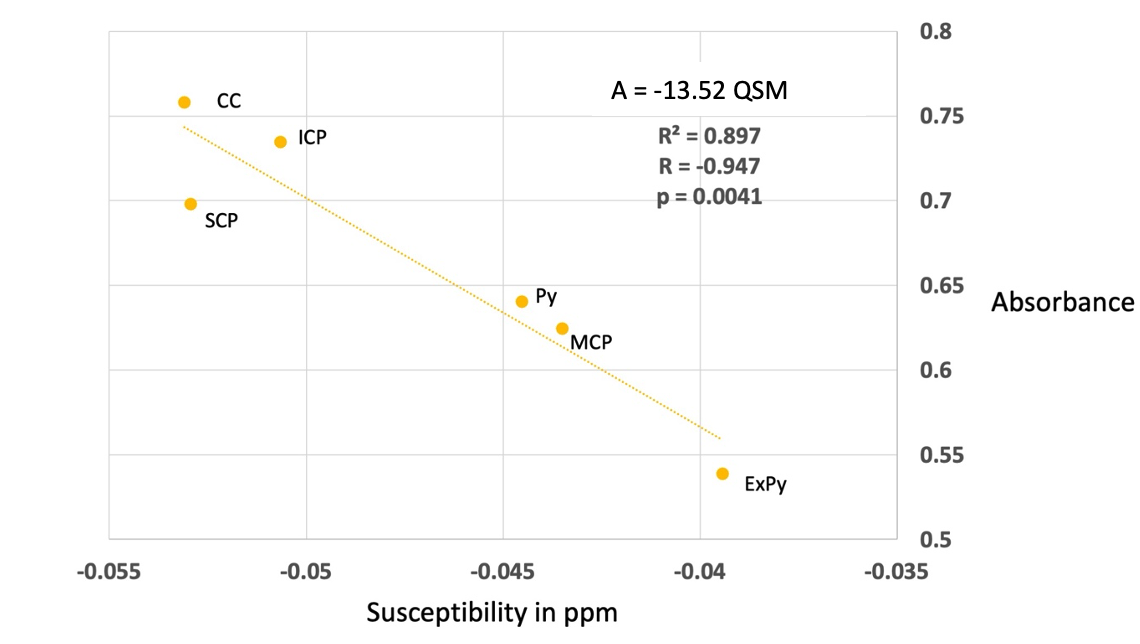
This study utilized sub-millimeter 3T gradient echo MRI of the brainstem ex vivo to obtain a magnetic susceptibility map (QSM). ROIs of both deep brain nuclei and myelinated fiber tracts were chosen and quantified from QSM obtained from MRI field. The ex vivo specimens were then stained with Luxol Fast Blue and the resultant absorbance of the ROIs were compared to QSM. A strong linear correlation was observed (R2 = 0.897, p = 0.0041).
Summary of Main Findings
QSM of the ex vivo brainstem is compared across ROIs for nine specimens and multi-contrast data is obtained to observe anatomical features. The susceptibility values are compared to Luxol Fast Blue staining intensity derived absorbance for myelinated fiber tracts. The resultant absorbance values are correlated with susceptibility derived from QSM.Introduction
The goal of this study was to perform Quantitative Susceptibility Mapping (QSM) of the brainstem at sub-millimeter resolution at 3T and compare the obtained susceptibility values to Luxol Fast Blue stained sections which quantify myelin concentrations. The susceptibility distribution of the brainstem is challenging to obtain at high resolution and high signal to noise due to the size and position of the brainstem.1,2 There are numerous studies that have attempted to characterize the susceptibility distribution of the brainstem in vivo. However, these have often suffered from poor feature resolution due to tissue distribution heterogeneity (interfaces between fat, brain, bone, and air), flow effects, motion artifacts, amongst other factors. 3–5 Extending on these and a few ex vivo studies of brainstem susceptibility, this study presents a direct comparison to stained tissue sections with susceptibility values obtained from reconstruction maps. 6-7Methods
Nine ex vivo specimens of the brainstem were obtained and imaged with varying contrasts at 3T including a multi echo GRE MRI.All specimens are imaged at 3T GE (Waukesha, WE) scanner utilizing the wrist coil. T1w 3D TSE sequence was utilized with a phase acceleration factor of 2, 4 excitations, resolution of 0.5x0.5x0.6 mm, and 16/541 ms TE/TR. A 55 direction DTI was obtained at 0.9 mm isotropic resolution, with a TE/TR of 78 ms/4000 ms, and 7 excitations, with a b value of 1000, and phase acceleration of 3. The multi-echo GRE was obtained at 0.5x0.5x0.6 mm resolution, with the first echo at 3.9 ms, and a total of 8 echoes with 4.7 ms echo spacing and 1 phase acceleration factor of 2. MEDI PDF with SMV 6,7, known as MEDI-SMV reconstruction technique was used and regularization parameters were $$$\lambda_1 = 0.001$$$ and SMV = 5mm kernel. DTI was reconstructed utilizing TrackVis, with a spline filter and FACT propagation algorithm.8
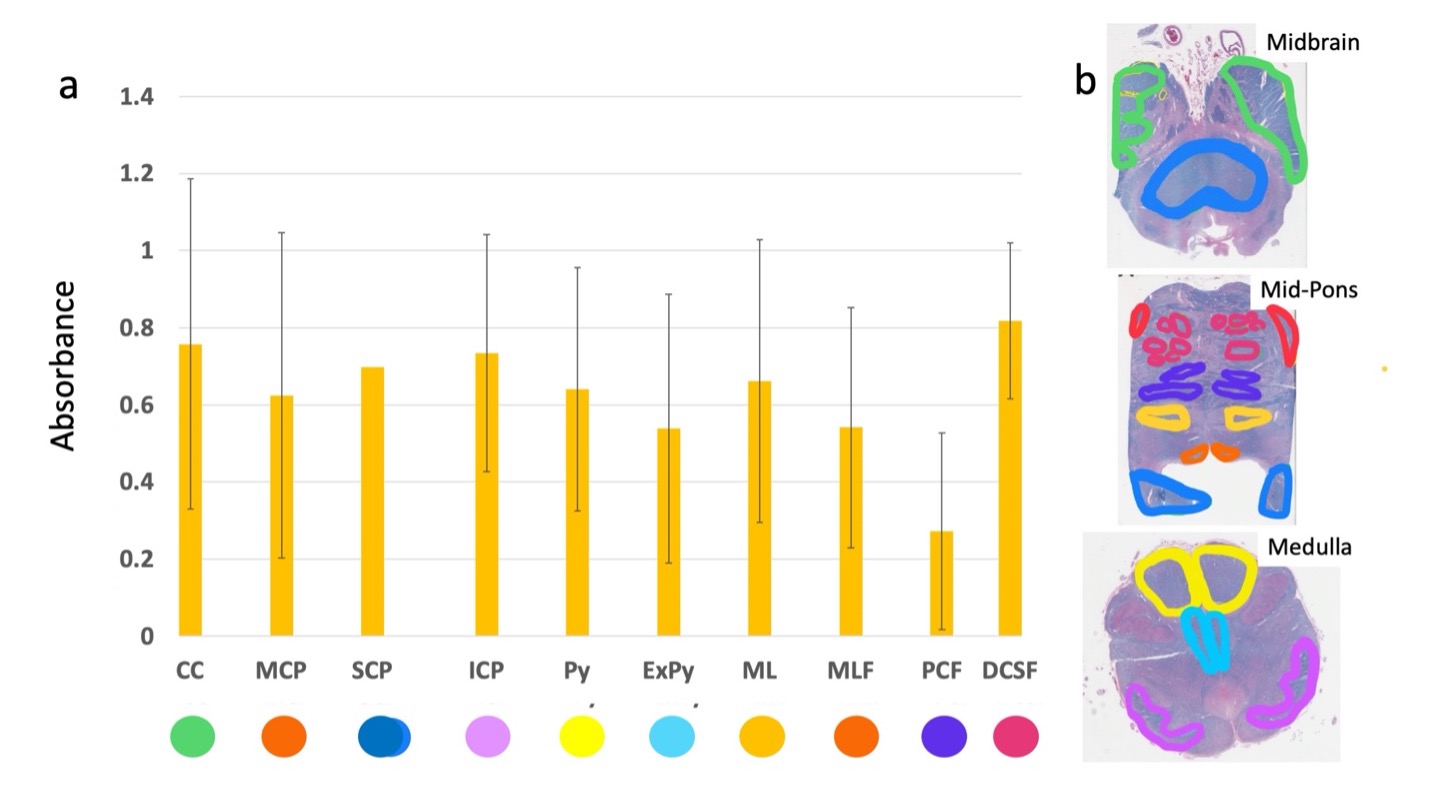
The same specimens imaged and reconstructed were sectioned for microscopy at a thickness of 5 microns, mounted onto slides, stained with Luxol Fast Blue for myelin and counterstained with Hematoxylin and Eosin. The brainstem was sectioned in three places axially, at the midbrain at the level of the Crus Cerebri, at the mid-Pons, and at the medulla at the level of the olivary complex.
An experienced reader segmented the following ROIs: Crus Cerebri (CC), Superior Cerebellar Peduncle (SCP), Middle Cerebellar Peduncle (MCP), Inferior Cerebellar Peduncle (ICP), Pontocerebellar Fibers (PCF), Degenerate Corticospinal Tract Fibers (DCSF), Pyramids (Py), Extrapyramidal Tracts (ExPy), Medial Lemniscus (ML), and Medial Longitudinal Fasciculus (MLF). QSM was identically segmented at each of the above sections. All visible ROIs are segmented per section. The ROIs are as folliows, Red Nucleus (RN), Substantia Nigra (SN), Crus Cerebri (CC), Superior Cerebellar Peduncle (SCP), Middle Cerebellar Peduncle (MCP), Inferior Cerebellar Peduncle (ICP), Pyramids (Py), and Extrapyramidal Tracts (ExPy). ROIs are depicted in Figures 2-3. The outlined ROIs are quantified by taking the average value within the outlined area for QSM in ppm and the absorbance is quantified by taking the area within the outlined sections and applying the following formula per ROI, $$$log_{10}(\frac{I_{background}}{I_{ROIaverage}})$$$ and QSM derived susceptibility in ppm. Susceptibility and Absorbance are then correlated.
Results
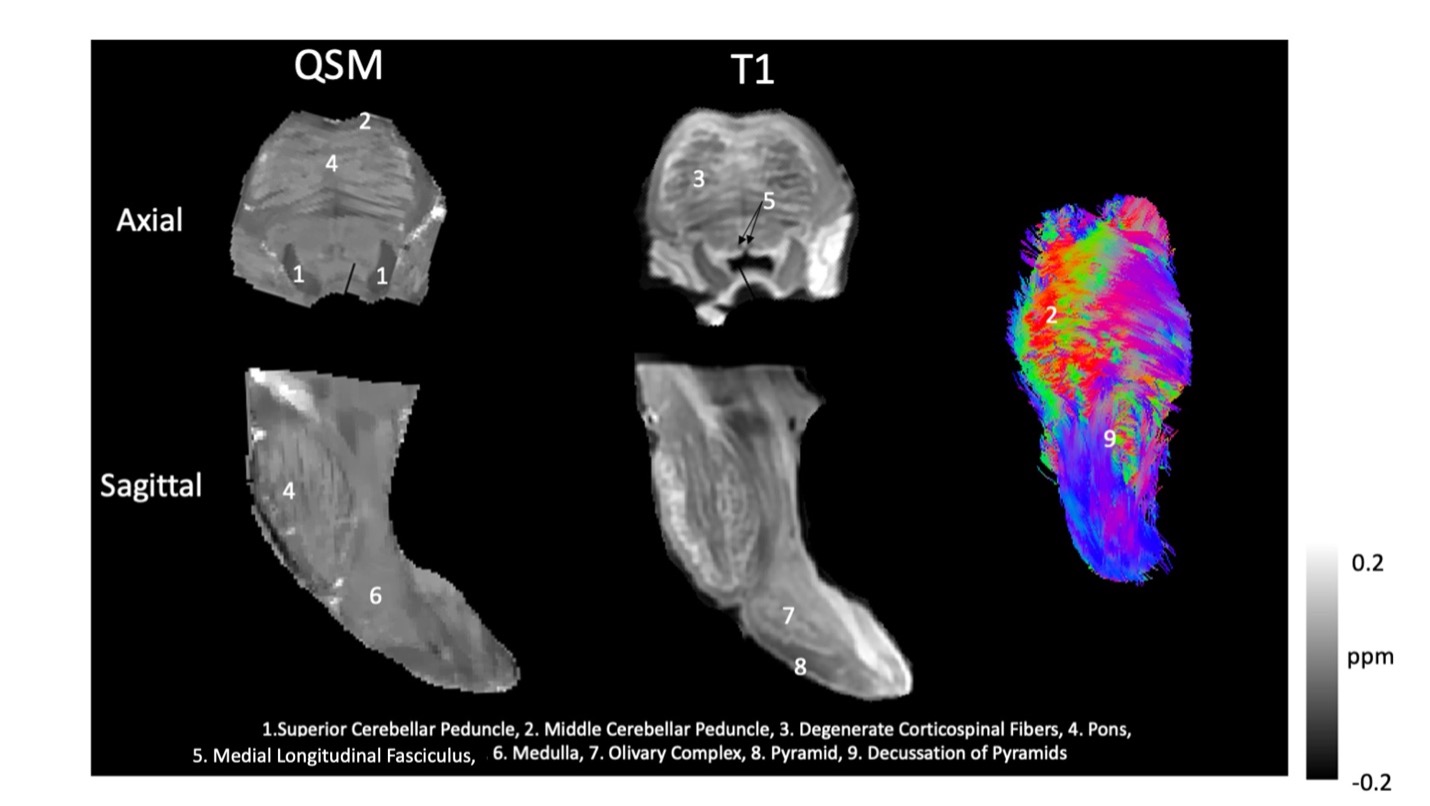
Figure 1 depicts multicontrast images of the brainstem at both axial and sagittal sections, and the accompanying 3D fiber tractography, for one specimen of the nine utilized in this study.Figure 2 depicts all ROIs segmented in the stained cross sections and the accompanying values. Segmented section ROIs are displayed as log-scale average intensity across each ROI which is an estimate of absorbance.
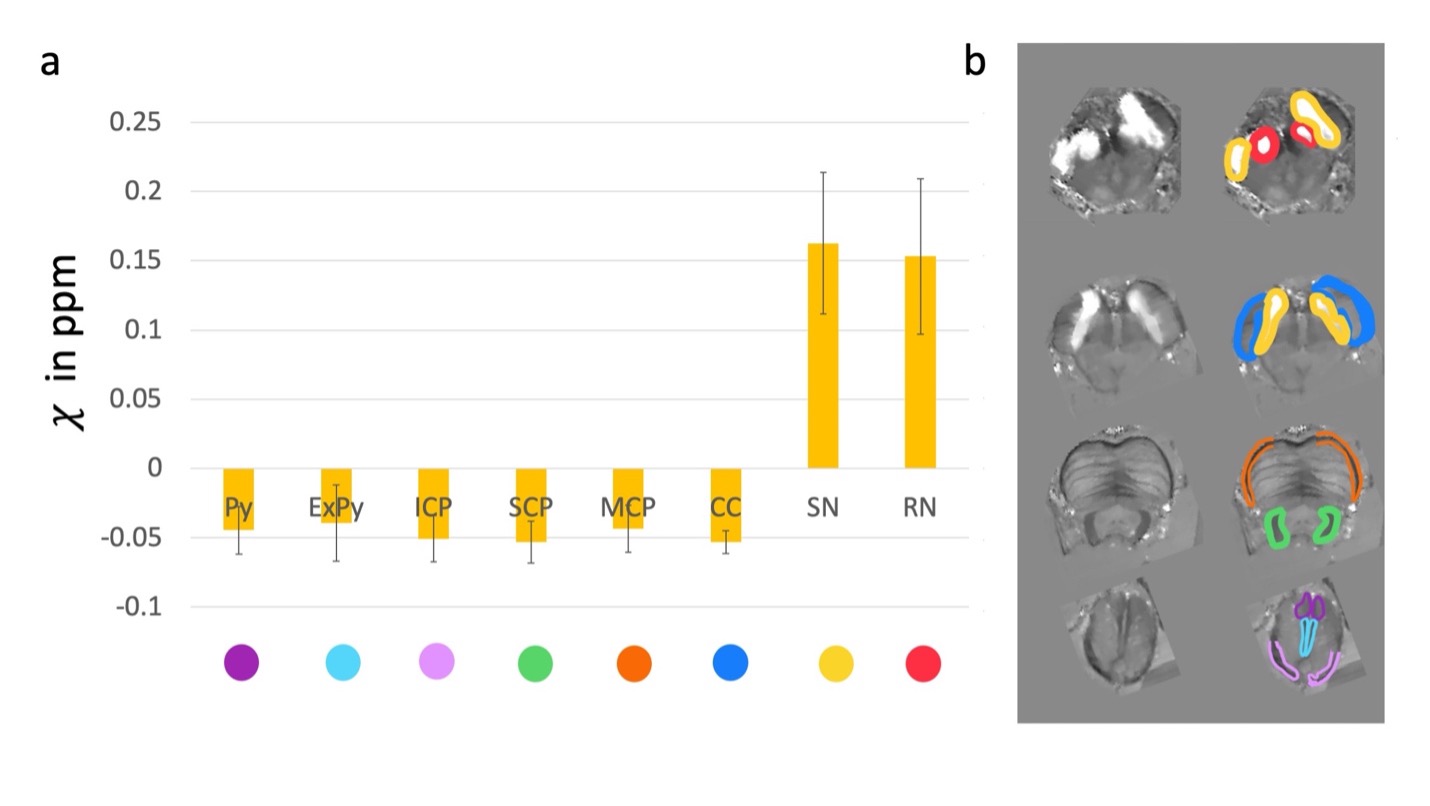
Figure 3 depicts the ROIs for QSM shown as susceptibility in ppm. Example images of QSM are displayed to the right of the plot.
Figure 4 shows a linear correlation between the absorbance and the QSM susceptibility values. The overlapping ROIs are chosen and plotted, and the R-value is -0.947, indicating a strong correlation (the sign indicating that more negative susceptibility values correlate with higher absorbance of Luxol Fast Blue), and is statistically significant with a p-value of 0.0041.
Discussion and Conclusion
It is known that QSM correlates with the concentration of the species of interest and that Luxol Fast Blue staining intensity measurements can quantify species concentration.9,10 As such, not only does this study provide an overview of the magnetic susceptibility distribution of the brainstem, it also demonstrates that the QSM values obtained from the MEDI SMV algorithm correlate strongly with the Luxol Fast Blue stained sections for regions of the brainstem that contain myelin, providing validity to the use of QSM in clinical settings with direct correlation to staining intensity derived absorbance of stained species in tissue specimens. Compared to literature values of in vivo QSM, the susceptibility magnitude is higher in this ex vivo study, and correlates more closely with stained sections.5 Future research will focus on further comparisons of accuracy across algorithms and white matter anisotropy.Acknowledgements
The authors acknowledge all funding agencies and the Department of Radiology Weill Cornell, Department of Pathology and Laboratory Medicine Weill Cornell, and the CBIC City Group Biomedical Imaging Center.References
1. Gates P. The rule of 4 of the brainstem: A simplified method for understanding brainstem anatomy and brainstem vascular syndromes for the non-neurologist. Intern Med J. 2005;35(4):263–6.
2. Beissner F. Functional MRI of the Brainstem: Common Problems and their Solutions. Clin Neuroradiol. 2015;25:251–7.
3. Straub S, Knowles BR, Flassbeck S, Steiger R, Ladd ME, Gizewski ER. Mapping the human brainstem: Brain nuclei and fiber tracts at 3 T and 7 T. NMR Biomed. 2019;32(9):1–13.
4. Jingjia Chen, Khallil Taverna Chaim, Maria Concepcion Carcia CL. Validating DECOMPOSE QSM with temperature variant ex vivo brainstem imaging experiments. 8(8):7–10.
5. Deistung A, Schäfer A, Schweser F, Biedermann U, Güllmar D, Trampel R, et al. High-resolution MR imaging of the human brainstem in vivo at 7 Tesla. Front Hum Neurosci. 2013;7(OCT):1–12.
6. Wang Y, Liu T. Quantitative susceptibility mapping (QSM): Decoding MRI data for a tissue magnetic biomarker. Magn Reson Med. 2015;73(1):82–101.
7. Kee Y, Liu Z, Zhou L, Dimov A, Cho J, De Rochefort L, Seo JK, Wang Y. Quantitative susceptibility mapping (QSM) algorithms: mathematical rationale and computational implementations. IEEE Transactions on Biomedical Engineering. 2017 Sep 5;64(11):2531-45.
8. Wang R, Benner T. Diffusion toolkit: a software package for diffusion imaging data processing and tractography. Proc Intl Soc Mag Reson Med [Internet]. 2007;15:3720. Available from: http://cds.ismrm.org/ismrm-2007/files/03720.pdf
9. Sjöbeck M, Haglund M, Englund E. Decreasing myelin density reflected increasing white matter pathology in azheimer’s disease - A neuropathological study. Int J Geriatr Psychiatry. 2005;20(10):919–26.
10. Warntjes JBM, Persson A, Berge J, Zech W. Myelin detection using rapid quantitative MR imaging correlated to macroscopically registered luxol fast blue-stained brain specimens. Am J Neuroradiol. 2017;38(6):1096–102.
Figures