3556
Repeatability of Susceptibility Separation in Brain1Biomedical Engineering, University of Alberta, Edmonton, AB, Canada
Introduction
Susceptibility sources in brain include paramagnetic iron and diamagnetic myelin or calcium. Conventional quantitative susceptibility mapping (QSM) methods yield a final map of the net susceptibility value in each voxel but recently new methods have been developed to distinguish intravoxel paramagnetic and diamagnetic susceptibility sources1,2. One separation method leverages the information in local field shift and R2’ maps with the assumption that both were caused by susceptibility sources1. We examined the repeatability of this susceptibility separation method compared to conventional QSM, including effects of parameter choices.Methods
The separation method was tested on 22 scan-rescan subjects (age 20-49) all studied on the same 3T. The repeatability of the dia- and paramagnetic separation and the total QSM was compared to conventional QSM. Susceptibility and R2* maps used a 3D multi-echo gradient echo with TE1=3.8ms, ∆TE=5.5ms, 6 echoes, TR=37ms and resolution of 0.94×0.94x2.0 mm3. R2 maps used a dual echo 2D turbo spin echo TE 10/93ms, TR 4000ms and resolution of 0.9×0.9×3.5 mm3. Susceptibility sources were related to R2’ using a relaxometry coefficient (Dr) that was optimized using four regions globus pallidus (GP), putamen (Pt), thalamus (Th) and caudate (Ca).Reconstruction: For conventional QSM, V-SHARP and MEDI were used3,4. R2 maps used stimulated echo correction5. Maps were registered to T1-w images using FSL6 and all the segmentations in deep gray matter7 and white matter8 were done in the same T1 space.
As introduced1, the loss function that the separation method is trying to minimize is:
$$argmin_{\chi_{pos},\chi_{neg}} ||W_r(R_2^{'}-(D_{r,pos}|\chi_{pos}|+D_{r,neg}|\chi_{neg}|)) + i2\pi W_f(f-D_f*(\chi_{pos}+\chi_{neg}))||_2^2 + reg(\chi_{pos}+\chi_{neg})$$ Eq [1]
Where $$$\chi_{pos}$$$ and $$$\chi_{neg}$$$ are positive and negative susceptibility values and Dr,pos=Dr,neg. Wr and Wf are weights for R2’ and local field shift map, respectively. The relaxometry coefficient plays a significant role in the final result as larger Dr suppresses susceptibility values. Therefore, choosing an optimal Dr is critical. In the initial work, Dr was set by measuring the slope of R2’ vs total susceptibility value in the conventional QSM. Here we study the effects on repeatability of varying Dr. The metric used for evaluation is the relative error, e, between scan and rescan in ROIs:
$$e = \frac{\sum\frac{\chi_1-\chi_2}{(\chi_1+\chi_2)\times0.5}}{N}$$ Eq [2]
$$$\chi_1$$$ and $$$\chi_2$$$ are susceptibility values of scan and rescan, respectively and N is number of subjects. Pearson correlation of paramagnetic, diamagnetic and total susceptibility were measured from ROIs of scan and rescan data from all subjects. ROIs were in deep gray matter (DGM) and white matter (WM). The regions in DGM are GP, Pt, Th, and Ca and regions in WM are posterior internal capsule (PIC), body of corpus callosum (BCC) and optic radiation (OR). A single spatial averaged brain map was also produced by normalizing all scans into MNI space to examine ROI histograms across the averaged brain.
Results
Figure 1 illustrates the unique contrast of positive and negative susceptibility maps.Effects of the relaxometry coefficient Dr in paramagnetic and diamagnetic components are shown in Tables 1 and 2, reporting the relative error between scan and rescan in each ROI. Optimal Dr for best repeatability varies with structure.
Figure 2 shows the distribution and scan-rescan correlations of susceptiblity values in DGM regions and WM regions. Overall, the paramagnetic component exhibited higher correlation than diamgnetic component in DGM and WM. The paramagnetic correlations were high in DGM (0.94) but lower in WM (0.79). Diamagnetic components were low in both DGM (0.76) and WM (0.39). Total susceptibility from the separation method1 had similar correlations to conventional QSM in DGM and WM, but lower correlations in WM (0.86 for separation method and 0.87 for conventional QSM). Reasons for the poor correlation in WM include small values and greater sensitivity to orientation to the main magnetic field. Specifically, PIC is mainly parallel to the magnetic field whereas BCC and OR are mainly perpendicular and subtle head tilts between scans may yield different orientations.
Figure 3 shows histograms of the total susceptibility from the separation method1 in DGM regions (GP, Pt, Th and Ca). As depicted the separation method has less variance in all the regions and histogram pattern is similar to conventional QSM.
Discussion and Conclusions
Separation methods offer better tissue specificity by separating the paramagnetic and diamagnetic susceptibility sources. An approach for developing the method could be choosing an optimal choice of the relaxometry coefficient in each region. The paramagnetic separation component was highy correlated and repeatable in DGM, but diamagnetic separation had much lower repeatability particularly in WM. Future methods can explore corrections for WM angle to the main field, which may improve repeatability.Acknowledgements
No acknowledgement found.References
1. Shin HG, L. J. (2021). χ-separation: Magnetic susceptibility source separation toward iron and myelin mapping in the brain. Neuroimage.
2. Emmerich J, B. P. (2021). On the separation of susceptibility sources in quantitative susceptibility mapping: Theory and phantom validation with an in vivo application to multiple sclerosis lesions of different age. J Magn Reson.
3. Liu T, W. C. (2013). Nonlinear formulation of the magnetic field to source relationship for robust quantitative susceptibility mapping. Magn Reson Med, 467-476.
4. Ferdinand Schweser, A. D. (2011). Quantitative imaging of intrinsic magnetic tissue properties using MRI signal phase: An approach to in vivo brain iron metabolism. NeuroImage, 2789-2807.
5. McPhee KC, W. A. (2017). Transverse relaxation and flip angle mapping: Evaluation of simultaneous and independent methods using multiple spin echoes. Magn Reson Med, 2057-2065.
6. Jenkinson M, B. C. (2002). FSL. Neuroimage.
7. Manjón JV, C. P. (2016). volBrain: An Online MRI Brain Volumetry System. Front Neuroinform.
8. Oishi K, Z. K.-N. (2008). Human brain white matter atlas: identification and assignment of common anatomical structures in superficial white matter. Neuroimage, 447-57.
Figures
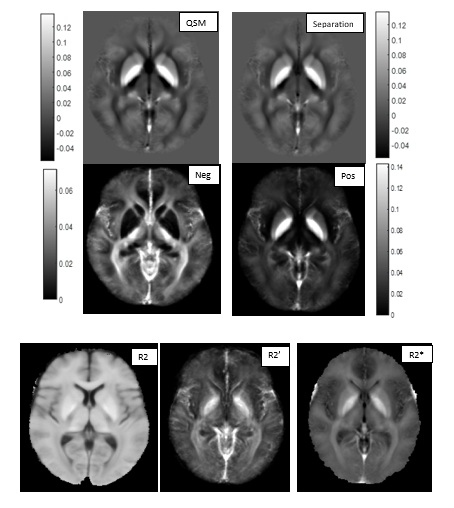
Figure 1: Conventional QSM and the total susceptibility map of the separation method (top row). The absolute value of negative (diamagnetic) and positive (paramagnetic) susceptibility separations are shown in middle row. Bottom row shows the relaxation maps, R2, R2’ and R2*. All the scales are ppm.
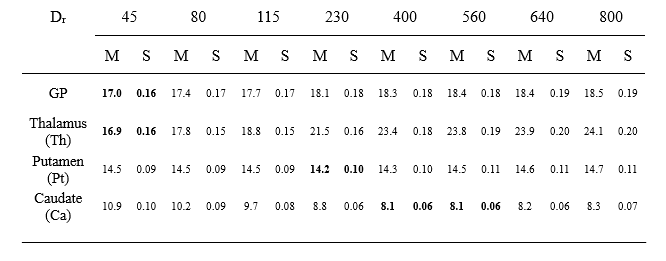
Table 1: Mean (M) relative difference error (%) and percent standard deviation (S) of paramagnetic maps over all subjects for different Dr values.
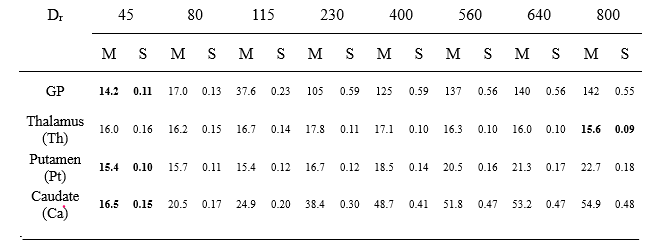
Table 2: Mean (M) relative difference error (%) and standard deviation (S) of diamagnetic maps over all subjects for different Dr values.
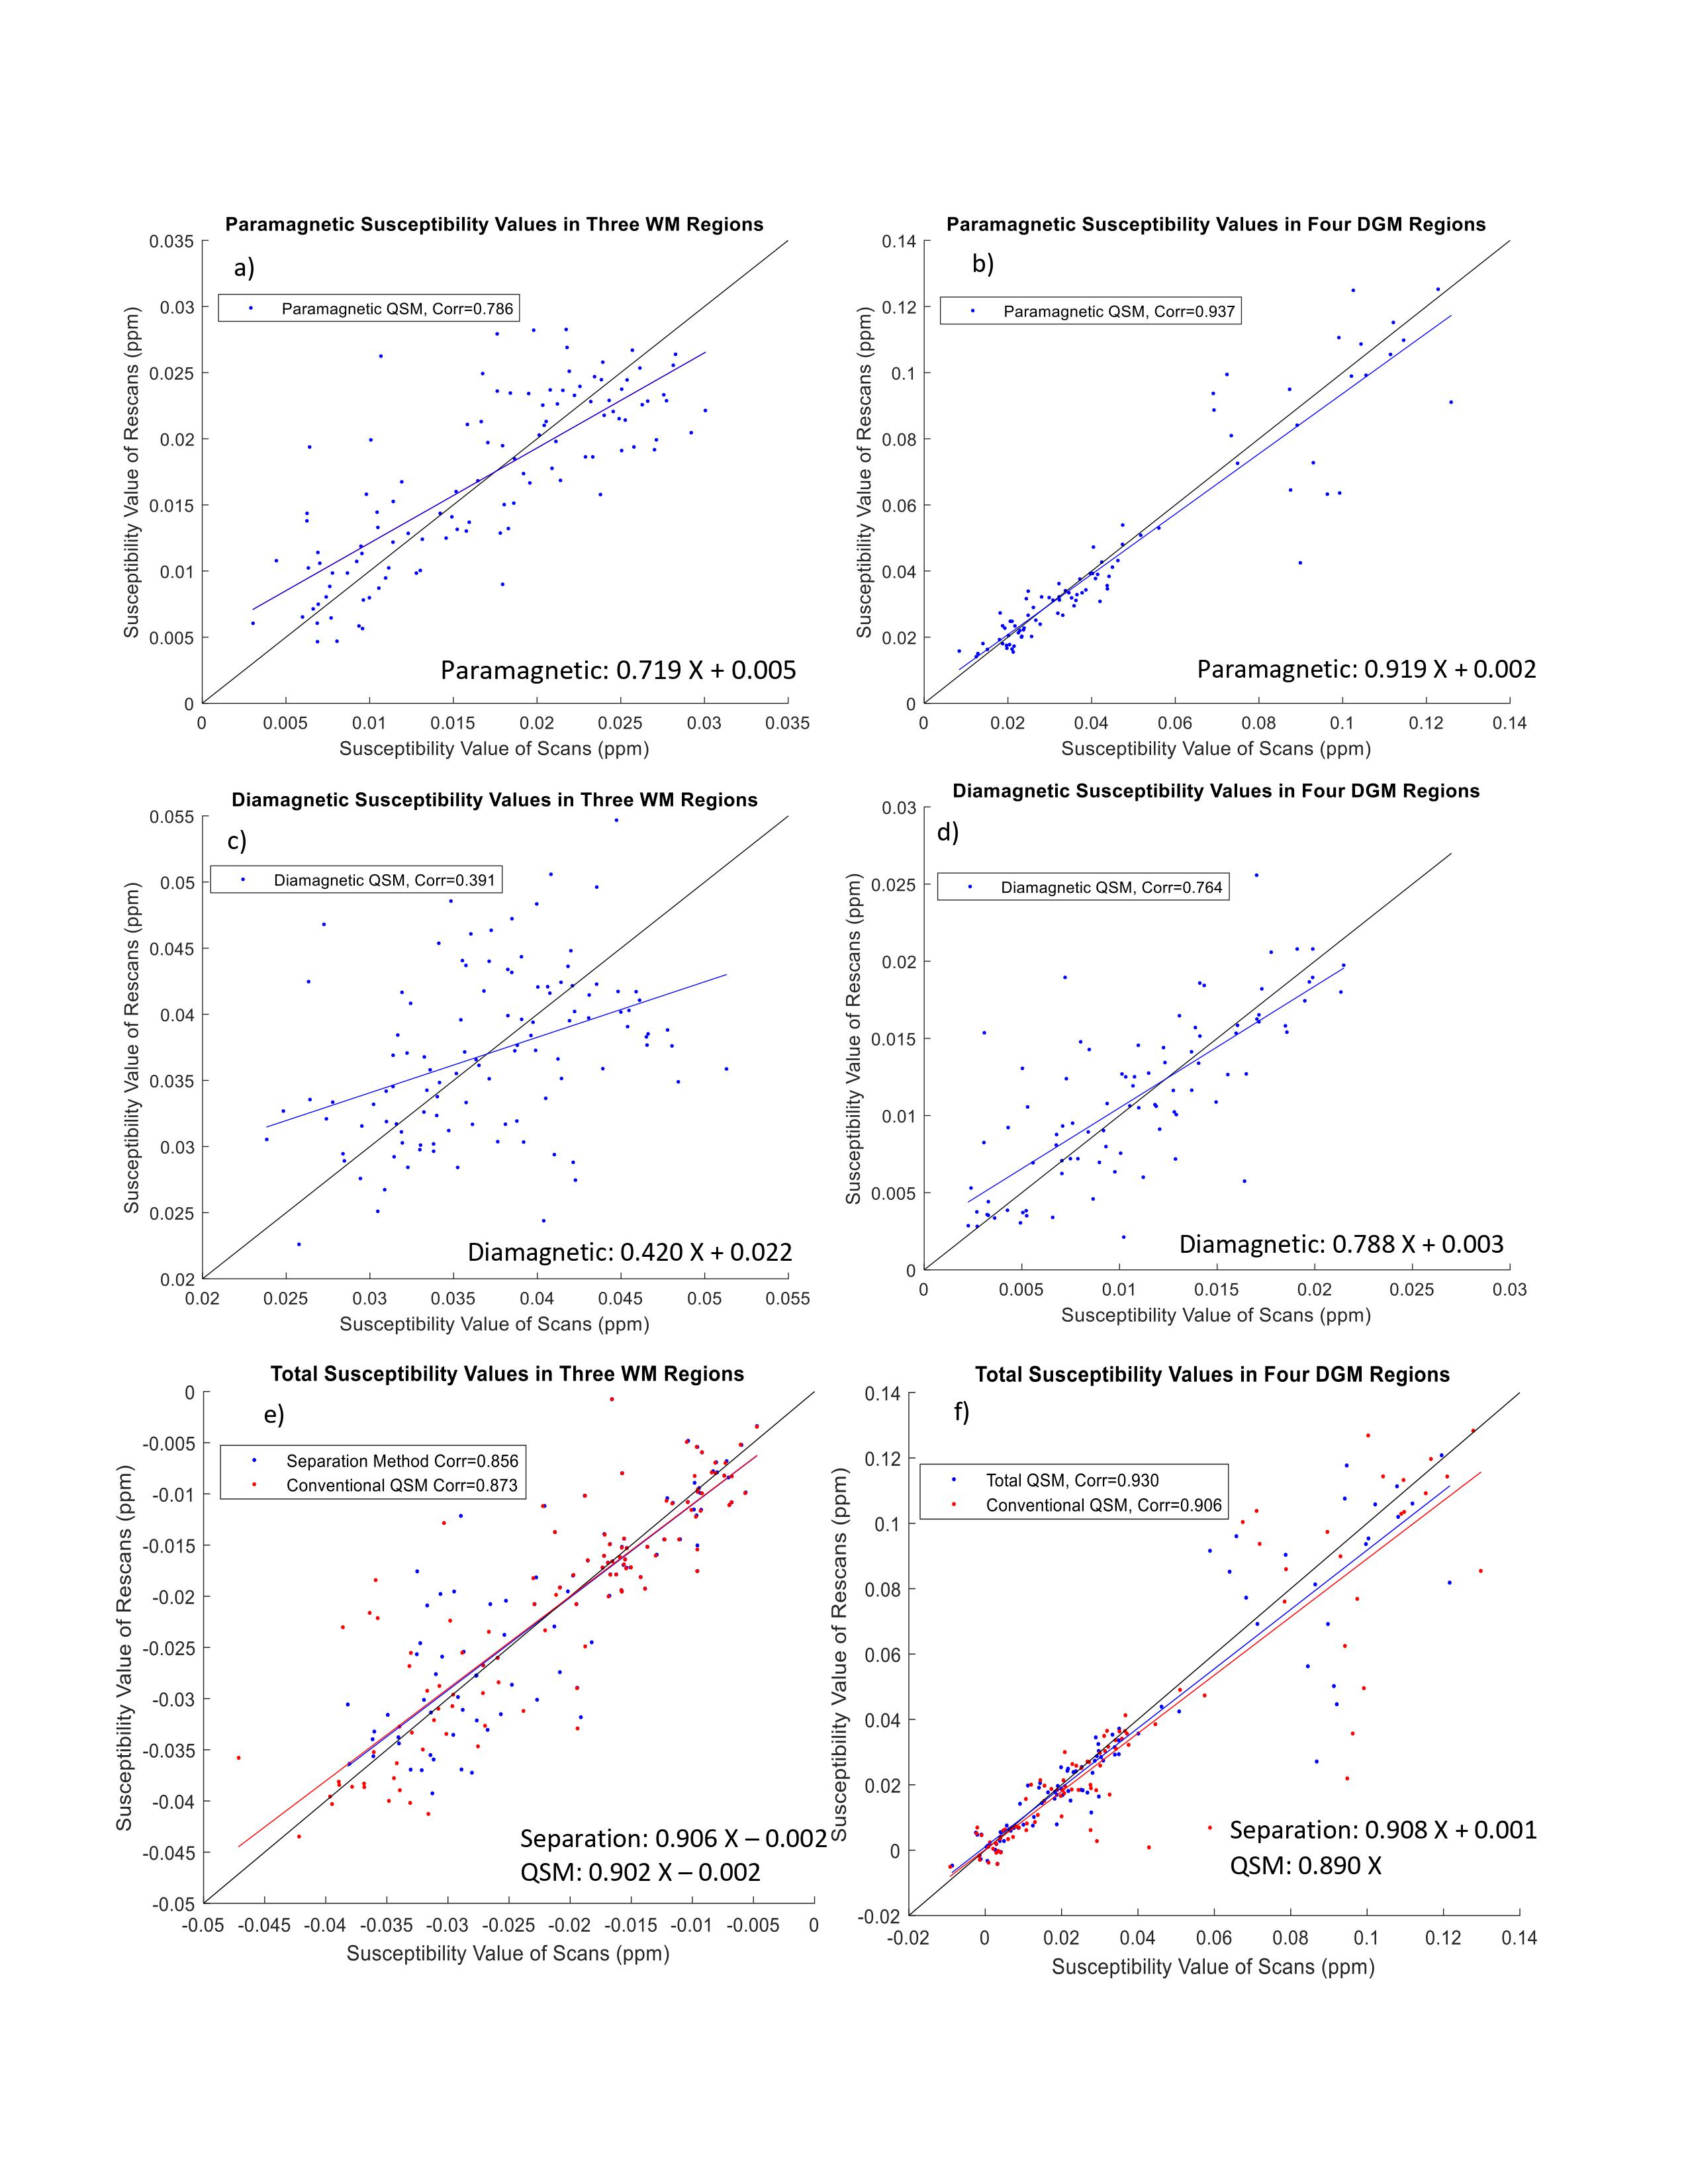
Figure 2: The susceptibility values of GP, Pt, Th and Ca in DGM has been plotted for scan and rescan of separation method for (a-d) absolute value of paramagnetic and diamagnetic components and (e-f) total separation QSM values and conventional QSM maps in DGM and WM (PIC, BCC and OR). The total QSM from the separation method shows slightly better correlation in DGM but worse in WM compared to conventional QSM.
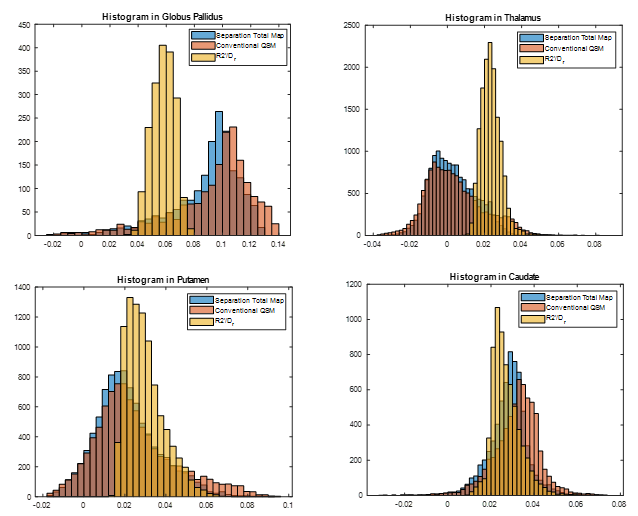
Figure 3: Histograms averaged across all subjects of total susceptibility of the separation method (blue), conventional QSM (red) and R2’ (yellow) that is divided by relaxometry coefficient. The separation method, due to its minimization problem, tries to reach to a distribution that satisfy both conditions. X axis units are ppm.