3554
Diffusion time dependence in the non-human primate brain1Vanderbilt University Institute of Imaging Science, Vanderbilt University Medical Center, Nashville, TN, United States, 2Chemical and Physical Biology Program, Vanderbilt University, Nashville, TN, United States, 3Department of Radiology and Radiological Sciences, Vanderbilt University Medical Center, Nashville, TN, United States, 4Department of Biomedical Engineering, Vanderbilt University, Nashville, TN, United States, 5Department of Physics and Astronomy, Vanderbilt University, Nashville, TN, United States
Synopsis
Time-dependent diffusivity is sensitive to microstructural geometry and has previously been described by a power-law scaling. However, the limits of validity of this relationship across different ranges of diffusion time are unclear. We therefore acquired brain images of nonhuman primates in vivo with diffusion times from 1.9 to 40 ms to assess how well a power-law fits diffusivity in this range. We assess fitting in the time and frequency domains, whether pulsed (PGSE) and oscillating (OGSE) gradient spin echo can be combined for better results, and the sensitivity of diffusivity estimates to varying power-law exponents.
Introduction
Time-dependent diffusion MRI is sensitive to microstructural geometry (e.g. cell or axon size, density, and packing configuration) and such information is not obtainable by other imaging methods. The relationship between the time-dependent diffusion coefficient $$$D(t_{diff})$$$ and effective diffusion time $$$t_{diff}$$$ is complex, however, and theoretical expressions relating them require a priori assumptions about the underlying microstructure. For $$$t_{diff}\rightarrow0$$$, Mitra et al.1 have shown $$$D(t_{diff})\sim\sqrt{t_{diff}}$$$, while for $$$t_{diff}\rightarrow\infty$$$ Novikov et al.2 have shown a power-law relation can describe the $$$t_{diff}$$$ dependence as $$D(t_{diff})=D_\infty+const\cdot t_{diff}^{-\theta}\quad(1)$$where $$$D_\infty$$$ is the long diffusion time limit, $$$\theta=(p+d)/2$$$, $$$d$$$ is the dimension and $$$p$$$ is the structural exponent determined by the spatial correlation of restrictions.
Using STEAM acquisitions for long $$$t_{diff}$$$ up to 600 ms , Fieremans et al.3 reported values of $$$\theta$$$ as 1 and 1/2 for radial (RD) and axial (AD) diffusivities, respectively, in healthy human white matter, which indicates different dominating structures in orthogonal directions.
In addition to the time domain analysis, diffusivity in the frequency domain may be described as: $$D(f)=D_0+DDR\cdot f^\theta\quad(2)$$
where $$$f\sim1/t_{diff}$$$ and $$$DDR$$$ is the diffusion dispersion rate. This analysis is particularly suitable for OGSE, where mean diffusivity (MD) has shown both $$$\theta=1/2$$$ and $$$\theta=1$$$, seemingly dependent on whether a measured PGSE value approximating $$$f=0$$$ is included4,5. However, it is questionable whether Eq. 2 is valid in the diffusion time regime used. Moreover, there are a few other questions that remain unanswered: (1) is the power-law fitting reliable with a narrow frequency range in practice? (2) Can PGSE diffusivity be considered as the limiting value of $$$D(f\rightarrow0)$$$ in the power-law fittings? If so, (3) can the $$$t_{diff}$$$ of measured values bias the fittings?
To answer these questions, DTI data with a broad practical range of $$$t_{diff}$$$ (OGSE frequencies 50-133 Hz and PGSE $$$t_{diff}$$$ 10-40 ms) were acquired from non-human primate brains. MD/RD/AD were fit using a power-law with different $$$t_{diff}$$$ ranges. The results provide better understanding of power-law based $$$t_{diff}$$$ dependence in neural tissues.
Methods
Four squirrel monkeys were imaged using an Agilent/Varian 9.4T small animal scanner. Diffusion-weighted echo-planar images were acquired using TR/TE=5000/56 ms, transverse FOV 6.4x6.4 cm2 and voxel size 1 mm3 isotropic. Reverse phase-encoded images with no diffusion preparation were acquired for susceptibility distortion correction. Each diffusion time had identical gradient tables comprising 32 uniformly spaced directions in pairs of parallel and antiparallel vectors with b=700 s/mm2 and five b=0 s/mm2 interleaved throughout, for a total of 69 acquisitions per diffusion time. 8 diffusion preparations were used: 4 PGSE with δ=3 ms and ∆=11, 21, 31, and 41 ms; and 4 trapezoidal cosine OGSE with $$$f$$$=50, 67, 100, and 133 Hz acquired with δ=15 ms, ∆=19 ms, ncycle=1, 2 and δ=20 ms, ∆=24 ms, ncycle=1, 2. One subject also included 150 and 200 Hz with b=325, 180 (respectively); these points were not used in any fitting due to a differing b-value but are shown for comparison. Representative OGSE and PGSE images are shown in Figure 1.The diffusion-weighted images were corrected for noise and Gibbs artifacts using MRTrix3 and for susceptibility and eddy-current distortions using FSL. Corrected intra-subject images were co-aligned by linear registration with FSL. The VALiDATe29 squirrel monkey brain atlas6 was registered to the mean b=0 image of each volume using nonlinear diffeomorphic registration with ANTS. Two ROIs in gray matter (the prefrontal (PFC) and visual (V1) cortex) and four ROIs in white matter (the body (BCC), genu (GCC), and splenium (SCC) of the corpus callosum and the gyrus of the internal capsule (ICg)) were identified for analysis using the VALiDATe29 labels.
Results
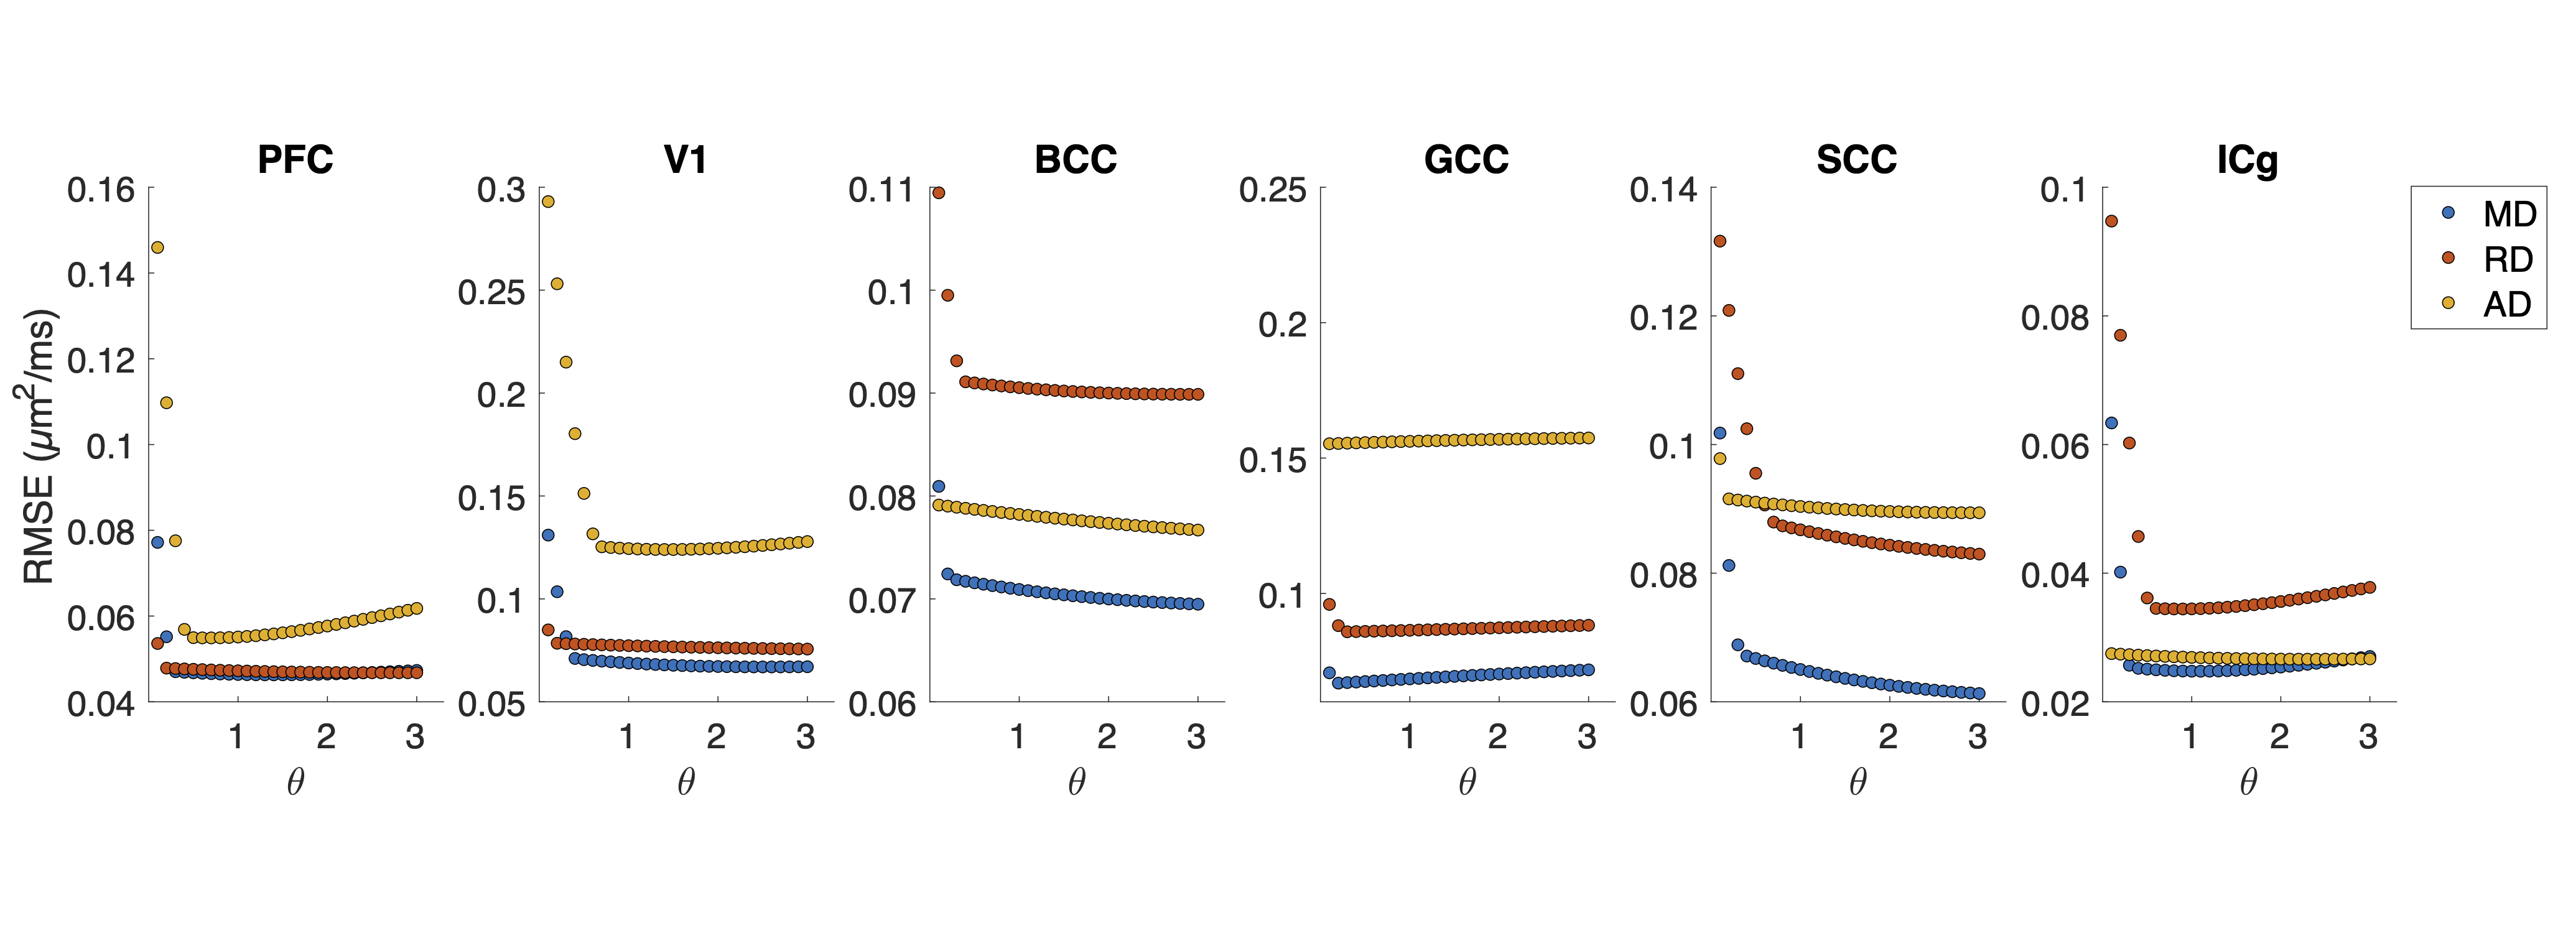
ROI-averaged DTI fits in the diffusion time domain (Eq. 1) are shown in Figure 2. Figure 3 shows power law (Eq. 2) fits for two sets of frequency domains: OGSE data from 50-133 Hz and 0-133 Hz using the 40 ms PGSE to approximate 0 Hz. Figure 4 shows power law fits assessing the impact in which PGSE data approximate as 0 Hz. Finally, Figure 5 shows the impact of different fixed values of $$$\theta$$$ on the goodness of fit (RMSE).Discussion and Conclusion
This study shows that power law fitting in an intermediate diffusion time regime is not trivial. Fits using both Eq. 1 and 2 yield high variance between regions and values of $$$\theta$$$ greater than would be physiologically expected in terms of dimensionality and order, indicating the fitting range may be outside the long $$$t_{diff}$$$ regime assumed in the model. Figure 5 indicates this may be due to the fitting landscape – in this range of frequencies, the data are insensitive to the choice in power and therefore inverting Eq. 2 has low precision. The slope of Figure 4 indicates that, though inclusion of PGSE may stabilize the variance of $$$\theta$$$, approximating PGSE as 0 Hz may bias the fit. In conclusion, our results do not support the translation of the power-law fits derived from long $$$t_{diff}$$$ regimen to an intermediate regime (1.9 – 40 ms). The high variance in power-law fits suggests that the power-law fitted $$$\theta$$$ may not be a reliable indicator to the underlying microstructure, and caution should be taken when interpreting the power-law fitted $$$t_{diff}$$$-dependent data with intermediate $$$t_{diff}$$$ regime.Acknowledgements
No acknowledgement found.References
1. P. P. Mitra, P. N. Sen, and L. M. Schwartz, “Short-time behavior of the diffusion coefficient as a geometrical probe of porous media,” Physical Review B, vol. 47, no. 14, p. 8565, Apr. 1993
2. D. S. Novikov, J. H. Jensen, J. A. Helpern, and E. Fieremans, “Revealing mesoscopic structural universality with diffusion,” Proceedings of the National Academy of Sciences of the United States of America, vol. 111, no. 14, pp. 5088–5093, Apr. 2014
3. E. Fieremans, L. M. Burcaw, H. H. Lee, G. Lemberskiy, J. Veraart, and D. S. Novikov, “In vivo observation and biophysical interpretation of time-dependent diffusion in human white matter,” NeuroImage, vol. 129, pp. 414–427, Apr. 2016
4. A. Arbabi, J. Kai, A. R. Khan, and C. A. Baron, “Diffusion dispersion imaging: Mapping oscillating gradient spin-echo frequency dependence in the human brain,” Magnetic Resonance in Medicine, vol. 83, no. 6, pp. 2197–2208, Jun. 2020
5. E. T. Tan et al., “Oscillating diffusion-encoding with a high gradient-amplitude and high slew-rate head-only gradient for human brain imaging,” Magnetic Resonance in Medicine, vol. 84, no. 2, pp. 950–965, Aug. 2020
6. K. G. Schilling et al., “The VALiDATe29 MRI based multi-channel atlas of the squirrel monkey brain,” Neuroinformatics 2017 15:4, vol. 15, no. 4, pp. 321–331, Jul. 2017
Figures
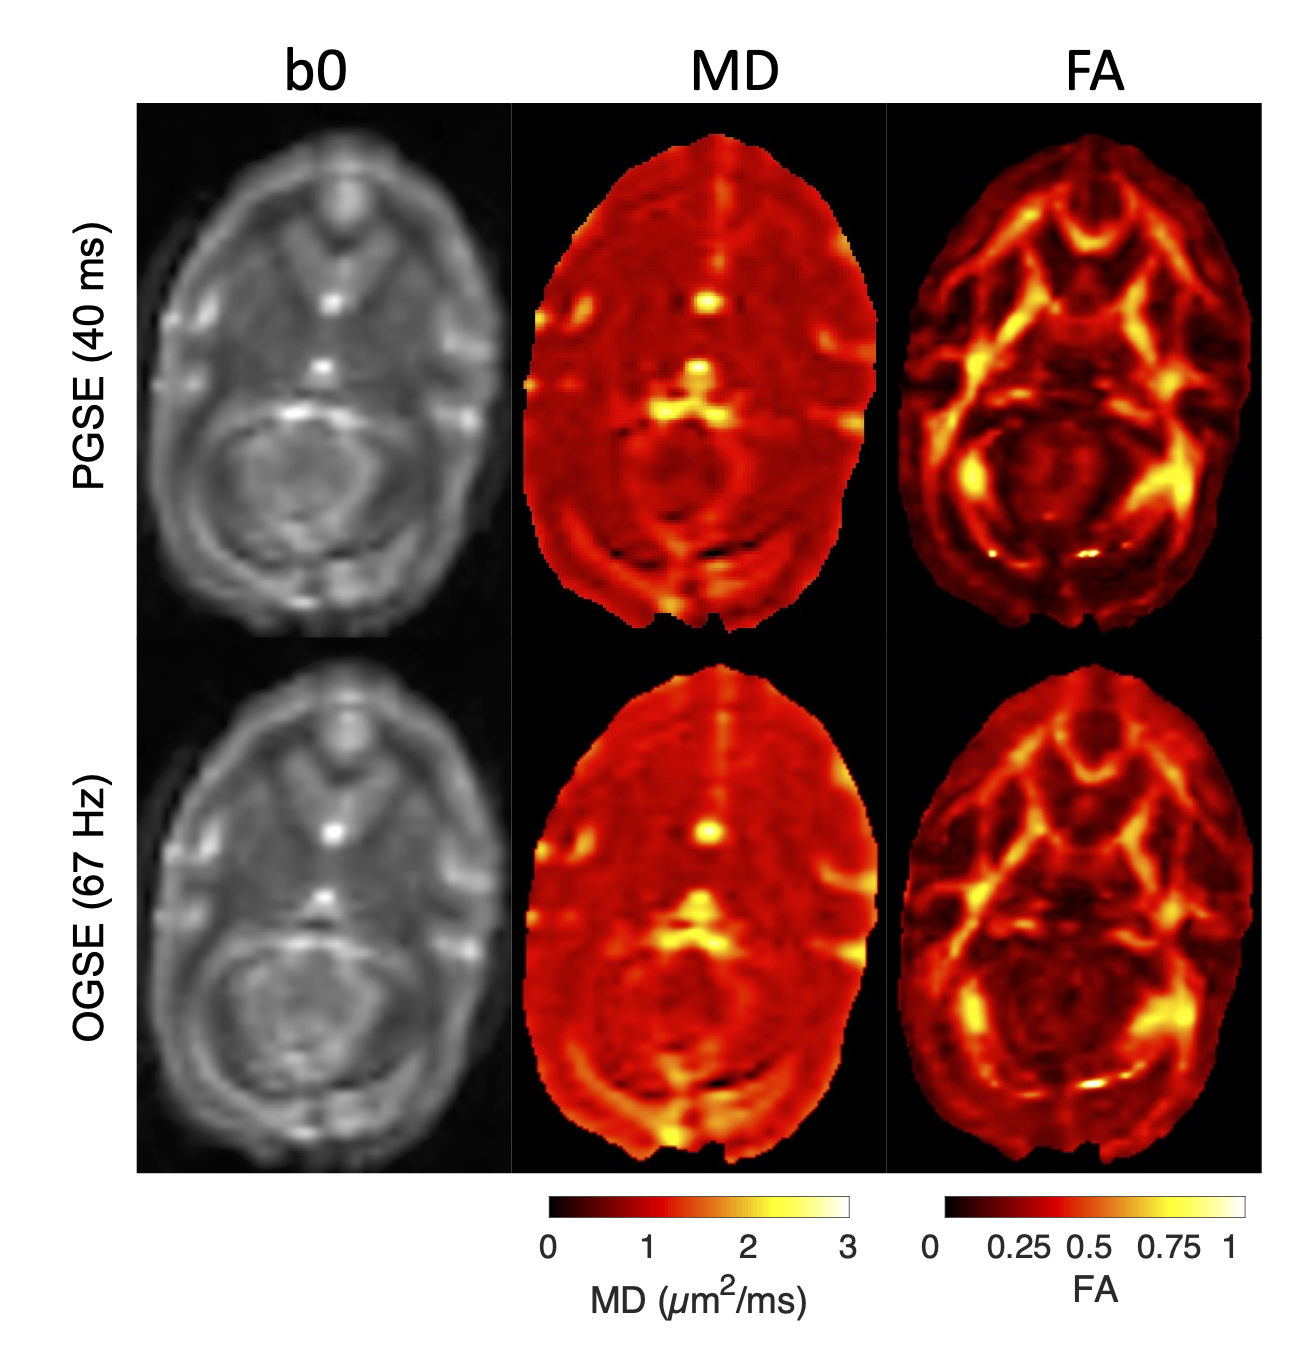
Figure 1. Example images of PGSE (top) and OGSE (bottom) fits for b=0 (left), MD (center), and FA (right).
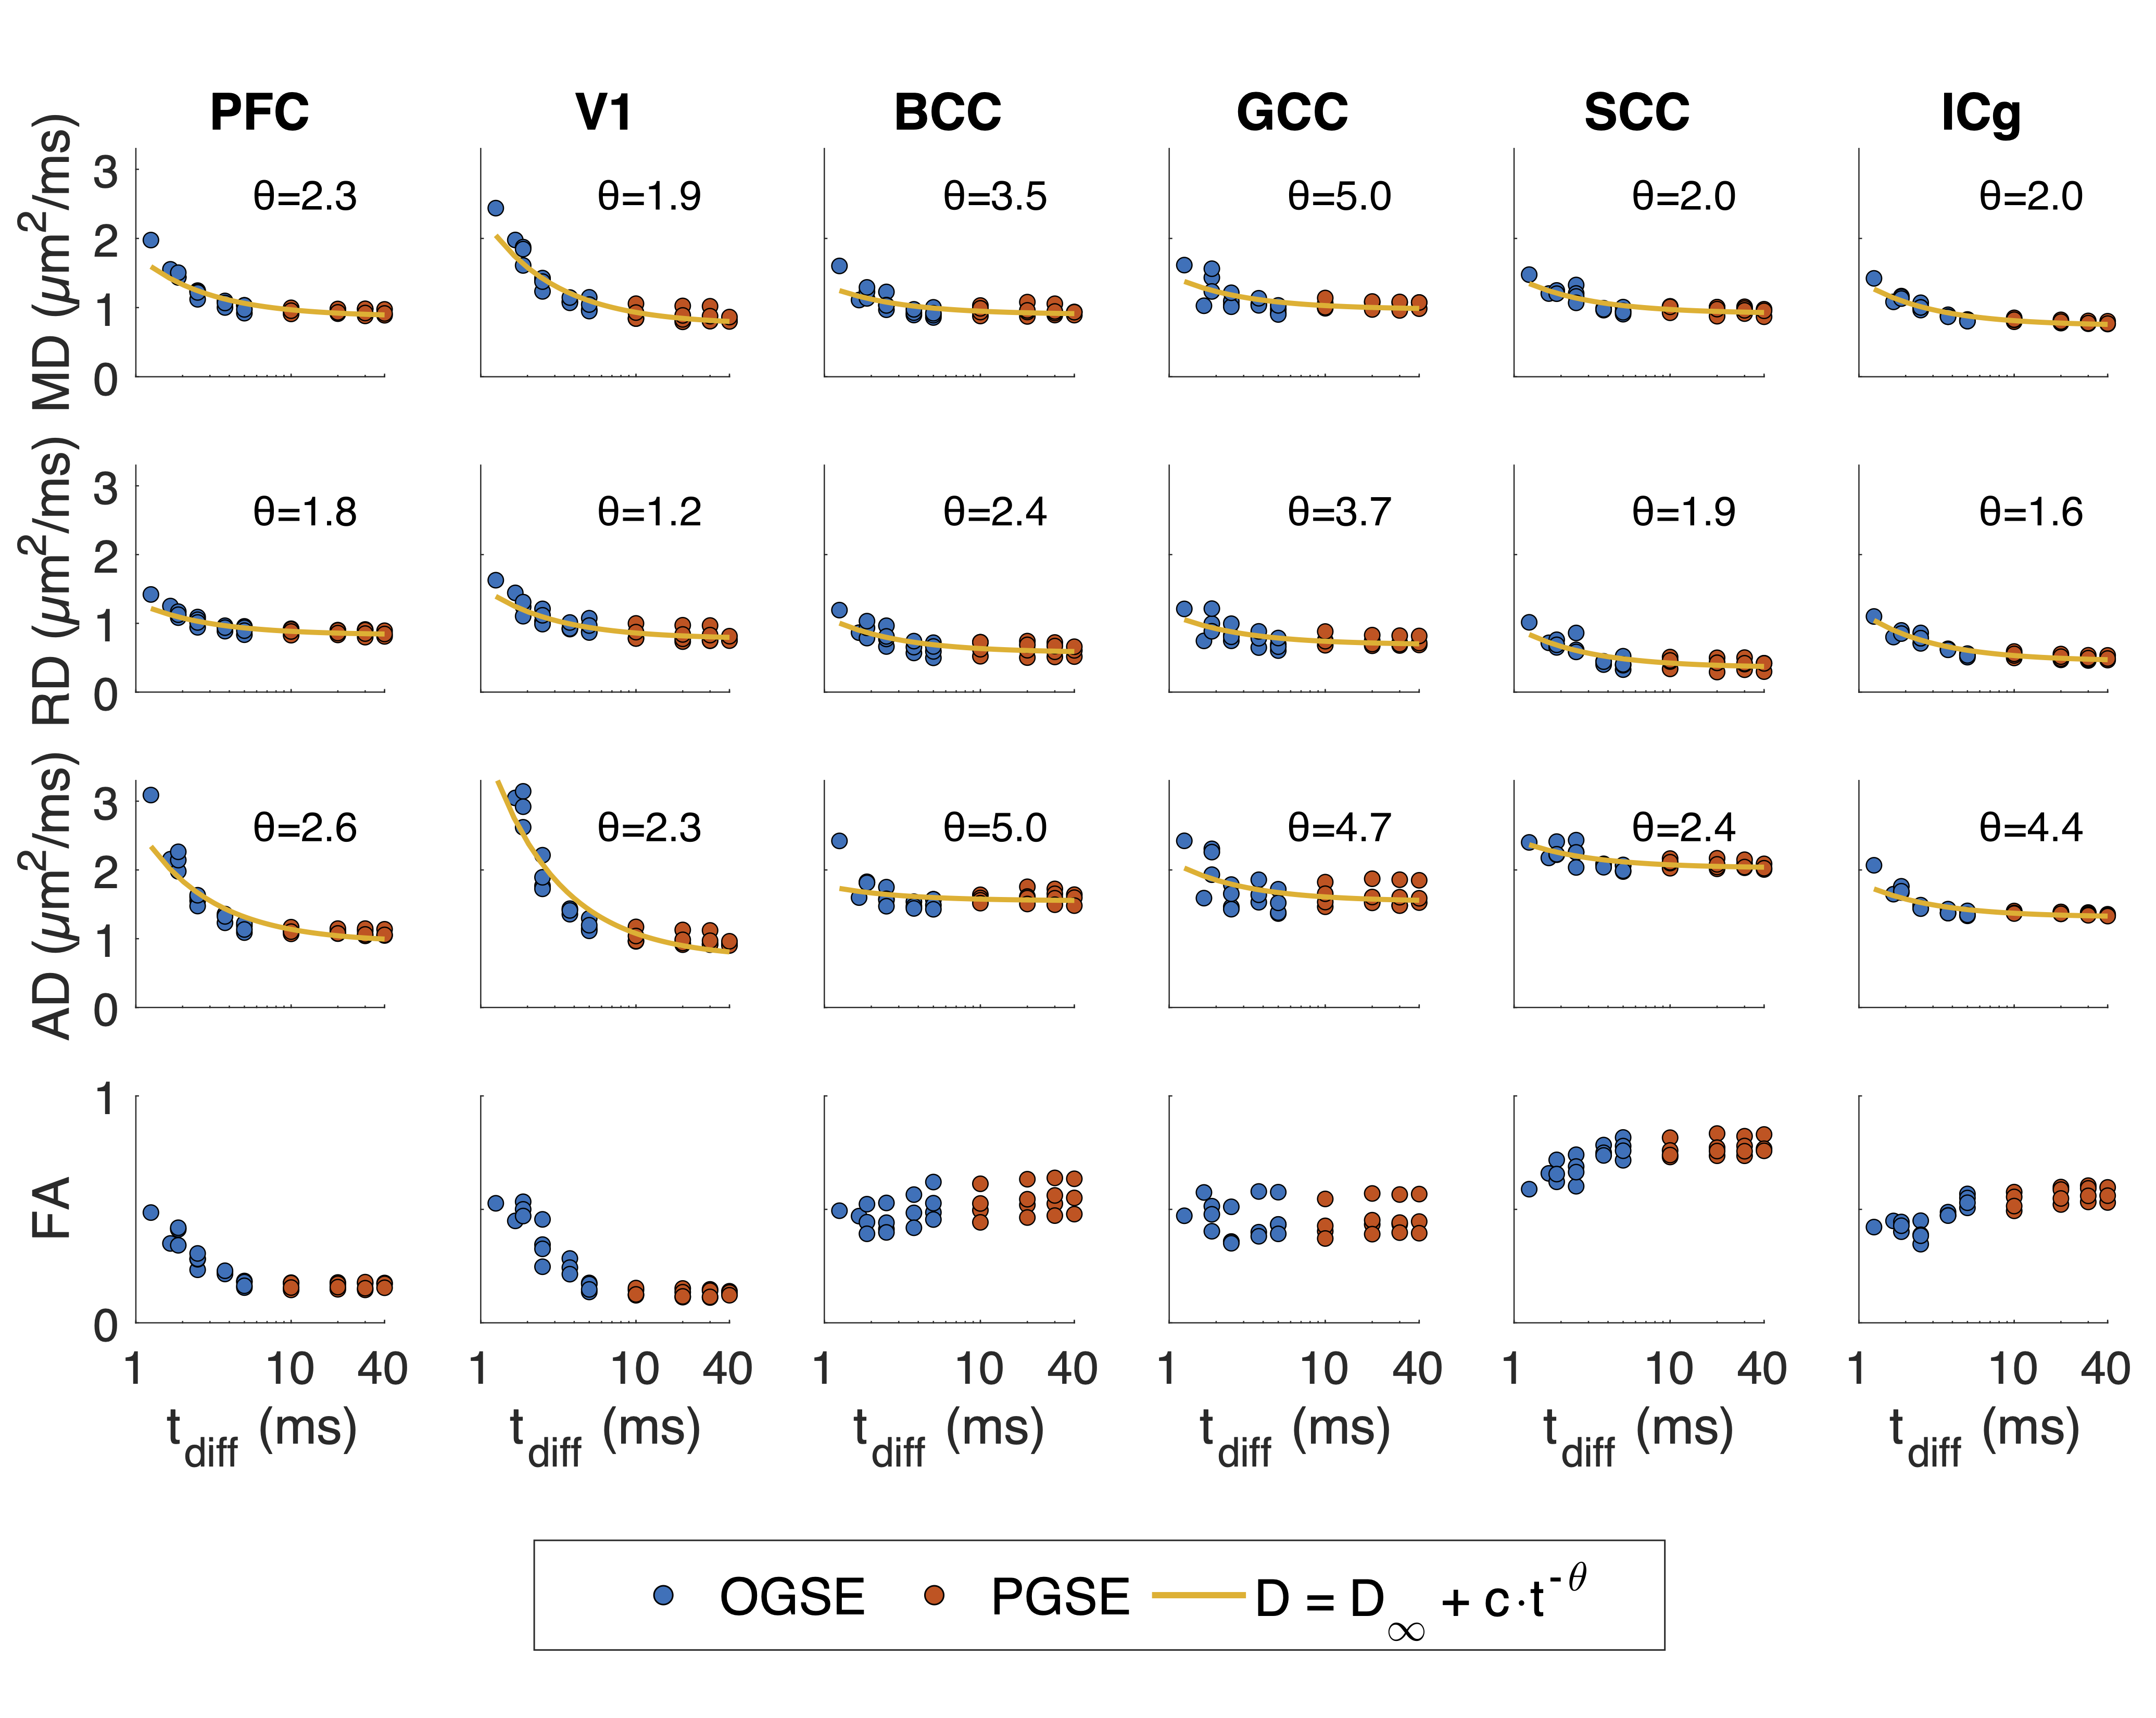
Figure 2. DTI fitting for all four subjects in 6 regions against diffusion time. Fits for data representations as power law scaling (Eq. 1) are shown for the diffusivity estimates AD, RD, and MD.
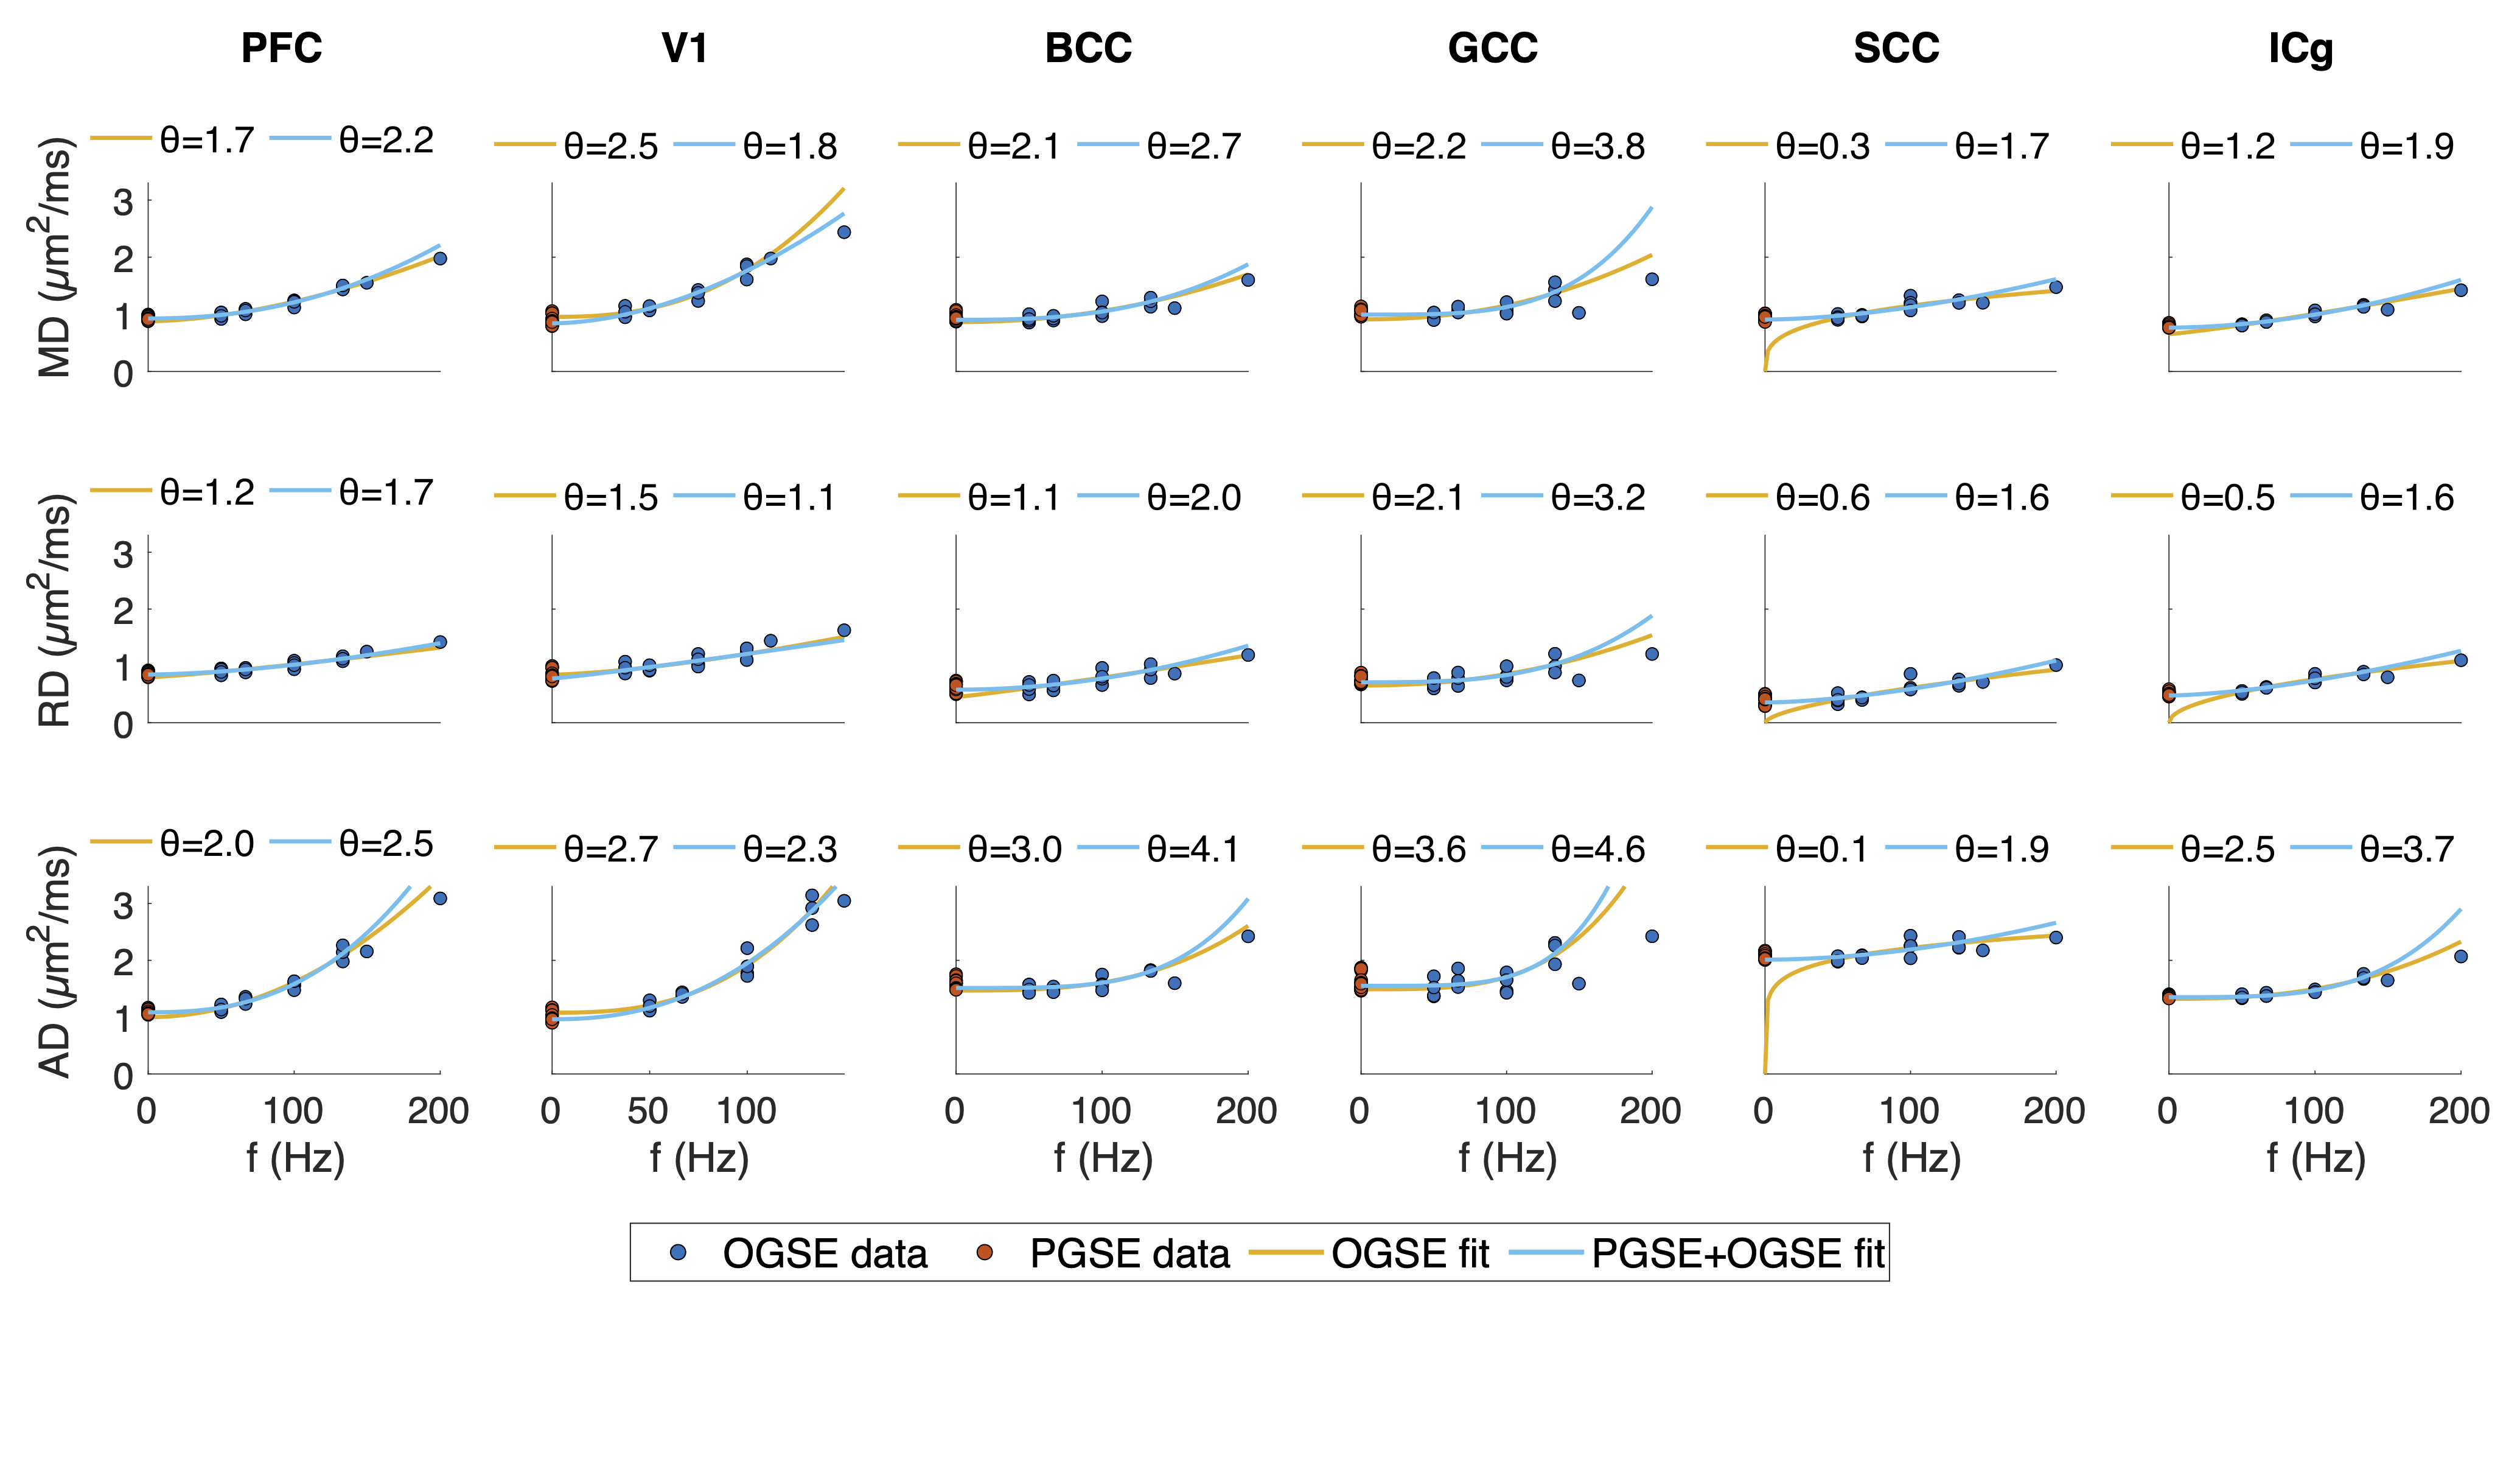
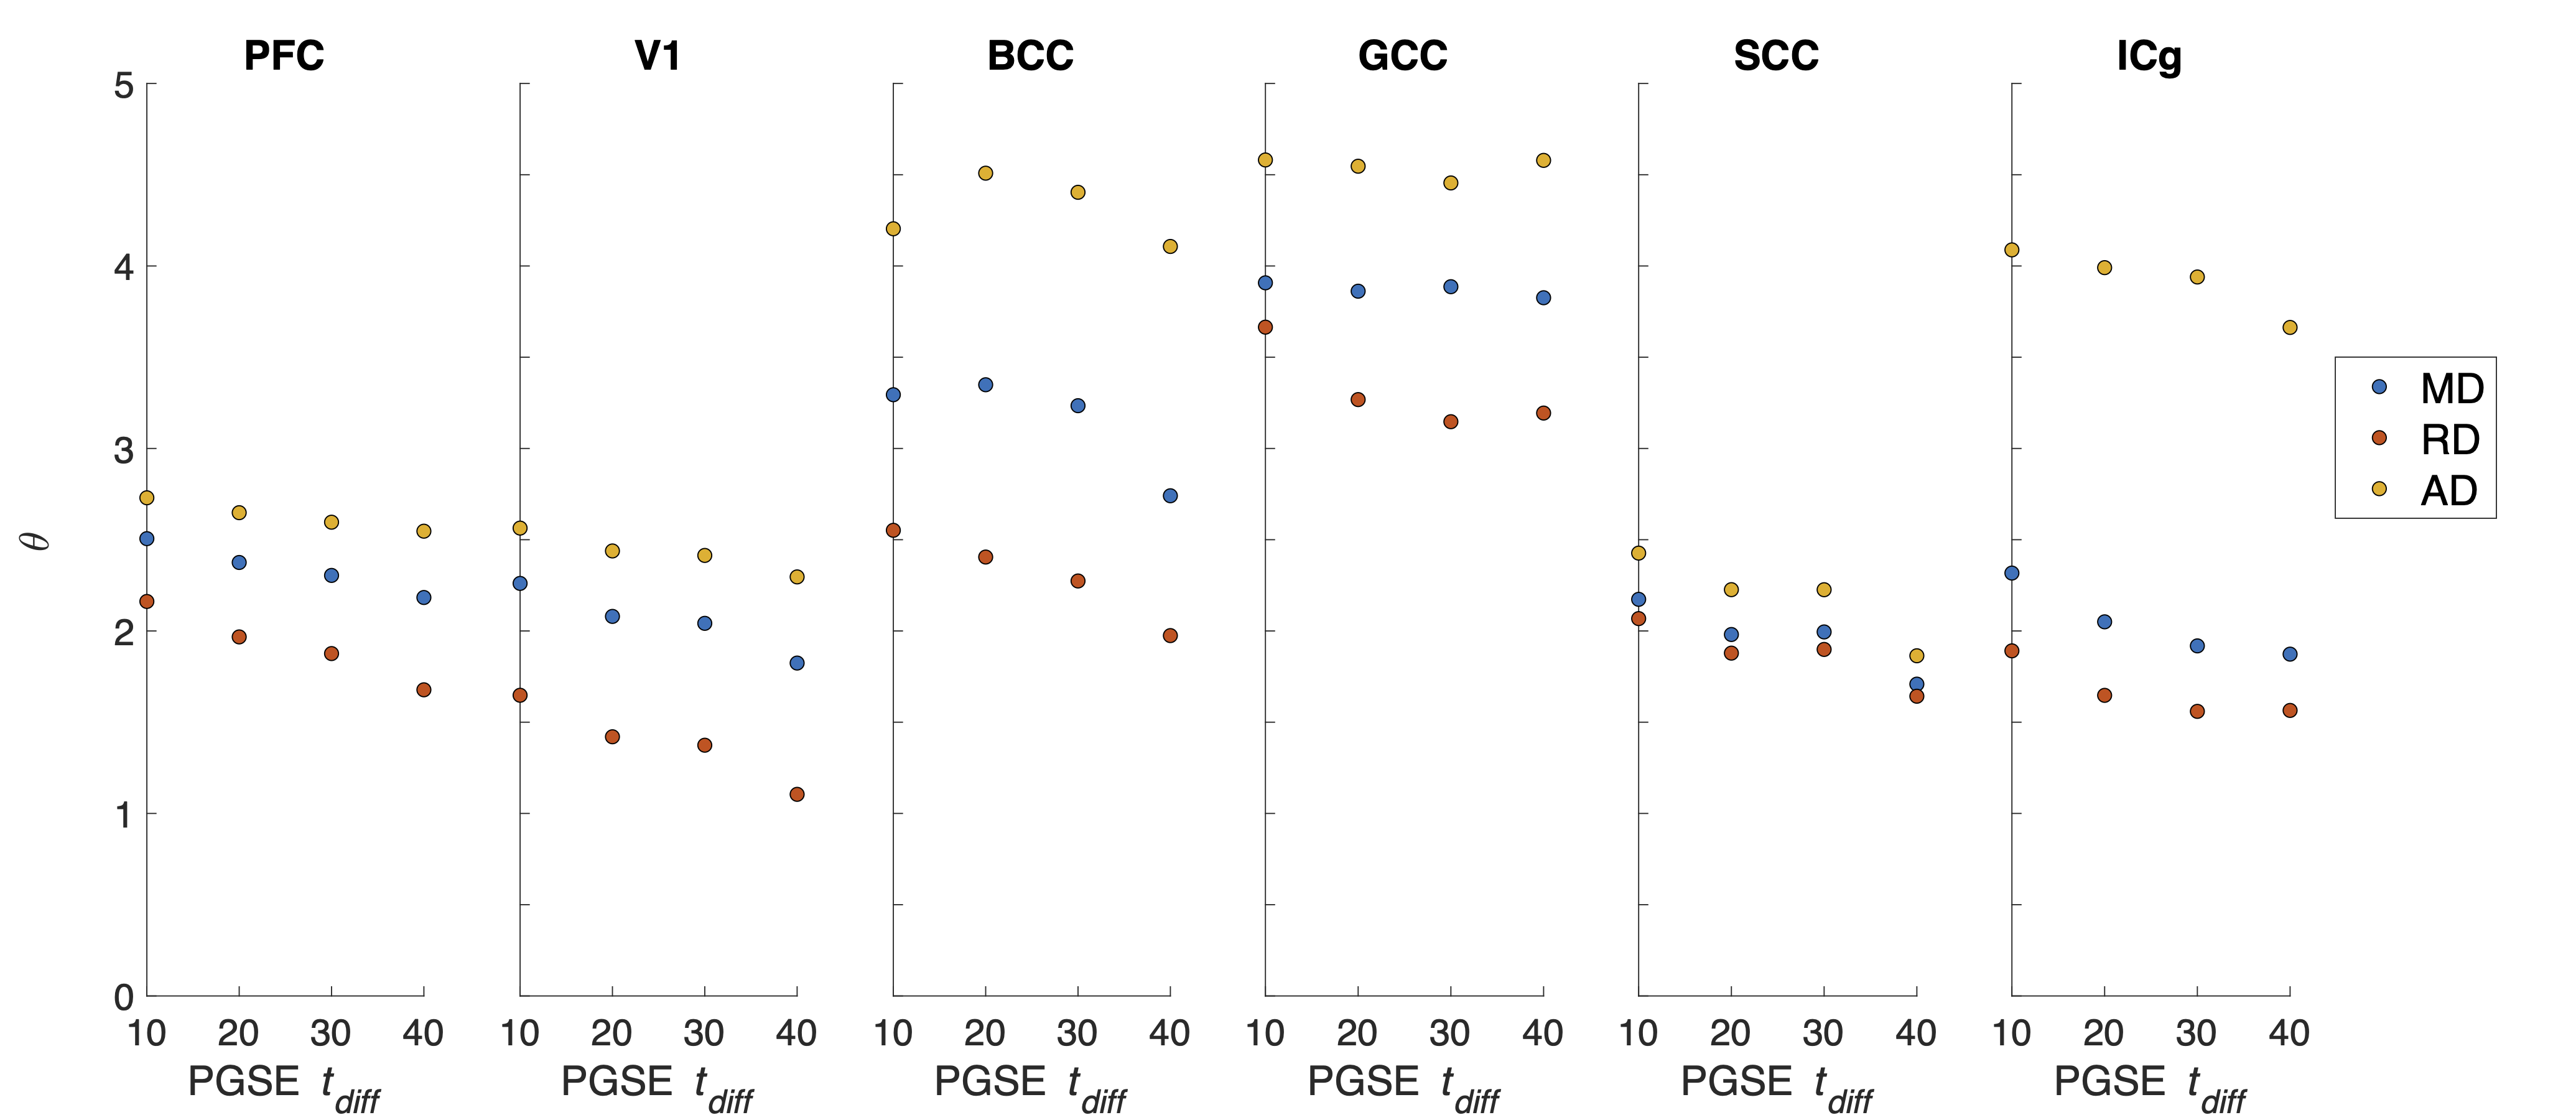
Figure 3. Data fitting on the frequency domain. Power law fits using only OGSE and combined OGSE and PGSE are shown. The OGSE domain was [50 133] Hz and one PGSE point (40 ms) was assigned 0 Hz for the fitting.