3551
Tractography from Gaussian multi-compartmental ODFs1Université de Sherbrooke, Sherbrooke, QC, Canada, 2Centro de Investigación en Matemáticas A.C., Guanajuato, Mexico, 3Universidad Nacional Autónoma de México, Querétaro, Mexico, 4New York University School of Medicine, New York, NY, United States
Synopsis
In this study, we propose a pipeline to compute the structural connectome from diffusion-weighted magnetic resonance imaging (dMRI). The pipeline is based on a novel method called MRDS, which computes independent Gaussian profiles per intravoxel diffusion compartments. The effectiveness of our pipeline is shown on the DiSCo challenge synthetic dataset. Our findings show that the pipeline is competitive and outperforms a pipeline based on constrained spherical deconvolution (CSD).
Introduction
Most of the pipelines in the state-of-the-art use Constrained Spherical Deconvolution (CSD)11 to recover, at each voxel, the fiber Orientation Distribution Function (fODF). Multi-Resolution Discrete-Search (MRDS)1 is a method designed to estimate, at each voxel, an individual tensor-model per bundle, which also provides robust per bundle diffusivity profiles. Multi-tensors provided by MRDS can be used to compute the diffusion Orientation Distribution Function (dODF) for every voxel using4. The aim of this work is to show that MRDS accurate reconstruction of the dODFs carries out an improvement in the tractography results.Methods
Dataset: The methodology was tested on the training dataset of the DiSCo challenge7. The dataset is a synthetic phantom simulated from an large set of strands of 15um of diameter, with both endpoints located in 16 regions of interest (ROIs). The DW-MRI signal was simulated using the open source MC/DC Monte Carlo diffusion and collision simulator14 with an unrestricted diffusion coefficient of 0.6e-3 mm^2/s. Images have a total of 64,000 voxels (40x40x40). The diffusion protocol includes 360 diffusion-weighted images and 4 non-diffusion-weighted images (b=0 s/mm^2). The diffusion-weighted measurements are distributed over 4 shells (b=1000, 1925, 3094 and 13191 s/mm^2) and each shell was sampled using 90 uniformly distributed gradient directions on the sphere.The methodology is structured in 5 stages. The stages are described in sequential order as following:
1.Denoising: Using MRtrix36,15.
2.Rician Bias Correction: Applying Gudbjartsson's scheme5.
3.Local Modelling: We used the MRDS method1. After fitting the model, a multi-tensor field (MTF) is obtained. Then, from the output of MRDS the ODFs can be computed4 as
$$ODF(n)=\sum_{i}^{N} \alpha_{i}\frac{ (n^{T} D_{i}^{-1} n )^{-3/2}}{4\pi\sqrt{ det(D_{i}) }}$$
where $$$D_i$$$ and $$$\alpha_{i}$$$ are the diffusion tensor and its compartment size associated with the i-th fiber bundle. On the other hand, for comparison we used the muti-shell multi-tissue version of the classic CSD method11 implemented on the MrTrix framework6.
4.Tractography Algorithm: We used the iFOD22 algorithm implemented in the widely used MrTrix6 framework version 3.0. All parameters were set to the default values, except the cutoff parameter (cutoff=0.1 for CSD and cutoff=0.05 for MRDS). Output tractogram has 1M streamlines randomly seeded in the white matter.
5.Tractograpy Filtering: The posprocessing of the tractogram is divided into 3 steps.
- A home-made python implementation that removes streamlines not connecting 2 ROIs and streamlines connecting a ROI with itself.
- Finally, the resulting tractogram is given as input for COMMIT3, which aims to remove streamlines that do not reconstruct the diffusion weighted signal (mostly associated with false connections).
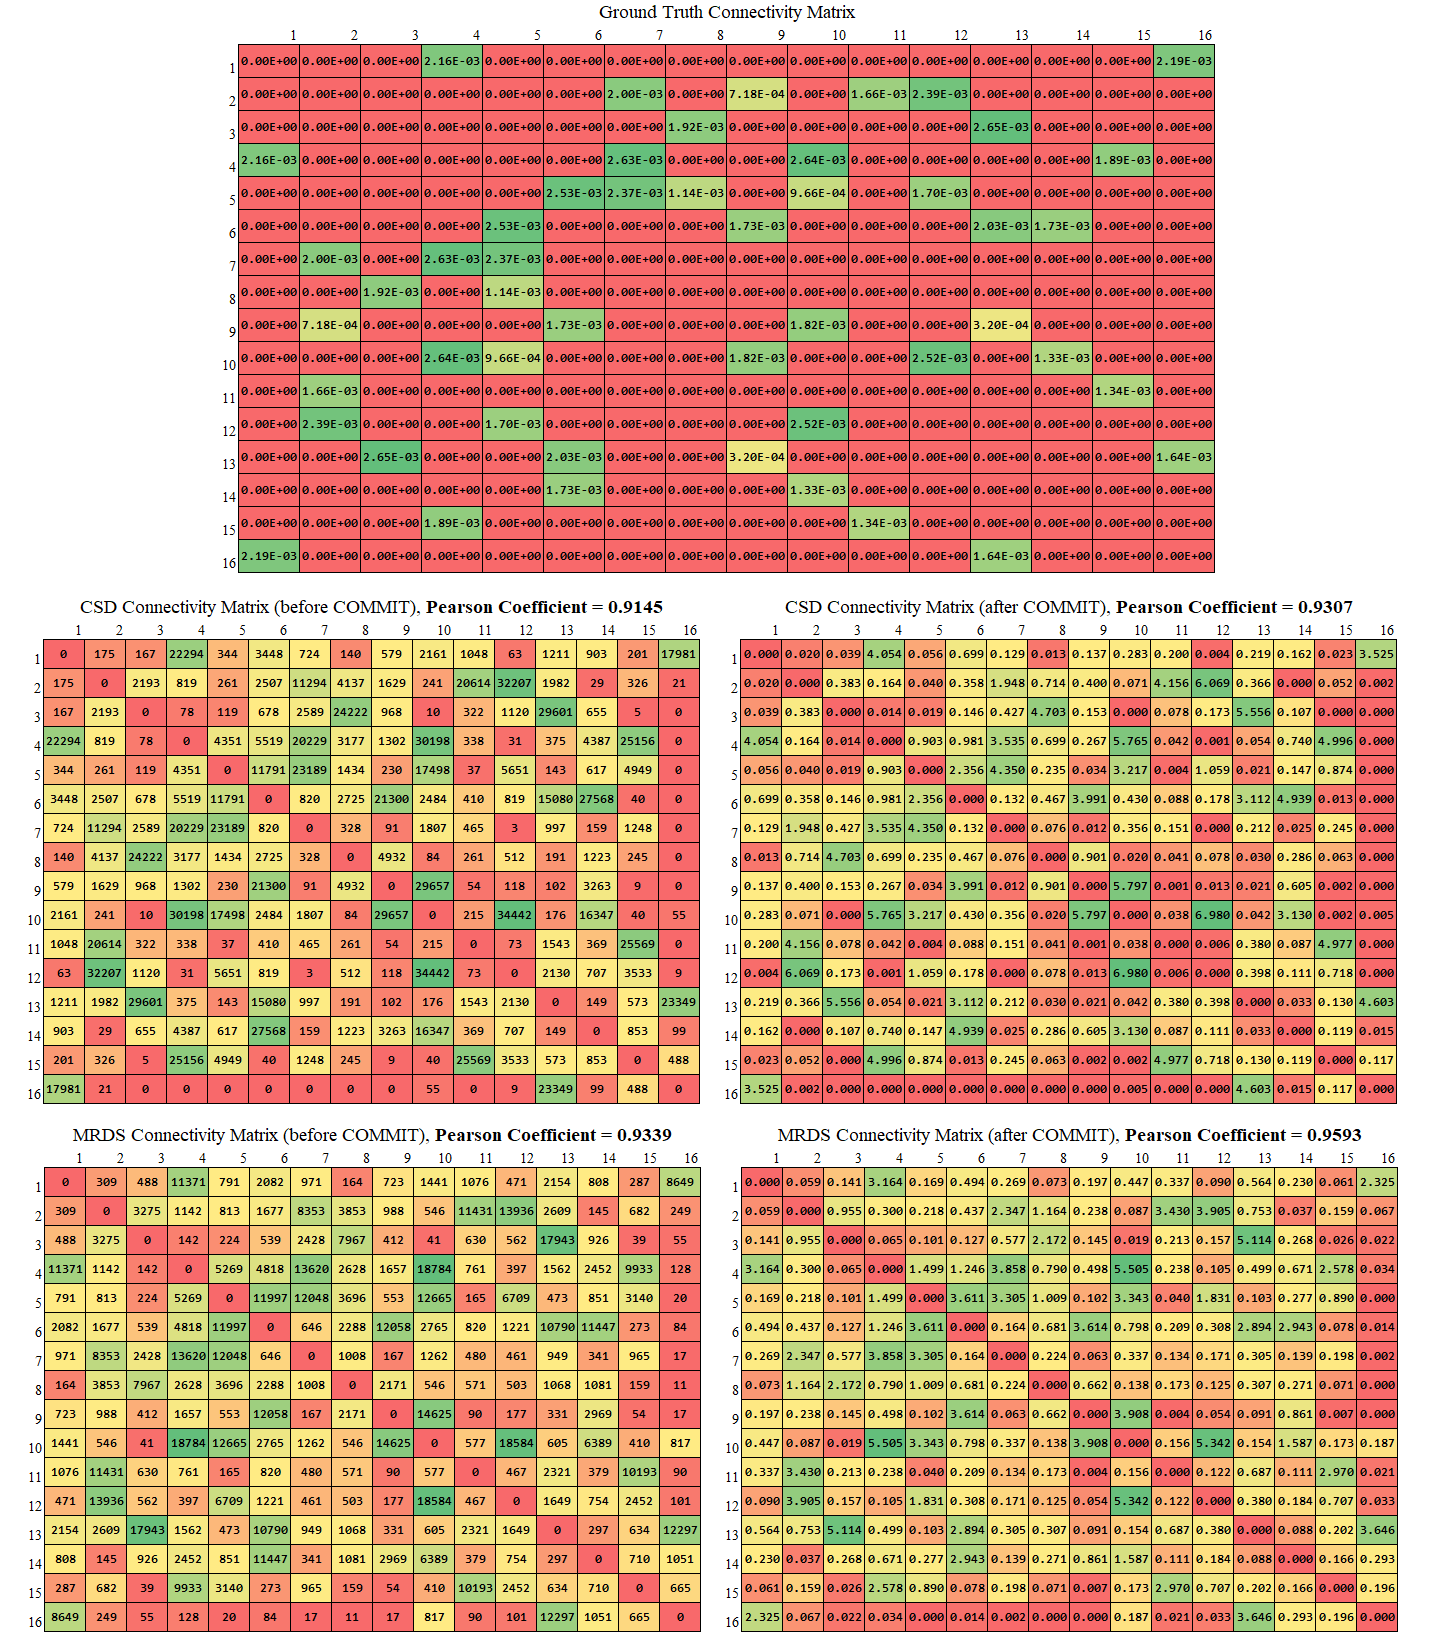
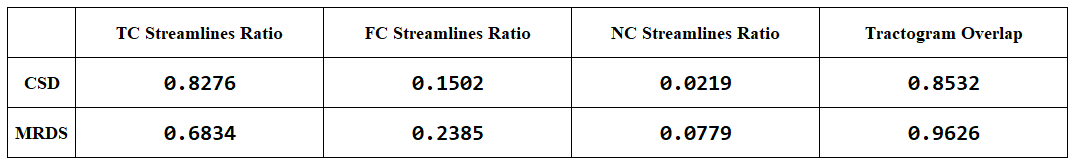
Metrics: In order to compare the MRDS and CSD-based pipelines, 5 metrics were calculated. Using8,9 the tractograms were segmented into true connection (TC), false connection (FC) and no connection (NC) streamlines for computing the TC, FC and NC streamlines ratio, which account for the number of TC, FC and NC streamlines divided by the total number of streamlines. The overlap value between each tractogram and the Ground-Truth (GT) was calculated, which is the proportion of the voxels within the volume of a GT bundle that is traversed by at least one valid streamline associated with the bundle. This value shows how well the tractogram recovers the original volume and shape of the bundle (ranging between 0 and 1). Finally, the estimated connection strength between any two ROIs will be compared by using the Pearson correlation coefficient. Pearson correlation is compared between the connectivity matrices obtained with the MRDS and CSD-based pipelines and the GT connectivity matrix.
Results and Discussion
The GT and reconstructed dODFs for each method are presented in Fig.1. MRDS shows a better estimation of the dODFs compared to CSD, but MRDS overestimates the number of orientations per voxel. Although this leads to a lower TC ratio in MRDS as it is shown in Fig.2 and Fig.4, these ratios are not the best choices for connectivity analysis purposes8. Besides, the Pearson correlation of the MRDS-based pipeline shown in Fig.3 outperforms the CSD-based pipeline before and after the tractogram filtering method COMMIT. The GT connectivity matrix was computed in such a way that connection strength between any two ROIs is the total cross-sectional area of the strands connecting them. This could explain why MRDS yields higher correlation values in Fig. 3 because MRDS has a higher overlapping value as it was shown in Fig. 4.Conclusions: In this work, we showed that the metrics estimated by MRDS can be adapted to be included in a regular tractography pipeline. Results on synthetic data indicate that the MRDS method presents competitive results when it is complemented with a tractogram filtering technique, making MRDS a better method than CSD for connectivity analysis. As it was mentioned in8, it is better to look for the tractogram overlapping metric rather than streamline count-based metrics as connectivity metrics seems to be sensitive to overlapping.The future work involves the addition of COMMIT212 to the pipeline, which has proved to outperform COMMIT removing spurious streamlines. Besides, it is imperative to work on the model selector in MRDS in order to improve the estimation of the number of compartments at each voxel. Finally, MRDS provides robust intravoxel compartment parameters that may be used to inform the tractography process.
Acknowledgements
AR was supported by CONACyT Mexico and the National Laboratory for Magnetic Resonance Imaging (Conacyt, UNAM, CIMAT, UAQ).References
- Coronado-Leija et al. Estimation of Individual Axon Bundle Properties by a Multi-Discrete-Search Method. Medical Image Analysis, 2017.
- Tournier et. al. Improved probabilistic streamlines tractography by 2nd order integration over fibre orientation distributions. Proceedings of the International Society for Magnetic Resonance in Medicine, 2010, 1670.
- Daducci et. al. A Convex Optimization Modeling for Microstructure Informed Tractography (COMMIT). IEEE Transactions on Medical Imaging 34(1) 246-257, 2015.
- http://hardi.epfl.ch/static/events/2012_ISBI/data_format.html
- Gudbjartsson et al. The Rician Distribution of Noisy MRI Data. Magn Reson Med, 1995; 34(6): 910-914.
- Tournier et. al. A fast, flexible and open software framework for medical image processing and visualisation. NeuroImage, 2019, 202, 116137.
- Rafael-Patino et. al. The Diffusion-Simulated Connectivity (DiSCo) dataset. Data in Brief, 2021, 107429.
- Cote et. al. Tractometer: Towards Validation of Tractography Pipelines. Medical Image Analysis, 2013.
- Maier-Hein et. al. The Challenge of Mapping the Human Connectome Based on Diffusion Tractography. Nature Communications, 2017.
- Rojas-Vite et al. Histological validation of per-bundle water diffusion metrics within a region of fiber crossing following axonal degeneration. Neuroimage 201 (2019) 116013.
- Tournier et al. Robust determination of the fibre orientation distribution in diffusion MRI: non-negativity constrained super-resolved spherical deconvolution, Neuroimage,2007, 35( 4): 1459-1472.
- Schiavi et. al. A new method for accurate in vivo mapping of human brain connections using microstructural and anatomical information. Science Advances, 2020.
- Burnham et. al. Model selection and multimodel inference: A practical information-theoretic approach. Springer, 2002.
- Patino et. al. Robust Monte-Carlo Simulations in Diffusion-MRI: Effect of the Substrate Complexity and Parameter Choice on the Reproducibility of Results. Frontiers in Neuroinformatics, 2020.
- L. Cordero-Grande, D. Christiaens et al. Complex diffusion-weighted image estimation via matrix recovery under general noise models. NeuroImage. 2019. 200(1). 391-404
Figures
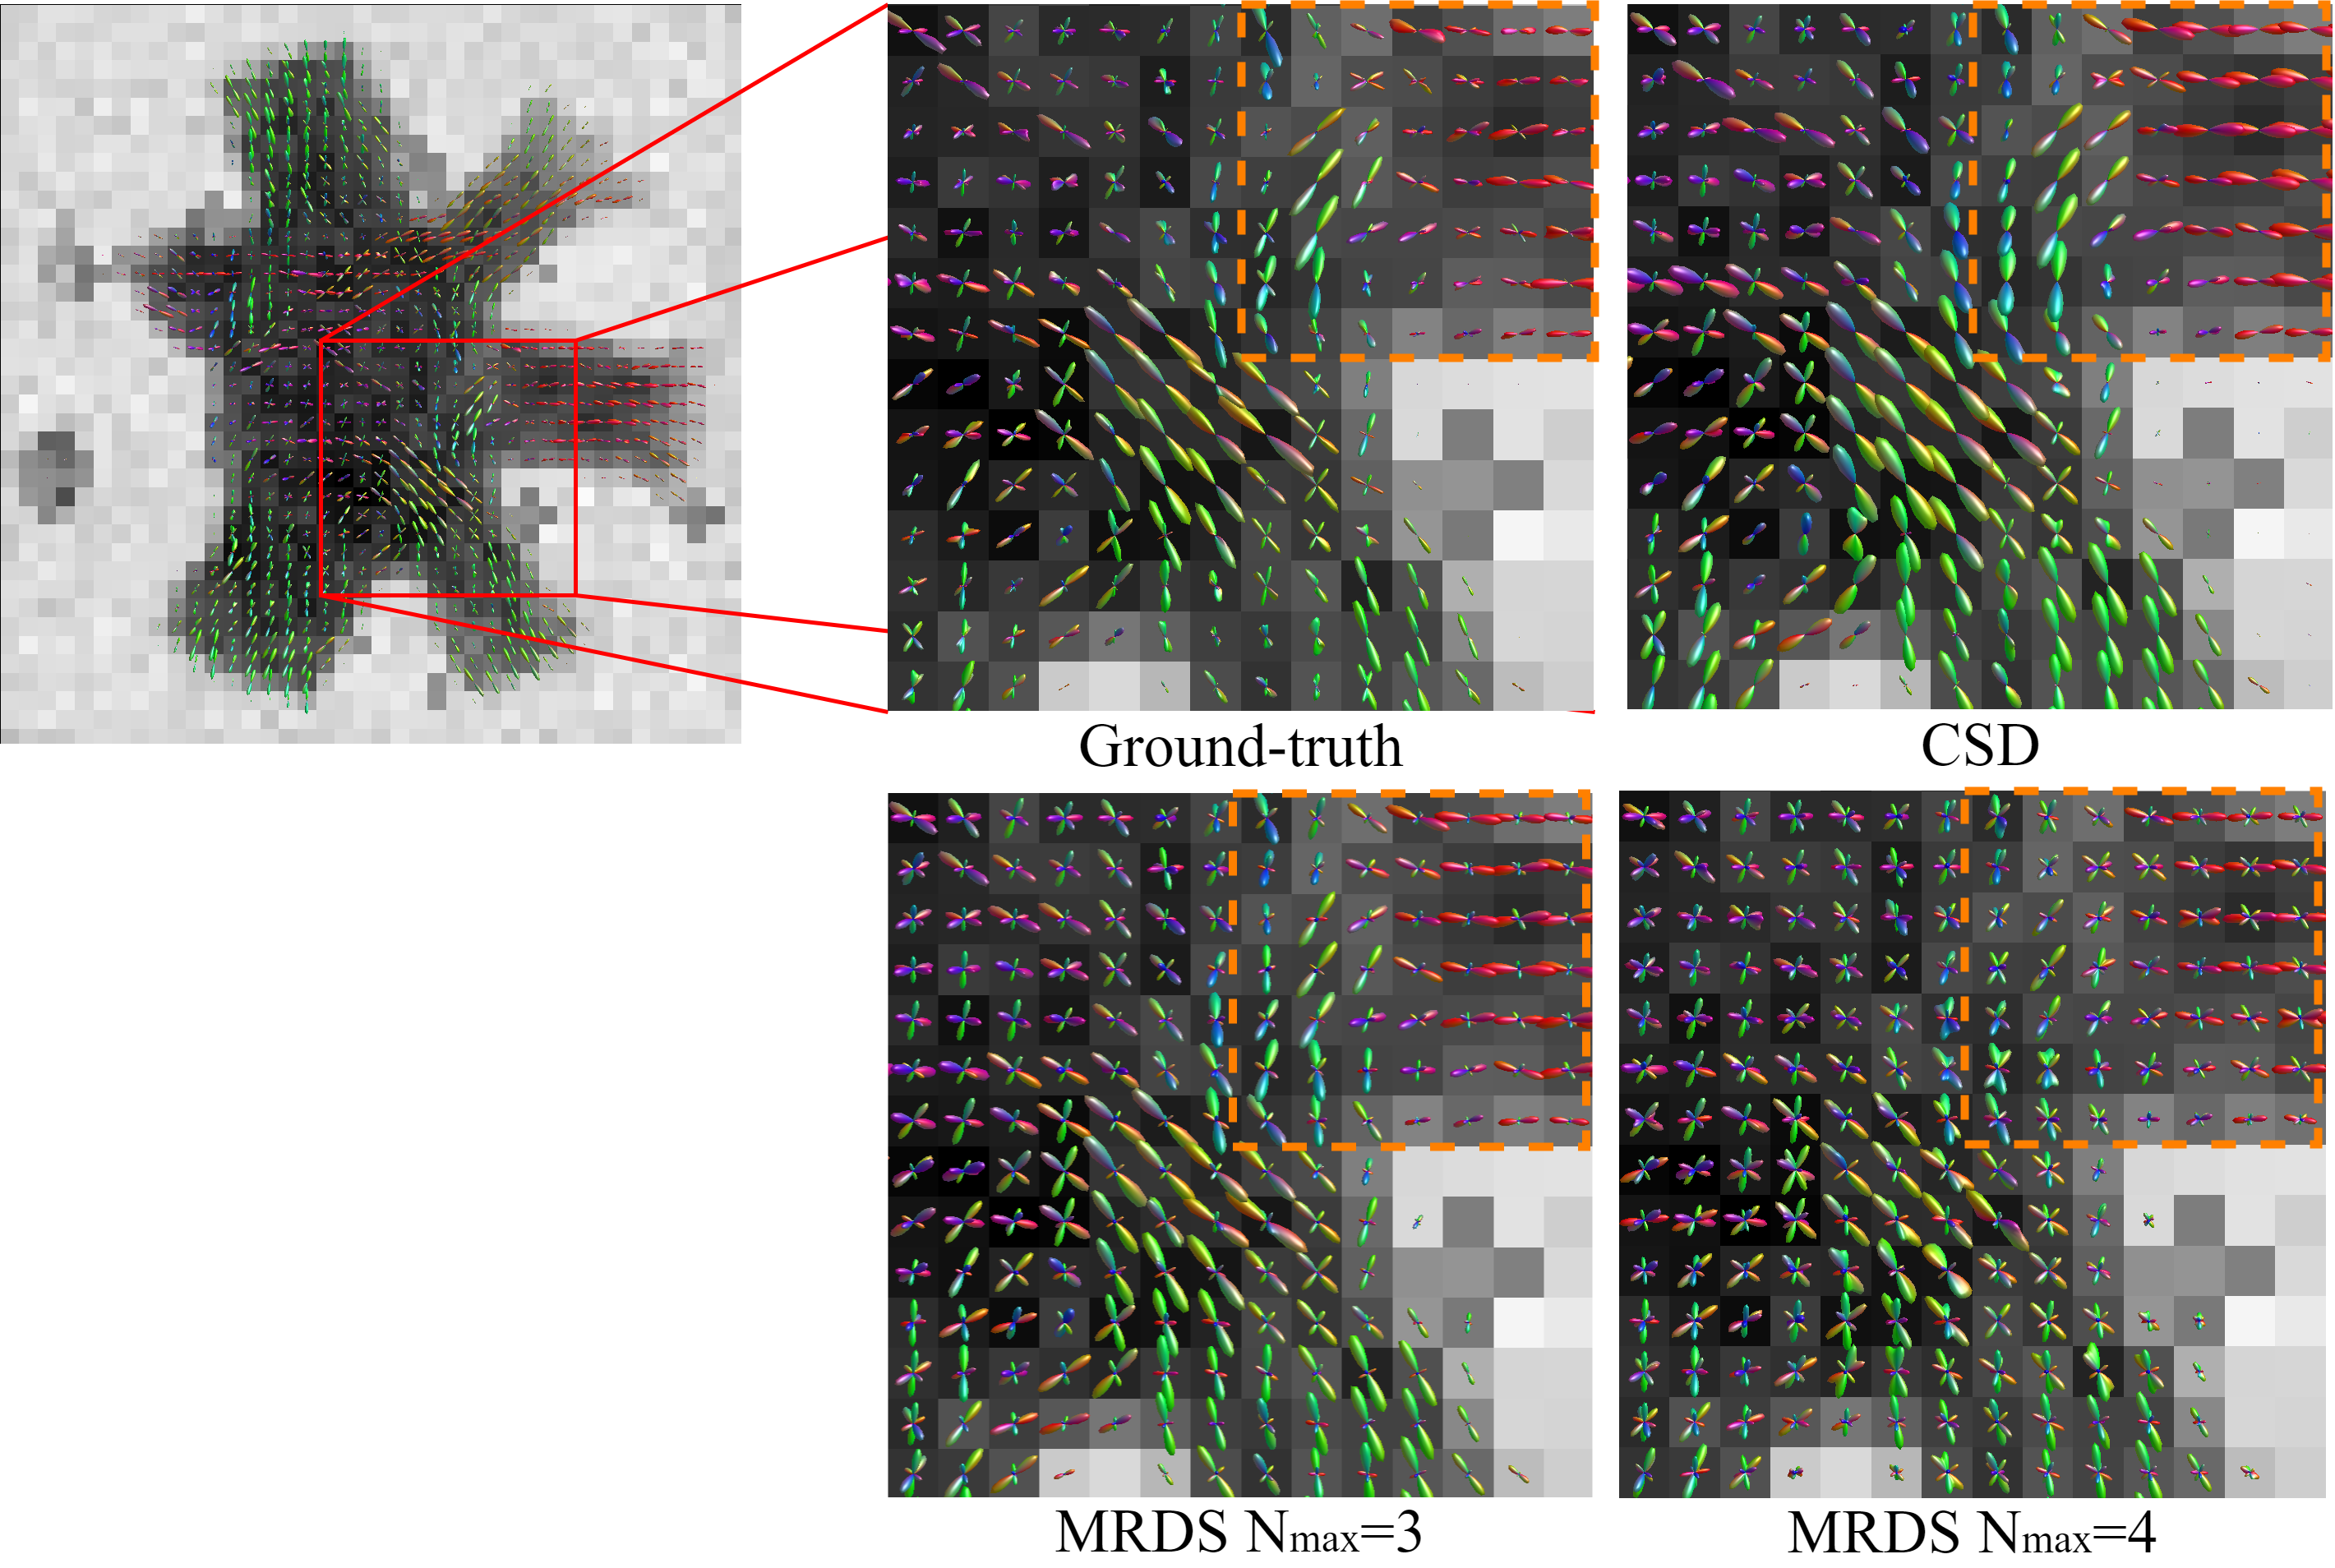
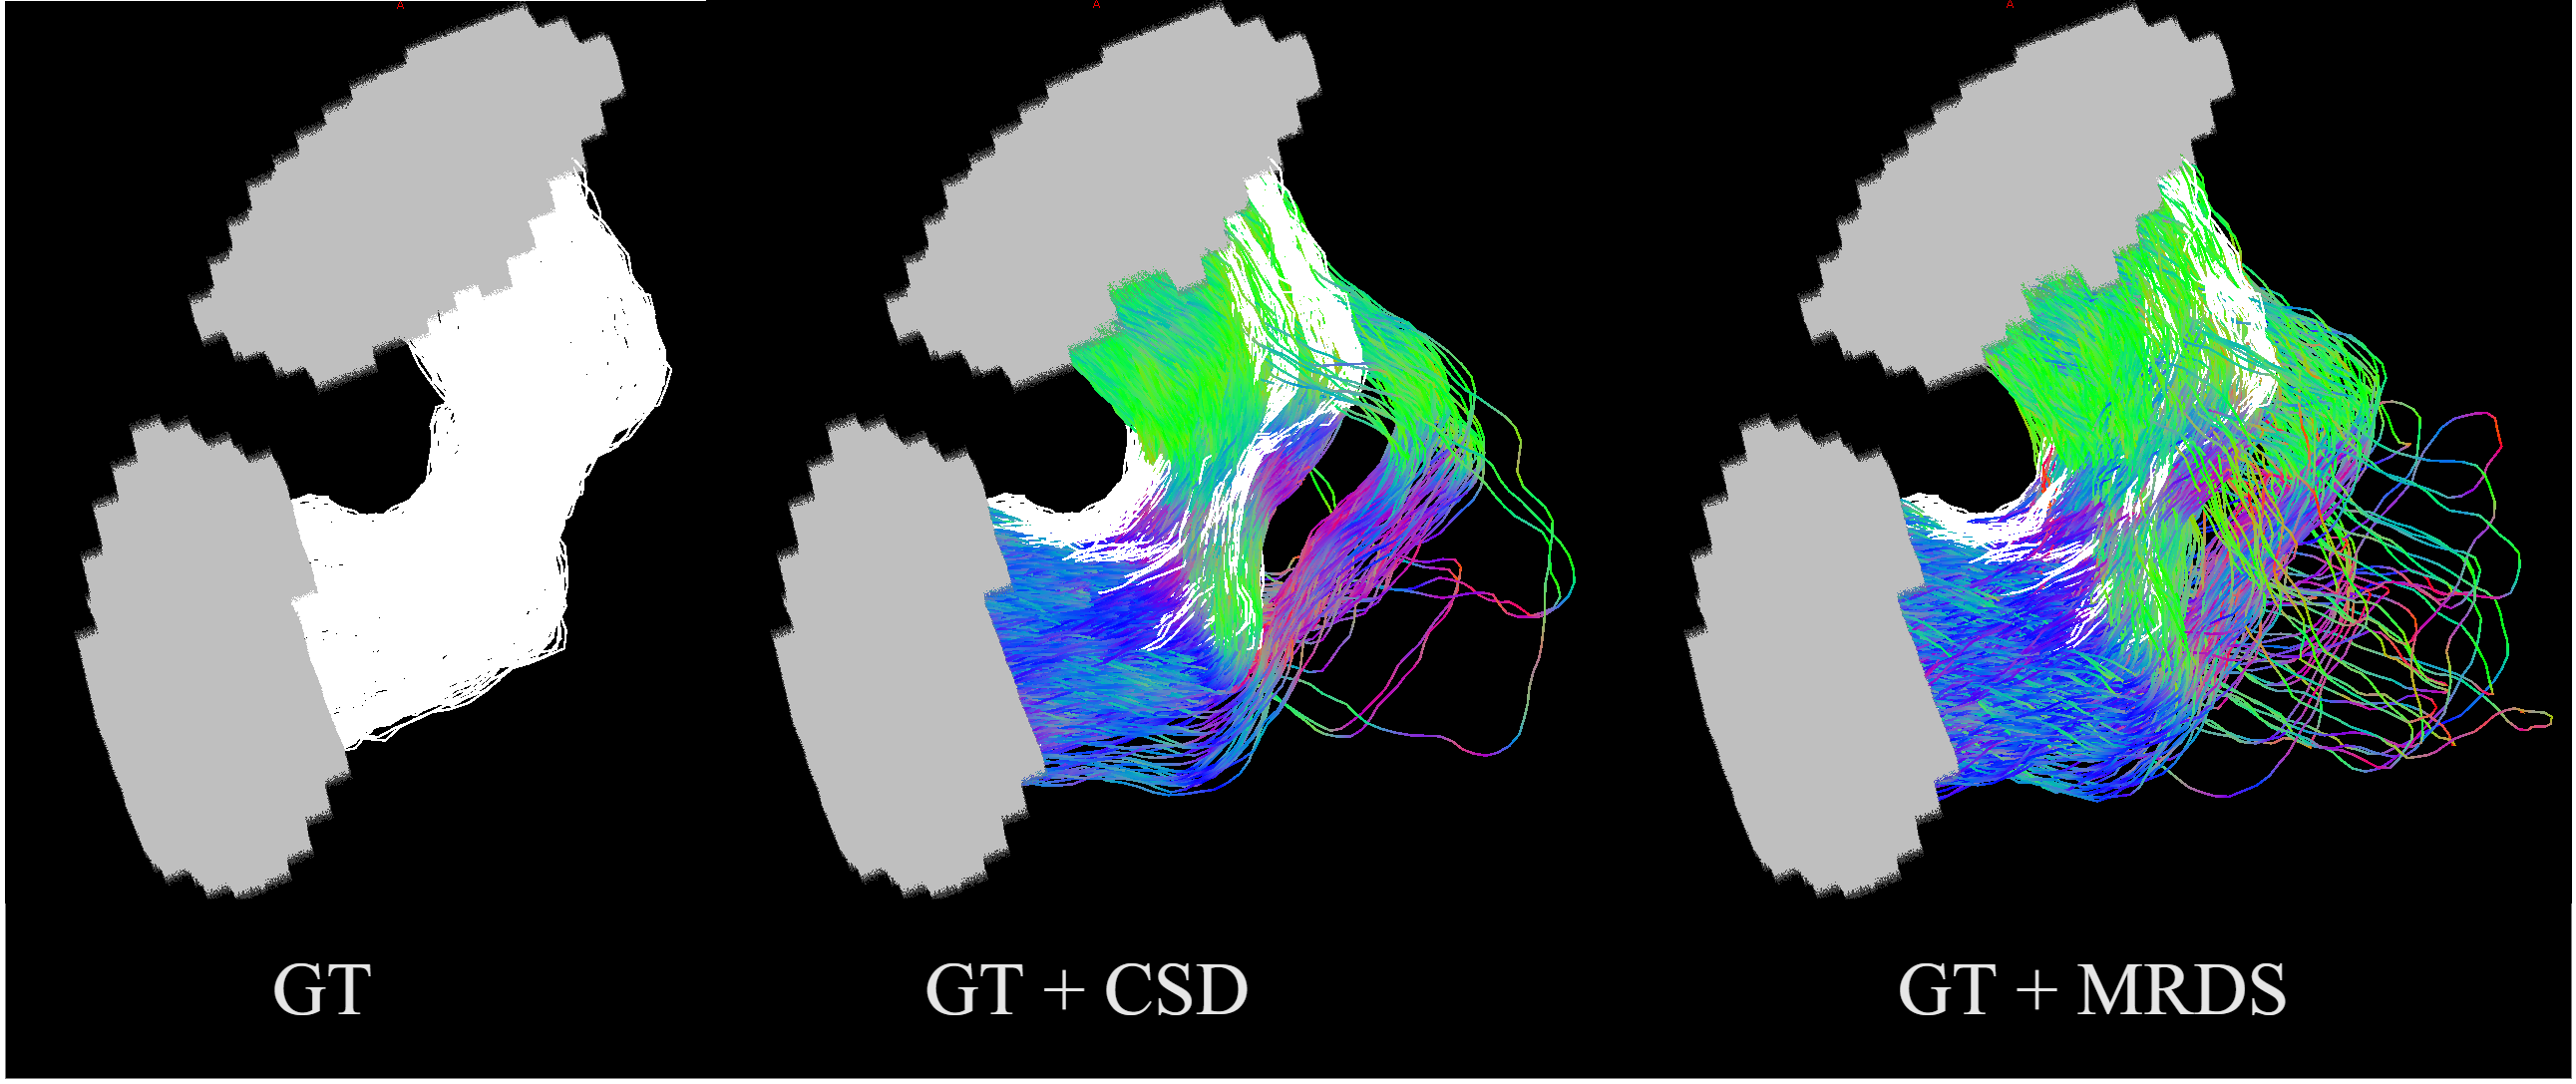
Fig.2 Visual comparison of the streamlines connecting 2 grey colored ROIs. The leftmost tractogram represents the white colored GT strands trajectories. The one in the middle is the overlapped GT and CSD tractograms. The rightmost represents the overlapped GT and MRDS tractograms. This experiment shows the higher account of FC connections in the MRDS tractogram as well as the better overlapping with the GT.