3549
Sensitivity advantage of a two- over one-compartment diffusion model for studying aging: An analytic demonstration1Rotman Research Institute, Baycrest Health Sciences, Toronto, ON, Canada, 2Department of Medical Biophysics, University of Toronto, Toronto, ON, Canada, 3School of Mathematical Sciences, Tel Aviv University, Tel Aviv, Israel, 4School of Neuroscience, Tel Aviv University, Tel Aviv, Israel, 5Department of Radiology, Brigham and Women's Hospital, Harvard Medical School, Boston, MA, United States, 6Department of Psychiatry, Brigham and Women's Hospital, Harvard Medical School, Boston, MA, United States
Synopsis
Recent diffusion modeling studies aim to distinguish age-related degenerative processes specific to white matter fibers, such as axonal myelination and dispersion, from age-related elevated isotropic diffusivity, resulting from, e.g., enlargement of the extracellular space. Here we analytically investigate the relationship between two single-shell approaches for distinguishing these effects, respectively based on a one- and two-compartment model. We derive a nonlinear relationship between the models that renders a sensitivity advantage to the two-compartment model, and find that a linear elevation of an isotropic compartment with age explains the well-documented phenomenon of accelerated MD elevations (faster radially than axially) in aging.
Introduction
White matter (WM) fiber degeneration in aging is most commonly probed with single-shell diffusion MRI. Recent modeling approaches aim to distinguish cellular changes specific to WM fibers, such as axonal demyelination and dispersion, from elevated isotropic diffusivity that is not necessarily reflective of axonal changes, which can result from processes such as enlargement of the extracellular space.[1,2] Conventional scale-invariant measures of diffusion anisotropy such as relative anisotropy (RA) and fractional anisotropy (FA) inherently conflate anisotropic and isotropic effects.[1,2]Here we analytically investigate the relationship between two single-shell approaches for distinguishing these effects: (1) orthogonally decomposing the diffusion tensor into the mean diffusivity (MD) and spatial variance of diffusivity (norm of anisotropy, NA) such that the latter measure of anisotropy is unaffected by isotropic elevations,[3] and (2) fitting a two-compartment model with both a cellular compartment and an isotropic compartment such that the cellular compartment, as proxied by cellular FA (FAc), is unaffected by isotropic elevations.[4]
Theory
For diffusion MRI data s = {sk}, where the kth volume is weighted by diffusion along direction q̂k at diffusion weighting bk, the one-compartment model is$$\textrm{s}_k = \textrm{s}_0 e^{-b\hat{\mathbf{q}}_k^\textrm{T}\mathbf{D}\hat{\mathbf{q}}_k}$$
(where D is the diffusion tensor) and the two-compartment model is
$$\textrm{s}_k = \textrm{s}_0 \left[ (1-f) e^{-b \hat{\mathbf{q}}_k^\textrm{T}\mathbf{D}_c\hat{\mathbf{q}}_k} + fe^{-b\textrm{D}_{\textrm{iso}}} \right]$$
where f is the fraction of the isotropic compartment and Dc is the diffusion tensor of the cellular compartment. By equating the two models at their tensor means, with mean diffusivities of both compartments in the two-compartment model respectively fixed to MDc and Diso, we can analytically derive the following one-to-one nonlinear relationship between one-compartment MD and isotropic-compartment fraction f (Fig. 1):
$$\textrm{MD} - \textrm{MDc} = \frac{1}{b} \sum_{n=1}^\infty \frac{(\alpha f)^n}{n}$$
where b is the nonzero b-value and α = 1 - exp[-b(Diso - MDc)]. This relationship is analogous to the relationship between FA and RA: Just as FA is a one-to-one nonlinear function of RA that exhibits higher immunity to noise[5] and can exhibit higher linear sensitivity to biological variability[6] than RA, we can derive, from the analytic relationship above, that f also exhibits higher immunity to noise than MD-MDc:
$$\frac{\textrm{SNR}[f]}{\textrm{SNR}[\textrm{MD}-\textrm{MDc}]} \approx 1 + \sum_{n=1}^\infty \frac{1}{(n+1)!} b^n (\textrm{MD}-\textrm{MDc})^n > 1 $$
We can also derive that f can exhibit higher linear sensitivity to age than MD if the elevation in MD accelerates with advancing age (i.e., if the average MD value across ages, <MD>, is greater than the average of the lowest and highest MD values in a linear regression with age, MD1 and MD2 respectively):
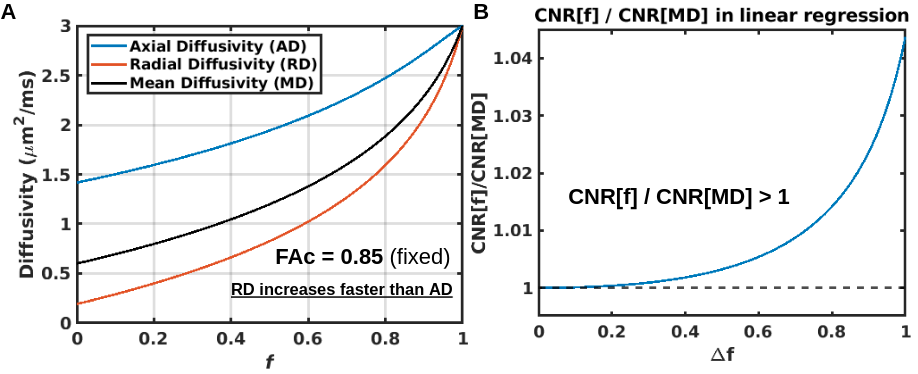
$$\frac{\textrm{CNR}[f]}{\textrm{CNR}[\textrm{MD}]} \approx 1 + b\left( \langle\textrm{MD}\rangle - \frac{\textrm{MD}_1 + \textrm{MD}_2}{2} \right) $$
MD elevations are indeed known to accelerate with age throughout most of the WM (excluding some posterior and inferior regions),[7] which implies CNR[f]/CNR[MD] > 1.
In addition to the SNR and CNR advantage of the two-compartment model, the nonlinear relationship above dictates that a linear elevation in f with age can explain two established phenomena of WM aging: The accelerated increase in diffusivity with age described above, and radial diffusivity increasing with age faster than axial diffusivity through most of the WM (excluding some crossing fiber regions).[7] (Fig. 2, where a linear increase in f causes smaller diffusivities to accelerate faster than larger diffusivities).
Methods
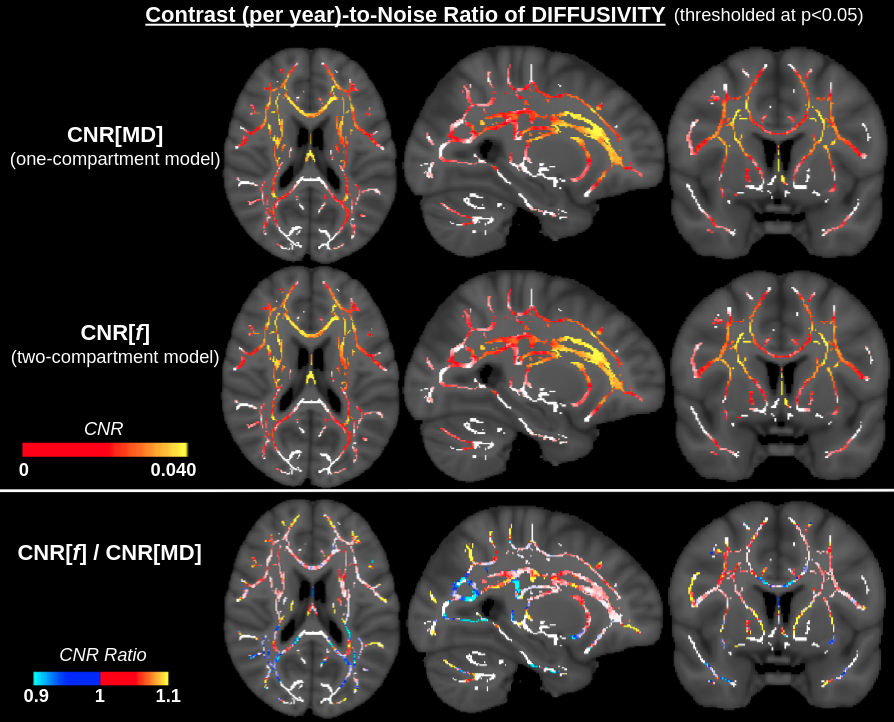
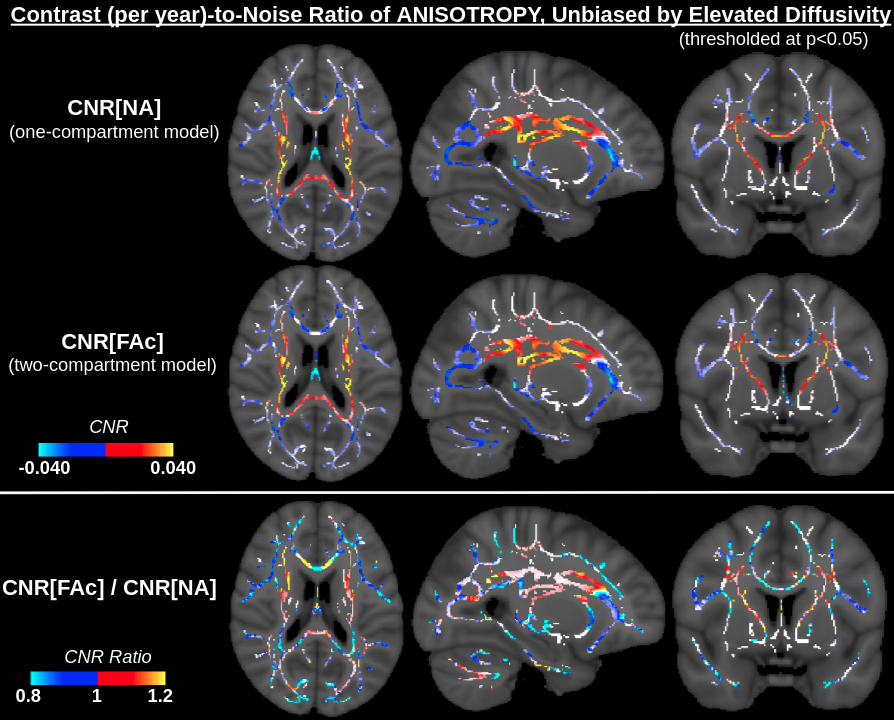
Diffusion MRI data of 700 healthy UK Biobank[8] participants aged 46-80, without history of neurological, psychological or psychiatric disorders, were acquired on a Siemens 3T system with 5 b=0, 50 b=1000s/mm2, 50 b=2000s/mm2; TR/TE=3.6s/92ms, (2mm)3, with EDDY/TOPUP distortion-correction. FSL’s TBSS was used to align data to standard space and obtain a WM skeleton. Relationship of metrics with age were assessed via FSL’s randomise (p<0.05 with multiple-comparison correction and controlling for sex). CNR was defined by dividing age-related difference per year (linear model implemented in FreeSurfer) by standard deviation of the metric across the 700-participant sample.Results
CNR values for f (two-compartment model) are higher than for MD (one-compartment model) through most of the WM (Fig. 3), whereas absolute CNR values for FAc (two-compartment model) are higher for NA (one-compartment model) in regions where anisotropy increases with age, and lower in regions where anisotropy decreases with age (Fig. 4). SNR values for both f and FAc (two-compartment model) are higher than for MD-MDc and NA (one-compartment model) (Fig. 5).Discussion and Conclusion
Fitting the one- and two-compartment model to single-shell data can both overcome the limitation of RA and FA conflating isotropic and cellular diffusivity, but the nonlinearity of the mutual relationship between the models renders sensitivity differences. We found enhanced SNR and CNR of f over MD, and that interpreting age-related changes in MD as elevations in f explains the well-documented phenomenon of accelerated MD elevations (faster radially than axially) in aging. For the case of a simultaneous increase in isotropic diffusivity and cellular anisotropy (e.g., resulting from selective degeneration of secondary crossing fibers), these two processes can counteract each other to lead to no change in RA or FA, but can be individually identified by employing either {MD, NA} (one-compartment model) or {f, FAc} (two-compartment model) - and the latter pair exhibits both higher SNR and CNR. Thus, while single-shell data is conventionally fit to the one-compartment model, this study demonstrates advantages to re-examining such data with the two-compartment model.Acknowledgements
This research was funded by NIH (MH108574) and CIHR (Project Grant #169688) and conducted using the UK Biobank Resource under Application Number 40922 (PI: Jean Chen).
References
1. Chad JA, Pasternak O, Salat DH, Chen JJ. Re-examining age-related differences in white matter microstructure with free-water corrected diffusion tensor imaging. Neurobiol Aging. 2018;71:161-170.
2. Chad JA, Pasternak O, Chen JJ. Orthogonal moment diffusion tensor decomposition reveals age-related degeneration patterns in complex fiber architecture. Neurobiol Aging. 2021;101:150-159.
3. Ennis DB, Kindlmann G. Orthogonal tensor invariants and the analysis of diffusion tensor magnetic resonance images. Magn Reson Med. 2006;55:136-146.
4. Pasternak O, Sochen N, Gur Y, et al. Free water elimination and mapping from diffusion MRI. Magn Reson Med. 2009;62:717-730.
5. Hasan KM, Alexander AL, Narayana PA. Does fractional anisotropy have better noise immunity characteristics than relative anisotropy in diffusion tensor MRI? An analytical approach. Magn Reson Med 2004;51:413–417.
6. Kingsley PB, Monahan WG. Contrast-to-noise ratios of diffusion anisotropy indices. Magn Reson Med. 2005;53:911–918.
7. Cox SR, RItchie SJ, Tucker-Drob EM, et al. Ageing and brain white matter structure in 3,513 UK Biobank participants. Nat Commun 2016;7:13629.
8. Alfaro-Almagro F, Jenkinson M, Bangerter NK, et al. Image processing and Quality Control for the first 10,000 brain imaging datasets from UK Biobank. Neuroimage 166, 400–424.
Figures
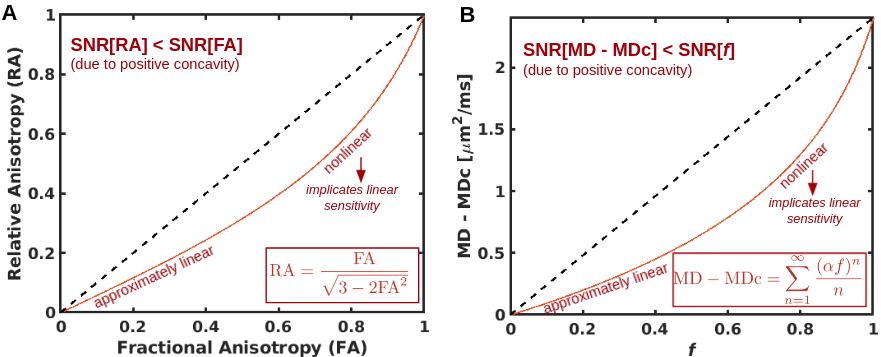
Fig. 1. RA vs. FA (A) and MD-MDc vs. f (B) are both one-to-one functions with positive first three derivatives. The positive concavity renders SNR differences (based on standard propagation of noise theory) and the nonlinearities render linear CNR differences. If RA and MD are skewed towards higher values (e.g. if MD accelerates with advancing age), the highest RA and MD values are outliers in a linear model and the contrast in RA and MD is consequently underestimated, rendering FA and f with higher CNR than RA and MD.