3546
Brain Microstructure Imaging with Ultrahigh B-Encoding using MAGNUS High Performance Gradients1GE Global Research Center, Niskayuna, NY, United States, 2MR Applied Science Laboratory Europe, GE Healthcare, Stockholm, Sweden, 3Walter Reed National Military Medical Center, Bethesda, MD, United States, 4Uniformed Services University of the Health Sciences, Bethesda, MD, United States
Synopsis
An ultra-high diffusion b-value protocol (b=7,000-30,000s/mm2) was acquired in a high-performance 3.0 T MAGNUS head gradient system (max gradient amplitude=200 mT/m and max slew rate=500 T/m/s) for white matter microstructure imaging.With shorter TE enabled by MAGNUS, measurements of intra-axonal diffusivities are demonstrated at ultra-high b-values. At these ultra-high b-values, signal from extra-axonal water is effectively suppressed but SNR is also reduced. We show that real-valued image reconstruction maintains Gaussian noise properties and reduces Rician bias, allowing better quantification of intra-axonal diffusivities and effective axonal radii in healthy volunteers and in ongoing human subject research studies of mild traumatic brain injury.
Introduction
The MAGNUS1 head-only gradient system delivers simultaneously, Gmax=200 mT/m and SRmax= 500 T/m/s (1 MVA), enabling advanced diffusion imaging by combining high gradient amplitude with fast gradient slew rates. This allows for shorter diffusion encoding pulse-widths, TE times, and reduced distortion and blurring from shorter EPI echo-spacing while boasting higher PNS thresholds compared to whole-body gradient systems5. This capability has enabled novel in-vivo implementations for time-dependent diffusivity6,7and allows for ultra-high b-value (≥30,000 s/mm2) diffusion encoding to simplify modeling of intra-axonal diffusivity8–10.High gradient performance allows for simplified biophysical models to be explored8 such that 1) ultra-high diffusion sensitization eliminates signal from extra-axonal water9, 2) directionally averaged signal mitigates orientation bias11, and 3) signal response can be used to estimate intra-axonal radial diffusivity ($$$D_a^\bot$$$)8 can be used as simplifying assumptions. From this effective axonal radii (reff) maps8,10 can be generated. This work utilizes the high gradient performance of the MAGNUS platform for ultra-high b-value diffusion imaging to demonstrate assessment of changes in $$$D_a^\bot$$$ and reff to differentiate between healthy tissue and pathology.
Methods
Acquisition: Five healthy volunteers were scanned under IRB-approved protocols on a 3T MRI GE SIGNA MR750 (GE Healthcare, Waukesha, WI, USA), fitted with a head-only MAGNUS gradient. A 32-channel phased array head coil (NOVA Medical, Wilmington, MA, USA) was used for all experiments. Separate multi-shell diffusion acquisitions were performed with 64-68 directions/acquisition. Gradient directions were uniformly sampled (electrostatic repulsion algorithm)12,13 per b-shell for b = (3, 7, 10, 13, 20, 25 and 30) x 103 s/mm2. Other acquisition parameters were: EPI echo-spacing=538 ms, $$$\triangle/\delta$$$=33/19 ms, TE/TR=63/5500 ms, 2.2-mm isotropic resolution, NEX=1, R=2 in-plane acceleration. Each acquisition took ~6 min per scan (~42 mins total scan time). For patient studies, as part of an ongoing clinical evaluation of mTBI, an abbreviated protocol with 40-directions per target b-values, and b=18,25,30 x 103 s/mm2 was used.Image reconstruction: Due to intrinsically low SNR at the ultra-high b-values (Fig.1), magnitude reconstruction of dMRI images results in a rectification of the (non-central chi squared is rician with complex coil combination) noise floor resulting in errant estimation for model fitting. Herein, we adopted a decorrelated phase filtering technique14 which utilized phase correction-based filter kernels optimized via spatial noise correlation patterns. The output was real-valued data (RVD) that maintained a Gaussian noise distribution. This was a critical step for mitigating Rician bias and extended beyond simple parameter estimation where parameter tuning is often empirical. RVD was further corrected for spatial non-linearity of diffusion-encoding gradients, eddy current distortion, bulk motion and susceptibility, as implemented in a custom reconstruction pipeline21,22.
Diffusion modelling: $$$D_a^\bot$$$ was determined by fitting the multi-shell data to8,15,
$$S_0=\beta exp(-bD_a^\bot)b^\frac{-1}{2}$$
From this reff can be computed using the Neumann approximation23 such that,$$$r_{eff}=\sqrt[4]{\frac{48}{7}\delta(\triangle-\frac{\delta}{3})D_0D_a^\bot}$$$. The lower-bound b-value used was 7000 s/mm2 to minimize extra-axonal signal contributions.
Results and Discussion
Non-denoised directionally averaged signal for ultra-high b-values data is shown in Figure 1. With MAGNUS, striking microstructural detail is evident even at b-values of 30,000 s/mm2. This is primarily due to the short TE(~63 ms) and echo spacing achieved compared to whole-body 3.0T systems.Decorrelated phase correction yielded clear improvements in noise reduction as noted in the probability distributions over the residuals and representative noise maps (Fig.2). Importantly, reduced contrast due to the superposition of signal and the noise floor was evident in non-denoised data (Fig.2A). Though phase correction, particularly at ultra-high b-values is more sensitive to strong local phase variations, increased contrast, microstructural detail, and noise floor reduction were noted after denoising(Fig.2B). The recovered RVD maintained a Gaussian profile, with the residuals absent anatomical structure(Fig.2C).
The reff distributions demonstrated broad agreement with literature8,15,16 (Fig.3). Selected 76 white-matter (WM) bundles20 overlaid on the reff highlighted inter- and intra-bundle variability. Inter-bundle variability can be explained by a variety of confounding factors such as variations due to crossing fiber regions, and volume averaging resulting in sensitivity to a myriad of processes in the cytoarchitecture17. When signal in ROIs of various WM regions were plotted as a function of $$$1/\sqrt(b)$$$ (power law) the negative intercepts indicated non-zero $$$D_a^\bot$$$(Fig.4). Quantitative accuracy, however, depended on the noise floor reduction.
The ultra-high b-value protocol is currently applied to an ongoing clinical study of acute and chronic mild traumatic brain injury. Preliminary data, though confounded by a reduced number of b-value shells and diffusion directions, did highlight some interesting microstructural detail and anisotropy. In an acute mTBI patient (<9 days post-motor vehicle collision), WM asymmetry was noted with localized increases in $$$D_a^\bot$$$ and reff compared to contralateral and healthy control data, potentially indicating axonal swelling(Fig.5). This finding from the ultra-high b-value data was further reinforced by corresponding reduced parallel kurtosis in the same region. Though WM asymmetry in trauma has previously been reported in literature18, our results are preliminary and need to be confirmed as subject recruitment expands.
Conclusion
Ultra-high b-value diffusion imaging has identified a possible new imaging biomarker with potential high clinical value. The abbreviated acquisition offers discernable new contrast mechanisms in pathologies not observed via conventional imaging. Although our current sample size in patients with pathology is small for mTBI, this initial study represents feasibility of incorporating high b-value protocols in a more expansive clinical study.Acknowledgements
Grant funding from NIH U01EB028976, NIH U01EB024450, CDMRP W81XWH-16-2-0054.The opinions or assertions contained herein are the views of the authors and are not to be construed as the views of the U.S. Department of Defense, Walter Reed National Military Medical Center, or the Uniformed Services University.
References
1. Foo, T. K. F. et al. Magn Reson Med 83, 2356–2369 (2020).
2. Setsompop, K. et al. NeuroImage 80, 220–233 (2013).
3. Feinberg, D. A. et al. Proceedings of the 29th Annual Meeting of the ISMRM, Virtual Meeting (2021).
4. Weiger, M. et al. Magn Reson Med 79, 3256–3266 (2018).
5. Tan, E. T. et al. Magn Reson Med 83, 352–366 (2020).
6. Tan, E. T. et al. Magn Reson Med 84, 950–965 (2020).
7. Zhu, A. et al. Proceedings of the 29th Annual Meeting of the ISMRM, Virtual Meeting (2021)
8. Veraart, J. et al. eLife 9, e49855 (2020).
9. McKinnon, E. T., et al. Magn Reson Med 36, 121–127 (2017).
10. Burcaw, L. M., et al. Neuroimage 114, 18–37 (2015).
11. Afzali, M., et al. Sci Rep 11, 14345 (2021).
12. Dk, J., et al. Magn Reson Med vol. 42
13. Jones, D. K. et al. Magn Reson Med 51, 807–815 (2004).
14. Sprenger, T., et al. Magn Reson Med 77, 559–570 (2017).
15. Veraart, J., et al. Human Brain Mapping 42, 2201–2213 (2021).
16. Assaf, Y., et al. Magn Reson Med 59, 1347–1354 (2008).
17. Palombo, M., et al. Neuroimage 182, 283–293 (2017).
18. Vakhtin, A. A. et al. J Neurotrauma 37, 373–381 (2020).
19. Abad, N. et al. Proceedings of the 29th Annual Meeting of the ISMRM, Virtual Meeting (2021)
20. Li, X. et al. Organization for human Brain Mapping, (2017).
21. Tan, E.T. et al Neurology 86 (2013)
21. Bhushan, C. et al. Neuroimage 115 (2015)
23. Neuman, C.H. J. Chem. Phys. 60, (1974)
Figures
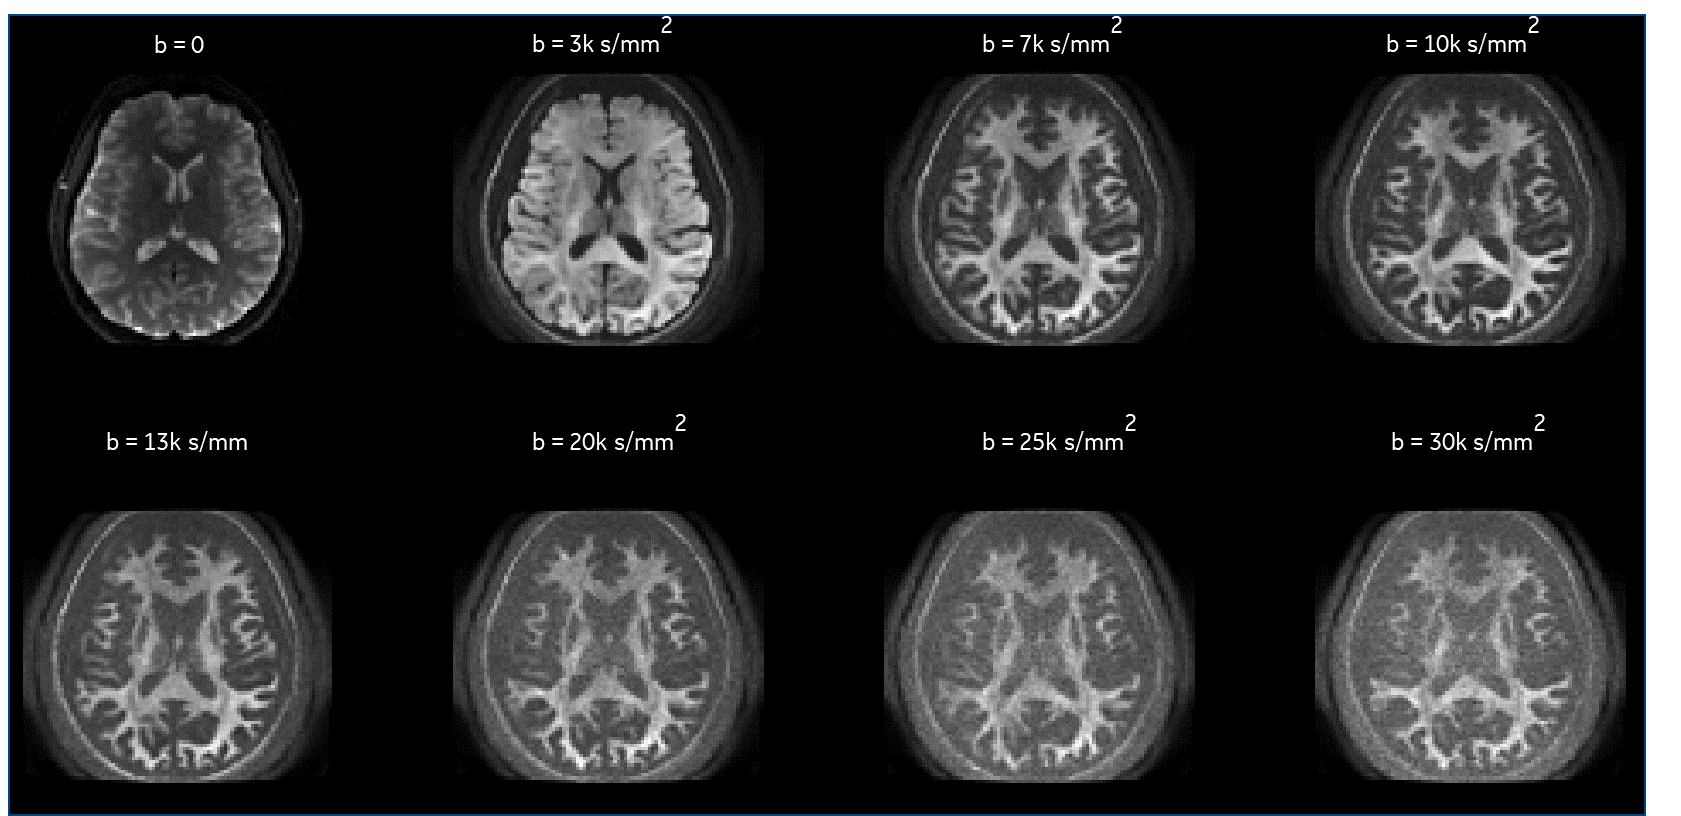
Figure 1. Directionally averaged raw diffusion weighted images over a healthy volunteer encompassing low, high and ultra-high b-values in an axial view at a spatial resolution of 2.2 mm isotropic, and TE = 63 ms prior to any denoising and image corrections are shown. dMRI volumes were acquired in the same scan session without acceleration. Note: Images ae not scaled the same
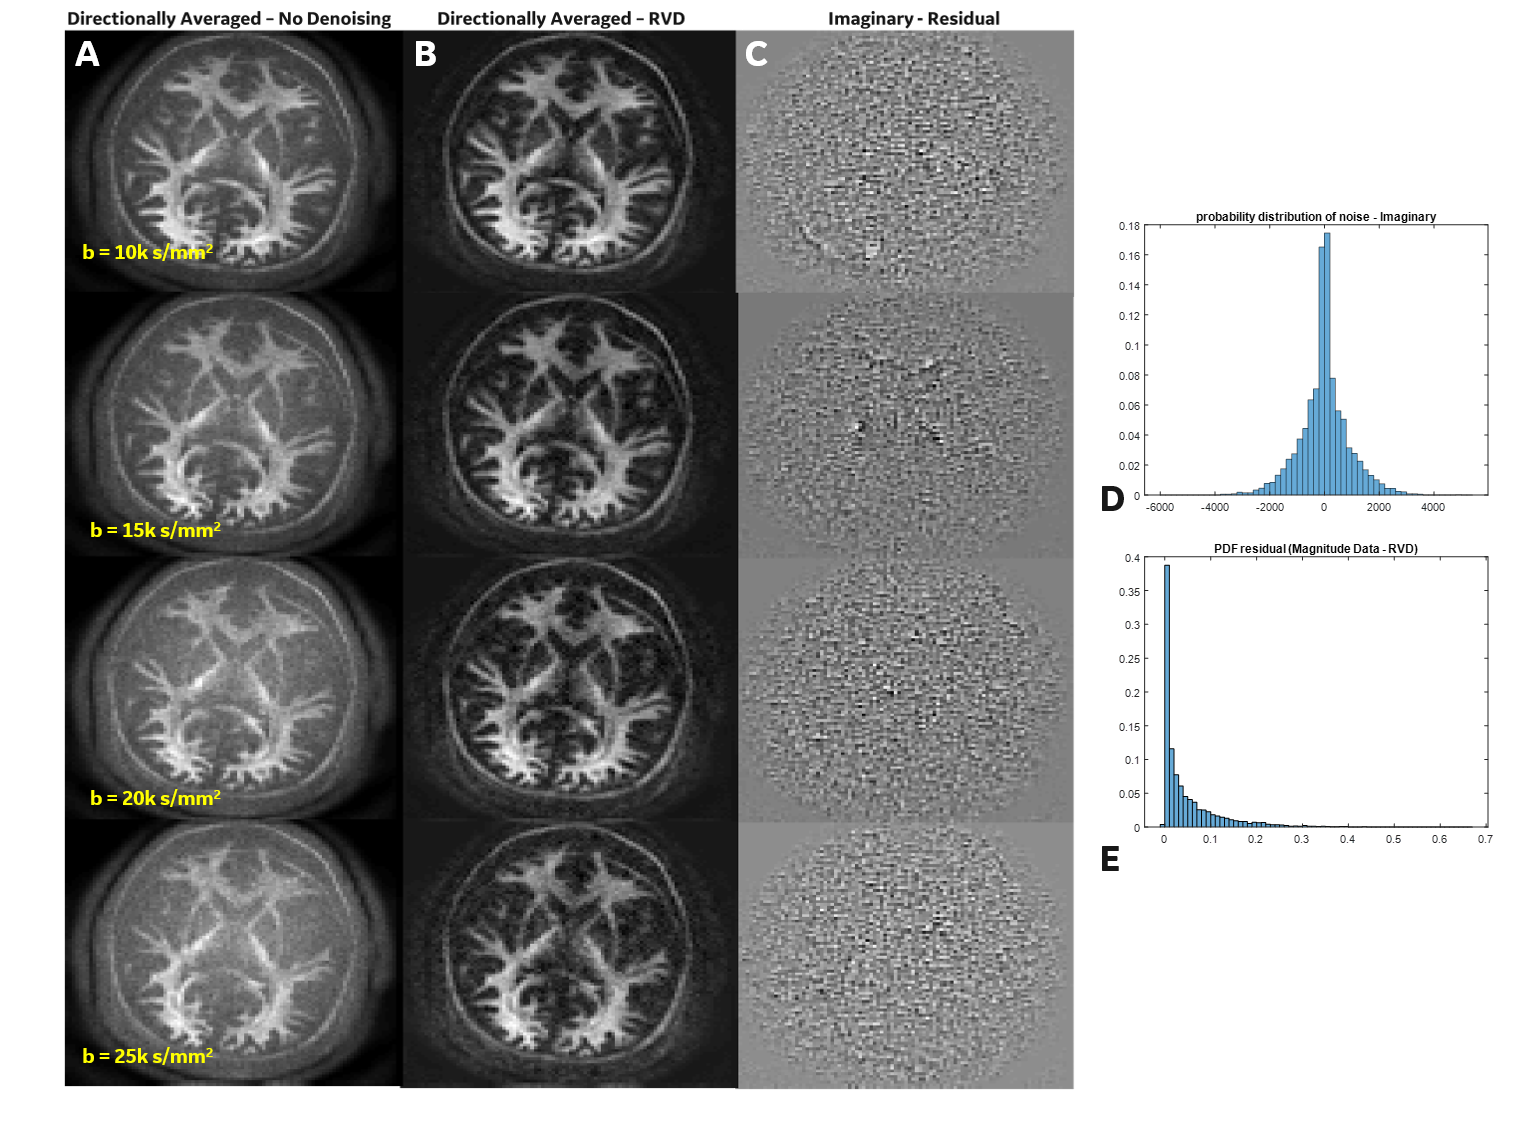
Figure 2. Directionally averaged (A) raw data and (B) decorrelated phase corrected real-valued data. (C) The noise residuals show absence of anatomy, indicating noise rather than structure has been reduced. (D Histograms highlight the (D) Gaussian noise profile in the imaginary residuals and (E) the rician distribution apparent in the residuals from magnitude data. Note: Images are not uniformly scaled.
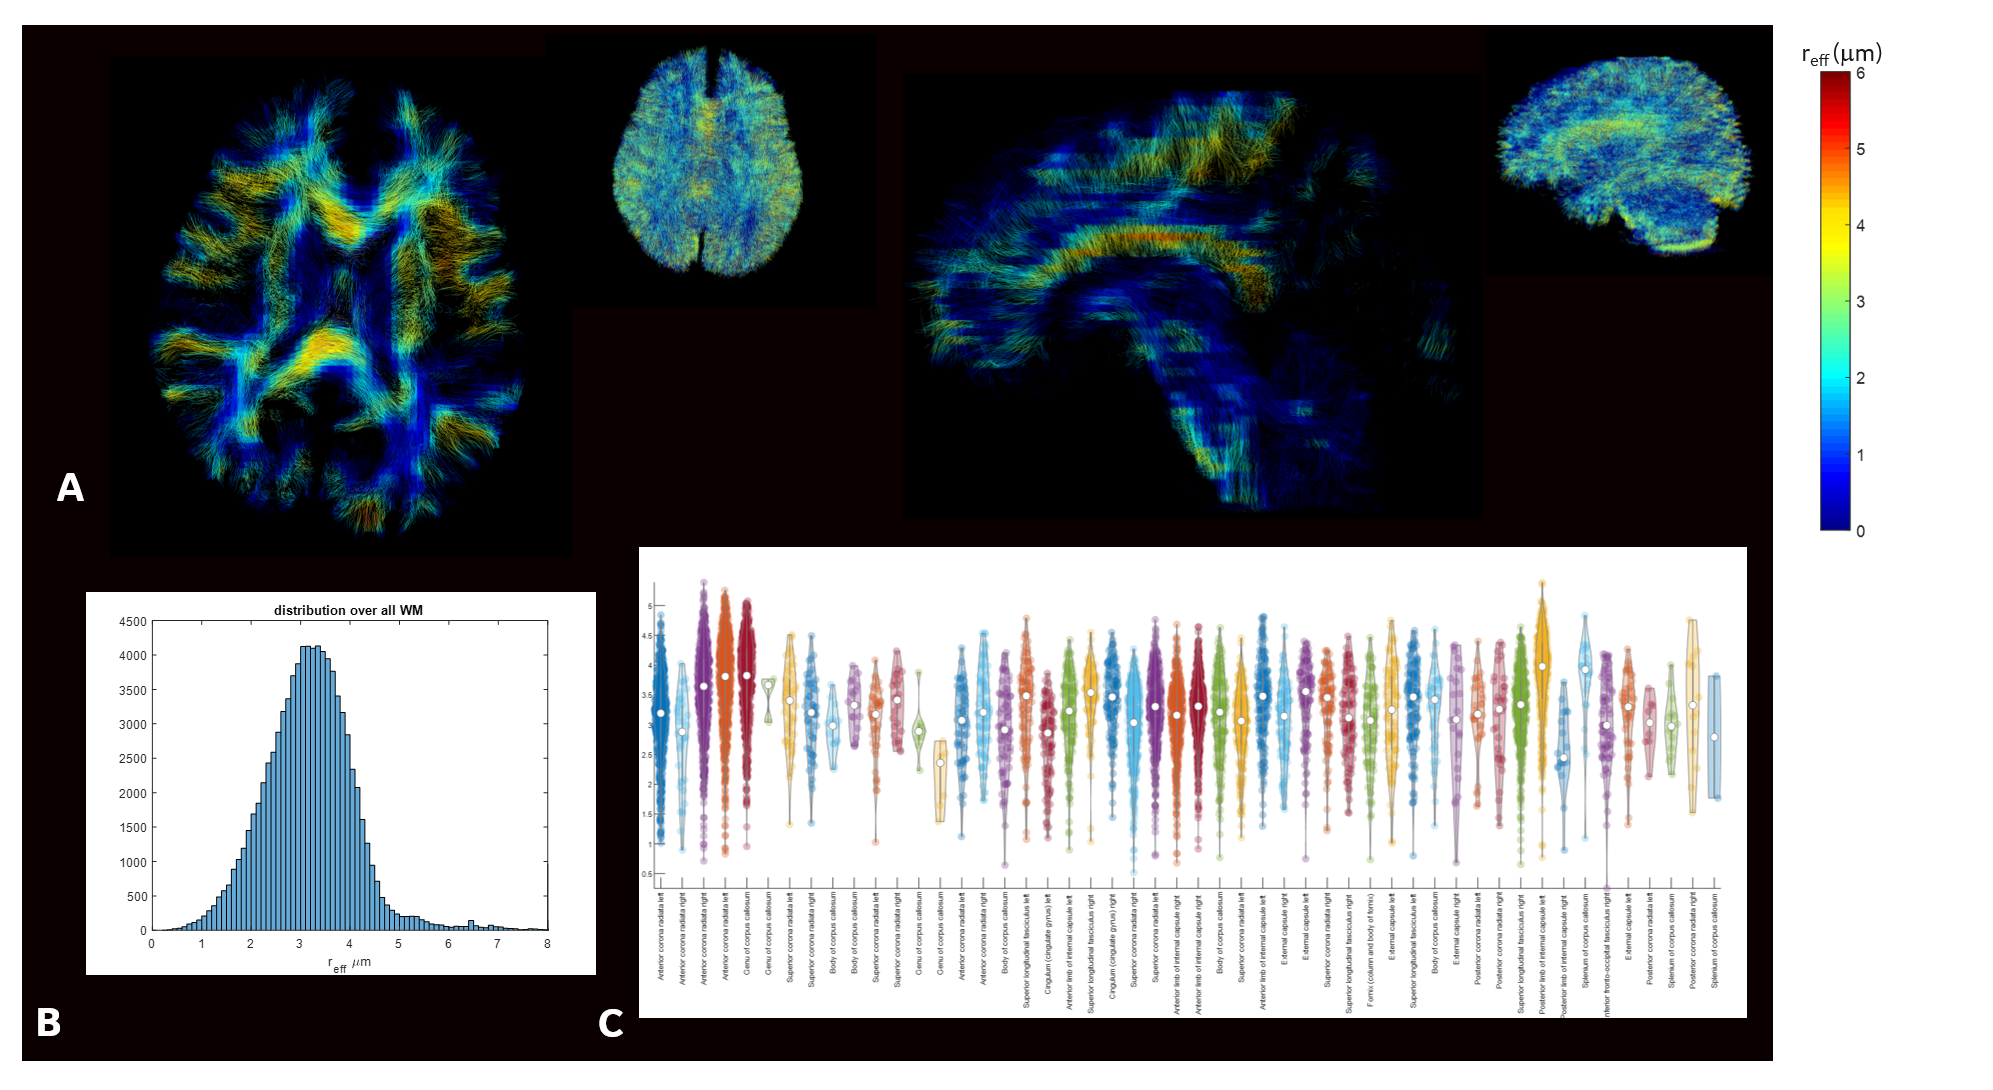
Figure 3. Representative distribution of estimated reff maps in single slice axial and sagittal planes overlaid on tractograms. (B) histogram plots demonstrate distribution of estimated reff for all WM voxels. (C) Violin plots highlight inter- and intra- large WM bundle variability for reff. In these plots the white dot represents the median, the thick gray bar represents the interquartile range, and the thin gray line represents the distribution (the violin shape represents the kernel density

Figure 4. Signal attenuation in white-matter ROI’s shows correspondence to observation of power law with α = ½ for data acquired with the MAGNUS scanner with negative intercept indicating non-zero Da^
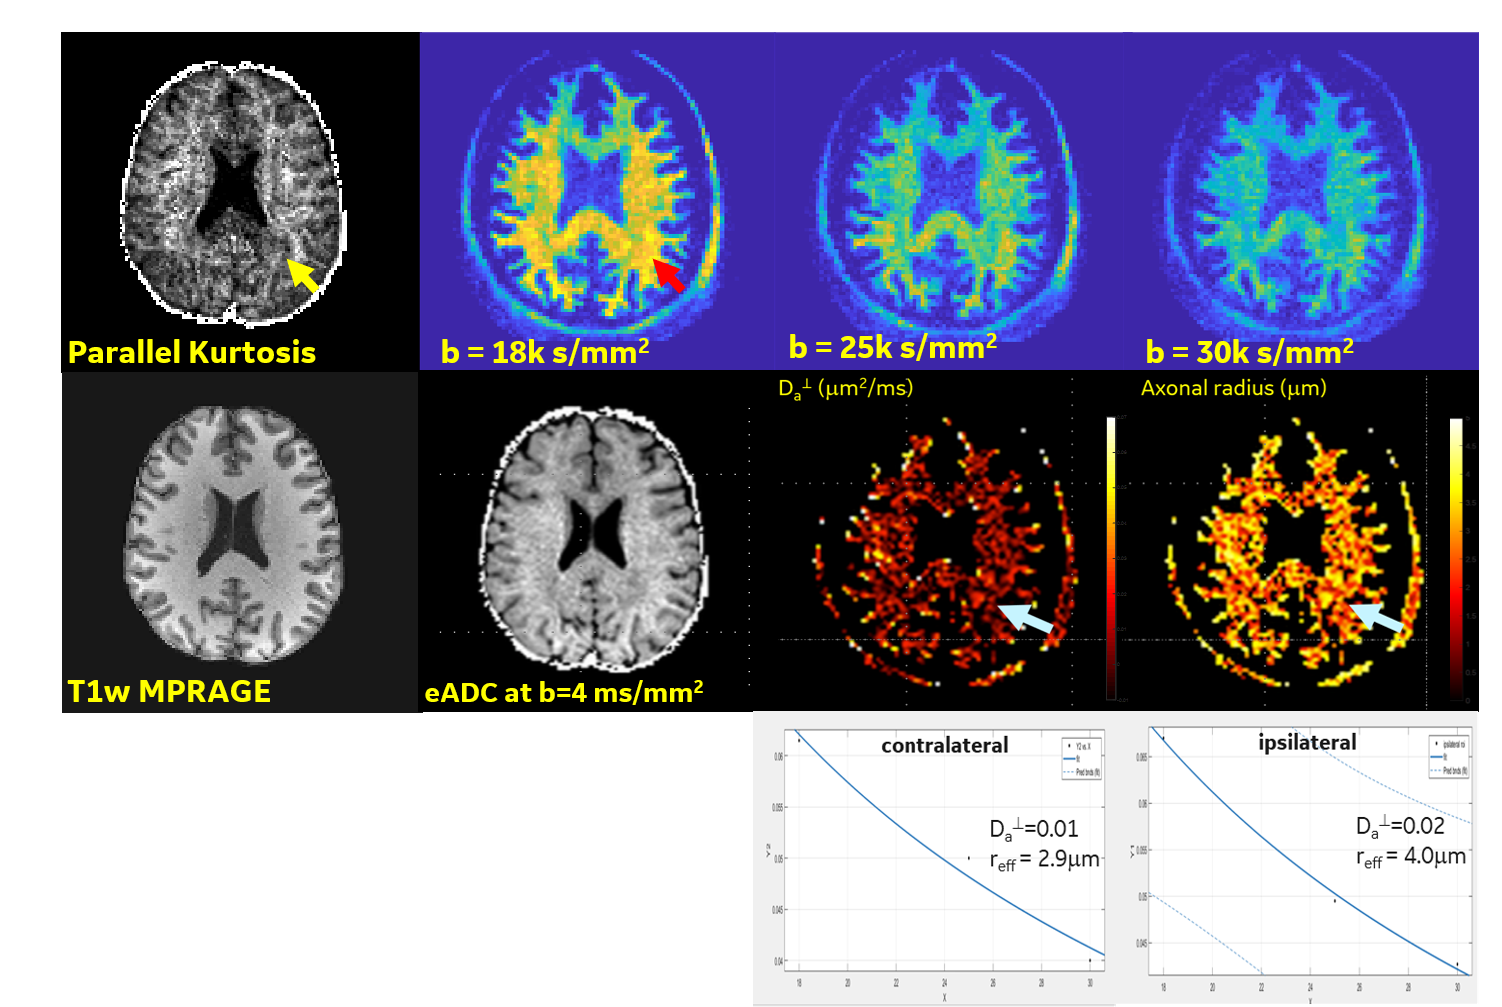
Figure 5. Data from an acute mTBI patient (acquired 9 days post injury) showed decreased parallel kurtosis and increased Da^ and reff in the region of the left occipital lobe. Such changes were not observed in the healthy controls and persisted on the second MRI examination 4 weeks later. This offers a potential new imaging biomarker for axonal injury.