3545
Axon radius mapping using multi-TE diffusion MRI from clinical scanners1Harvard Medical School, BWH, Boston, MA, United States
Synopsis
Diffusion MRI is sensitive to heterogeneity tissue microstructure. Recent methods for axon diameter estimation rely on diffusion MRI data acquired using advanced scanners with b-values higher than 6000 s/mm2 so that signals from extra-axonal components vanish because of the underlying relative high diffusivity. In this work, we introduce a method for axon diameter estimation that uses diffusion MRI with two TEs and relative lower b-values acquired using clinical scanners. Our method separates signals from intra- and extra-axonal components by exploiting the b-value-dependent relaxation coefficients. The performance of the proposed method is demonstrated using in vivo data acquired from a clinical scanner.
Introduction
Accurate axon radius mapping is a fundamental problem in diffusion MRI research. Previous studies have shown that several existing methods provide significantly larger axon radii than results from histology studies [1,2]. The discrepancy is caused by several confounding factors including signals from extra-axonal components, axon dispersions, and relatively stronger signals from larger axons. To overcome the limitations, the recent method for axon-radius mapping [3] has proposed the application of spherical averaged signals to remove effect from axon dispersions and used high b-values based on advanced scanners to eliminate signals from extra-axonal components. Moreover, b-values higher than 6000 s/mm2 were proposed to eliminate signals from extra-axonal components because of relative faster diffusivity. The following model was proposed to fit diffusion signals$$S_{\rm in}(b) = \beta e^{-b D_\perp} b^{-\tfrac12}.~~(1)$$
The parameter $$$D_\perp$$$ is related to the MR-based axon radius via the following equation
$$r_{\rm MR} = \left(\tfrac{48}{7} \delta (\Delta-\delta/3)D_0 D_\perp \right)^{1/4},~~(2)$$
where $$$\Delta, \delta$$$ are the diffusion time and pulse width of the diffusion gradient, $D_0$ represent the diffusivity along axons. $$$r_{\rm MR}$$$ provides an estimate of $$$\left( \langle r^6 \rangle /\langle r^2 \rangle \right)^{1/4}$$$ which is usually higher than the mean axon radius because of the underlying heavy-tail axon-radius distribution.
Method
Modeling: For clinical scanners, e.g. Prisma scanner with Gmax = 80 mT/m, the maximum b-value in a dMRI scan is usually lower than 6000 s/mm2 due to limitations in the signal-to-noise ratio. As a result, signals from extra-axonal components are not completely vanished which may significantly bias the estimated axon radius if Eq. (1) is used fit the data. To overcome the limitations, we proposed a method that integrates dMRI with two different TEs as in [4, 5] to separate intra- and extra-axonal signals and improve axon-radius estimation using the following model$$S(b,TE) = S_{\rm ex} e^{-b D_{\rm ex}-r_{2,{\rm ex}} TE} + S_{\rm in}(b) e^{r_{2,{\rm in}}TE }, ~~(3)$$
where $$$r_{2,{\rm ex} }, r_{2,{\rm in}}$$$ represent the T2 relaxation coefficients of the intra- and extra-axonal space, respectively. In the following analysis, we assume that the maximum b-value is equal to b=6000 s/mm2 and dMRI data is acquired at two TEs.
Estimation methods:
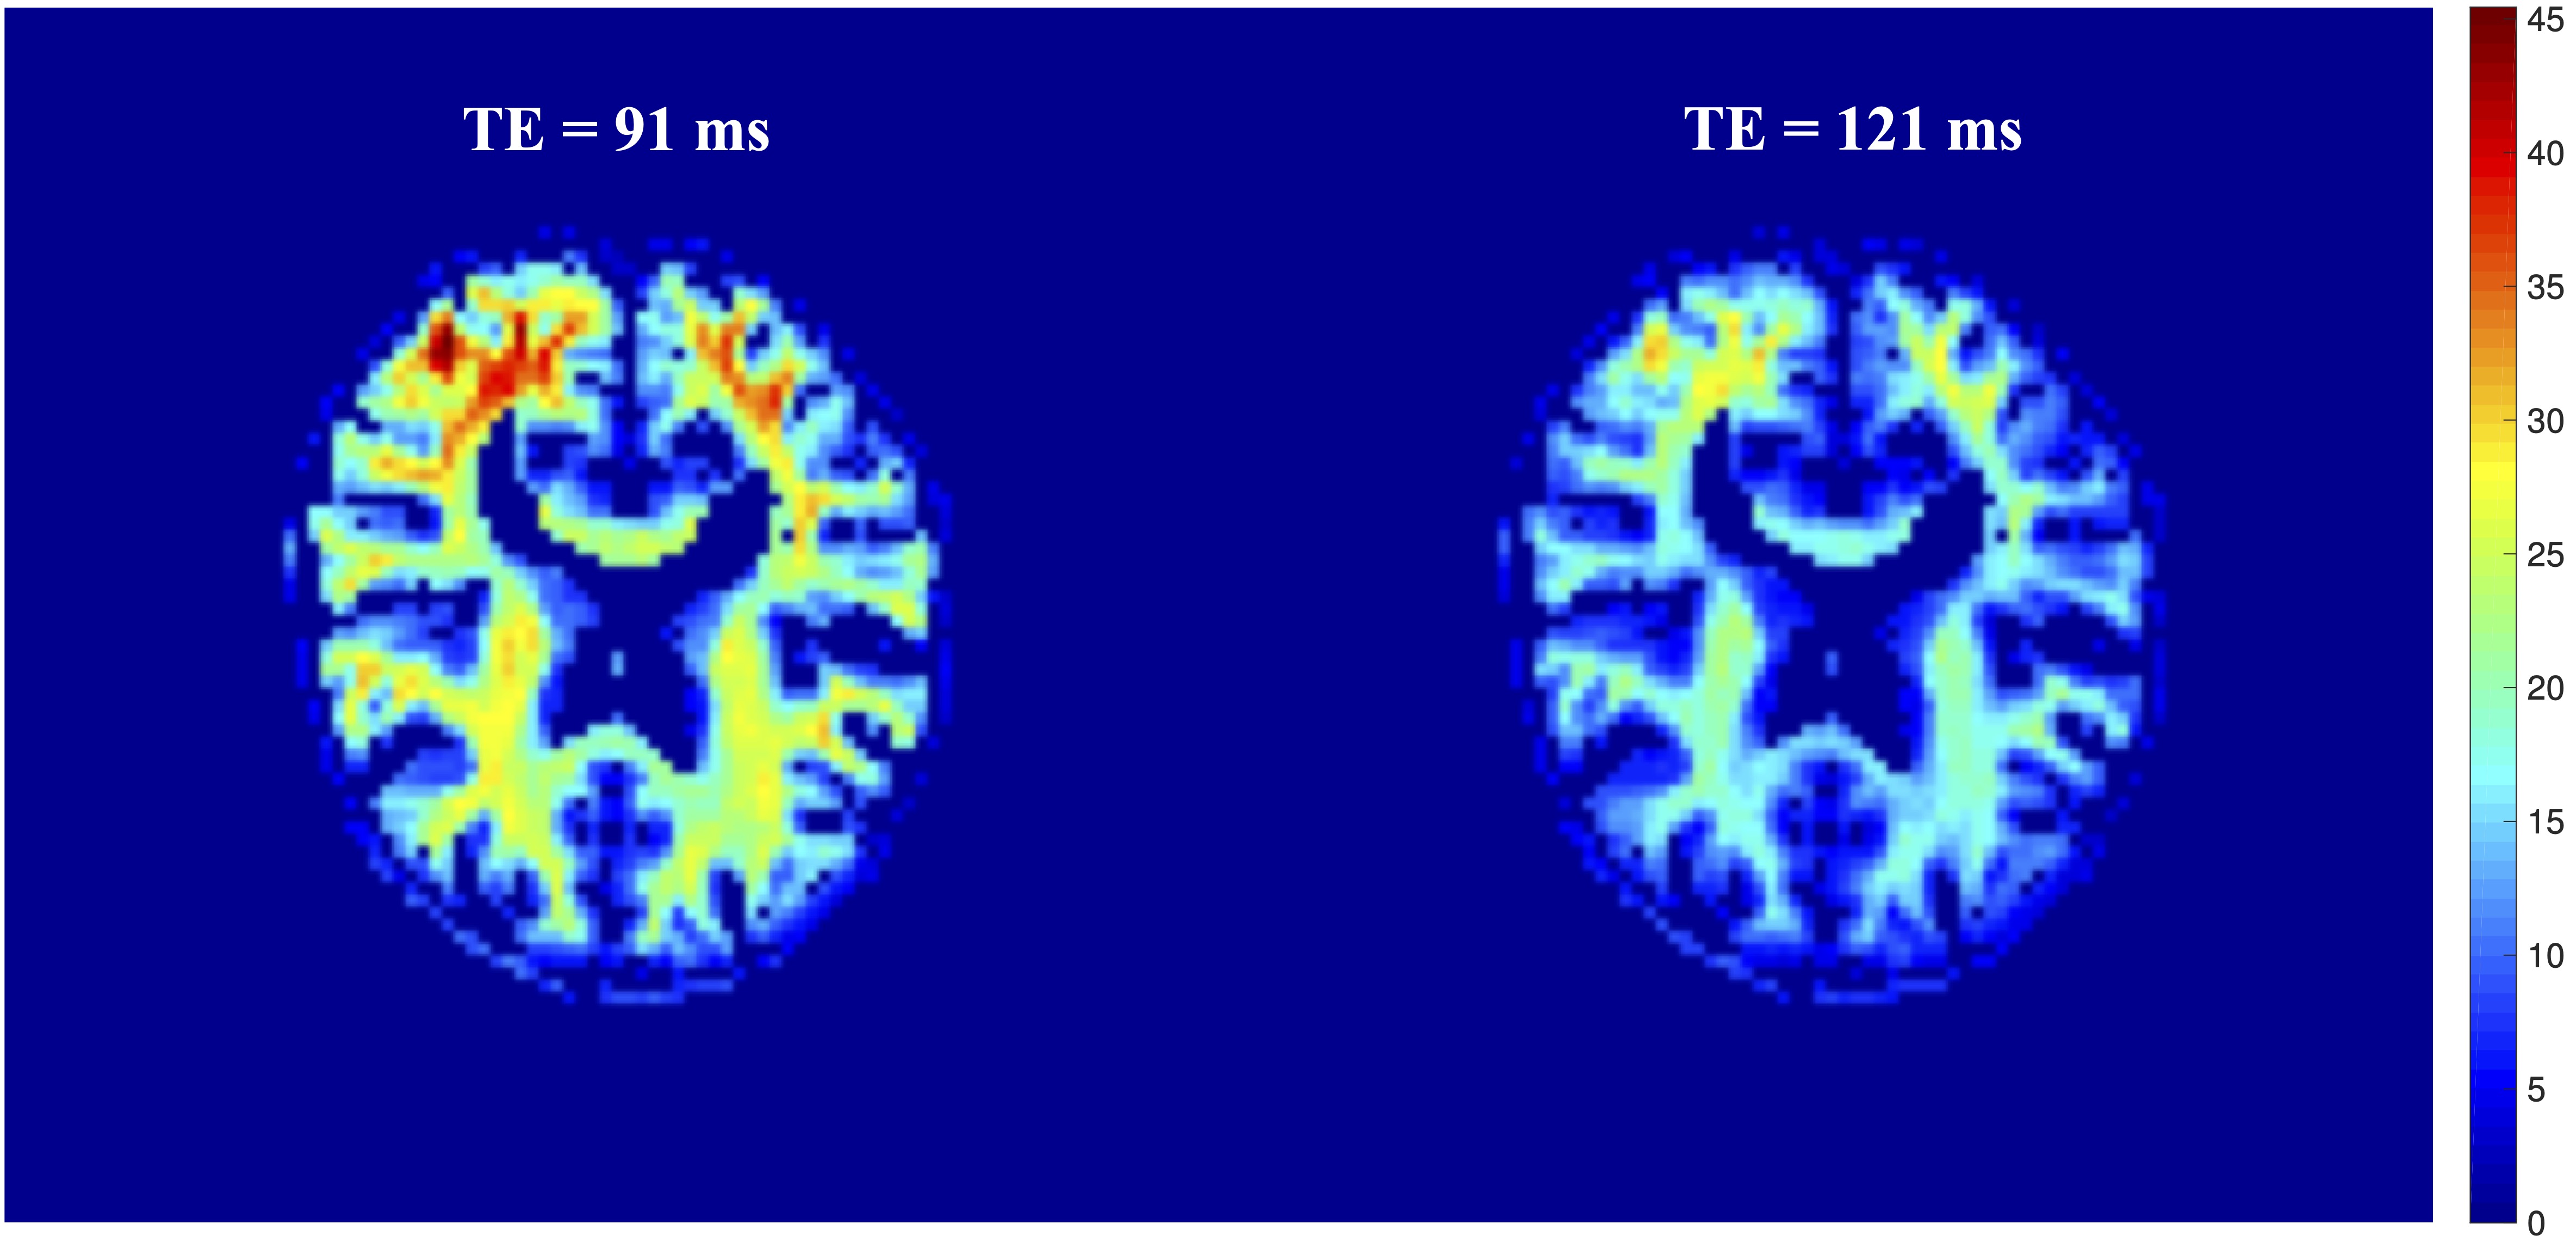
- Estimation of $$$r_{2,{\rm in}}$$$: Signals at the bmax=6000 s/mm2 are assumed only from the intra-axonal space as in [3] because of faster diffusivity in the extra-axonal space. To this end, the relative ratio between spherical-averaged signals at bmax at the two TEs is an exponential function of TEs with $$$r_{2,{\rm in}}$$$ in the exponent. Therefore, $$$r_{2,{\rm in}}$$$ can be directly estimated by fitting an exponential model.
- Estimation of $$$D_{\rm ex}$$$: With $$$r_{2,{\rm in}}$$$ obtained in Step 1, signals from the intra-axonal space at two TEs can cancel each other in the following function
$$h(b) = S(b,TE_1) - S(b,TE_2)e^{r_{2,{\rm in }} (TE_1-TE_2)} = S_{\rm ex} (e^{-r_{2,{\rm ex}}TE_1}- e^{-r_{2,{\rm ex}}(TE_2-TE_1)-r_{2,{\rm in}} TE_2 })e^{-b D_{\rm ex}}.$$
Since $$$h(b)$$$ is an exponential function of $$$-bD_{\rm ex}$$$, $$$D_{\rm ex}$$$ can be estimated based on the relative ratio of $$$h(b)$$$ at low b-values, e.g. b=0 and 1000 s/mm2, similar to Step 1. - Removing the $$$r_{2,{\rm ex}}$$$ variable: To further reduce the dimension of unknown variables and improve the reliability of estimation results, we can express $$$r_{2,{\rm ex}}$$$ in terms of other model parameters by using the following equation
$$e^{-r_{2,{\rm ex}} (TE_2 -TE_1)} = \frac{S(b,TE_2) - S_{\rm in}(b)e^{-r_{2,{\rm in}}TE_2} }{S(b,TE_1) - S_{\rm in}(b)e^{-r_{2,{\rm in}}TE_1}}.$$
Data acquisition: A dMRI dataset with two TEs was acquired using a 3T MAGNETOM Prisma scanner from a healthy human subject using a customized sequence to ensure consistent diffusion time and pulse width across scans. The scan parameters are as follows: TE = 91, 121 ms, TR = 3900ms, 2.5 mm isotropic voxels, PF=6/8, iPAT=2. Diffusion weighted images were acquired along 30 gradient directions at b=1000, 3000, 4000, 5000, 6000 s/mm2 for each TEs together with 5 b=0 s/mm2 volumes and Delta = 59.2 ms and delta=15.1ms.
Results
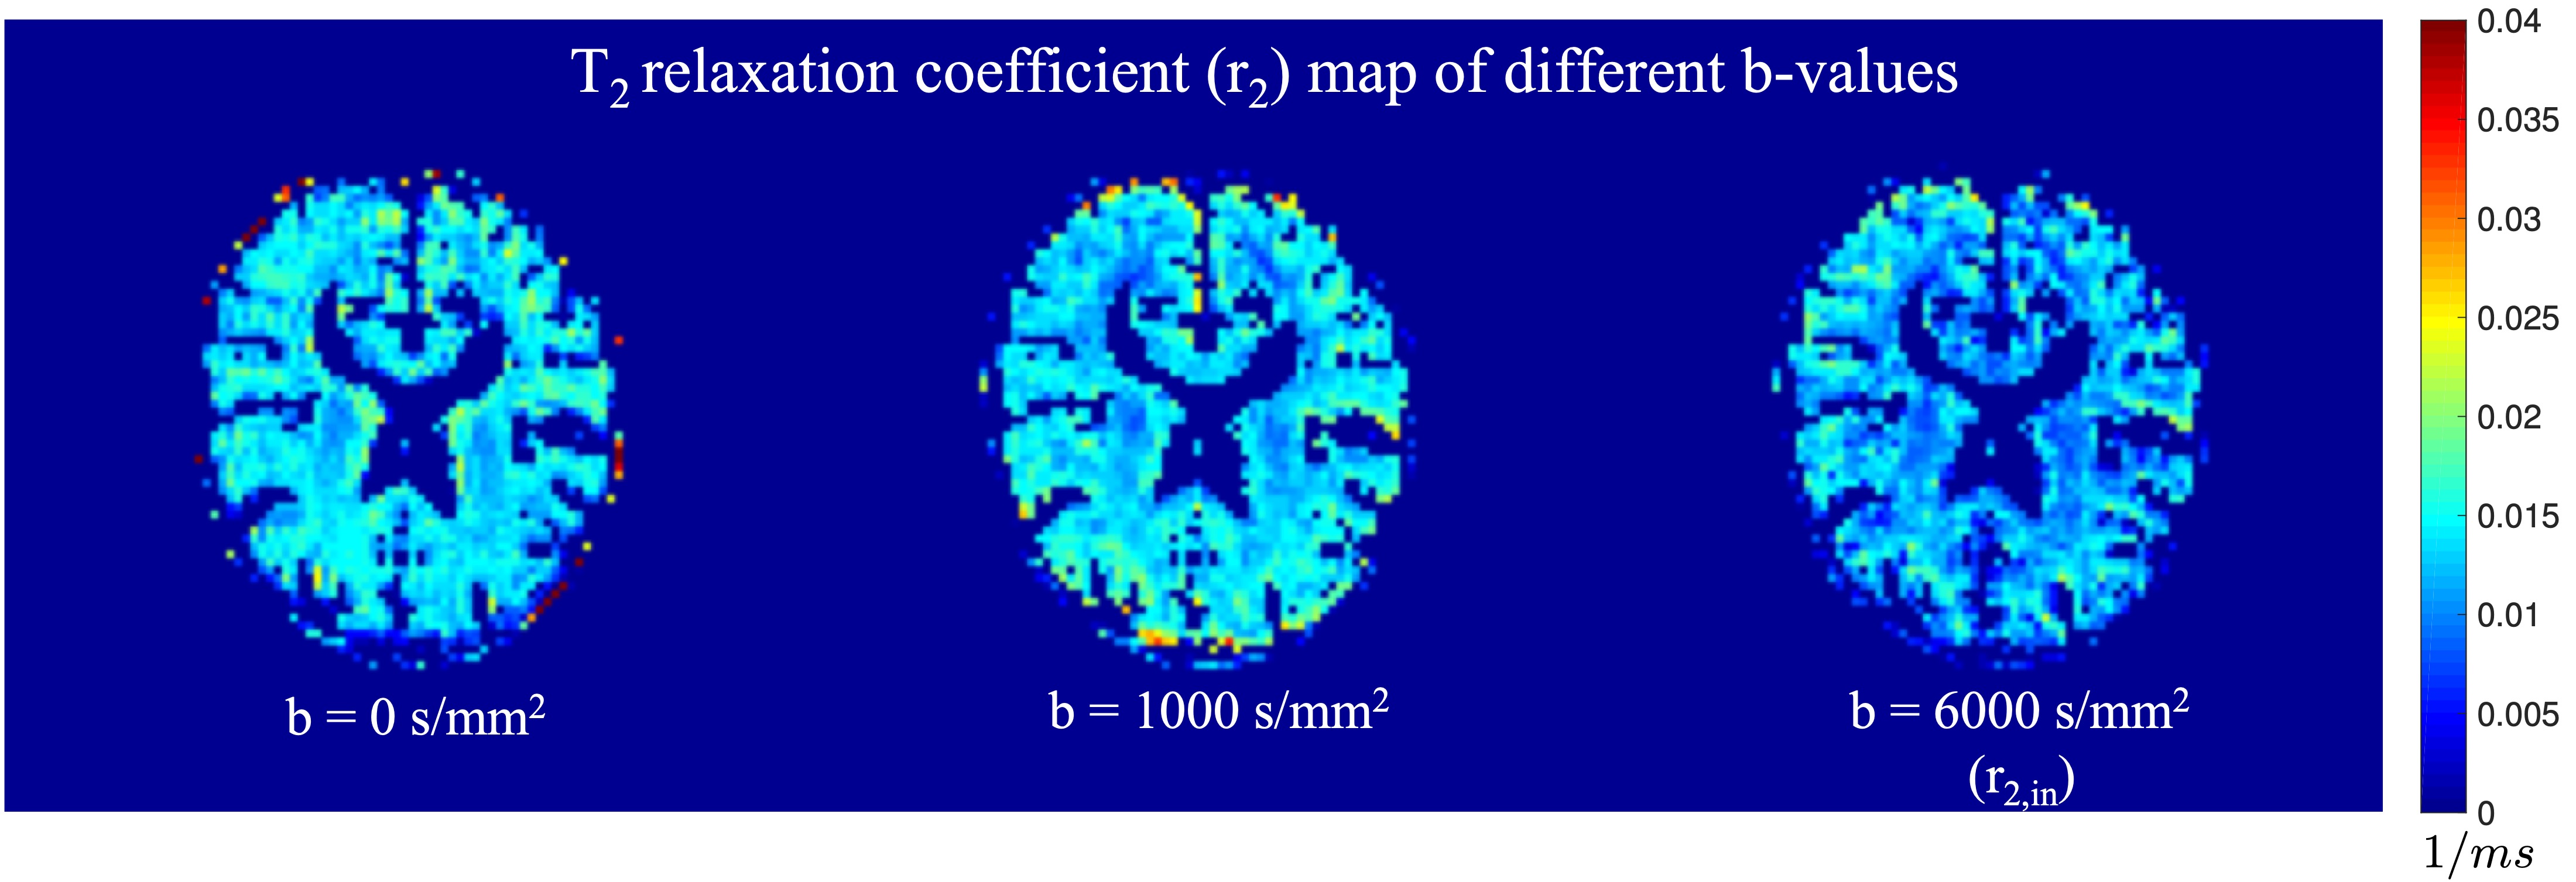
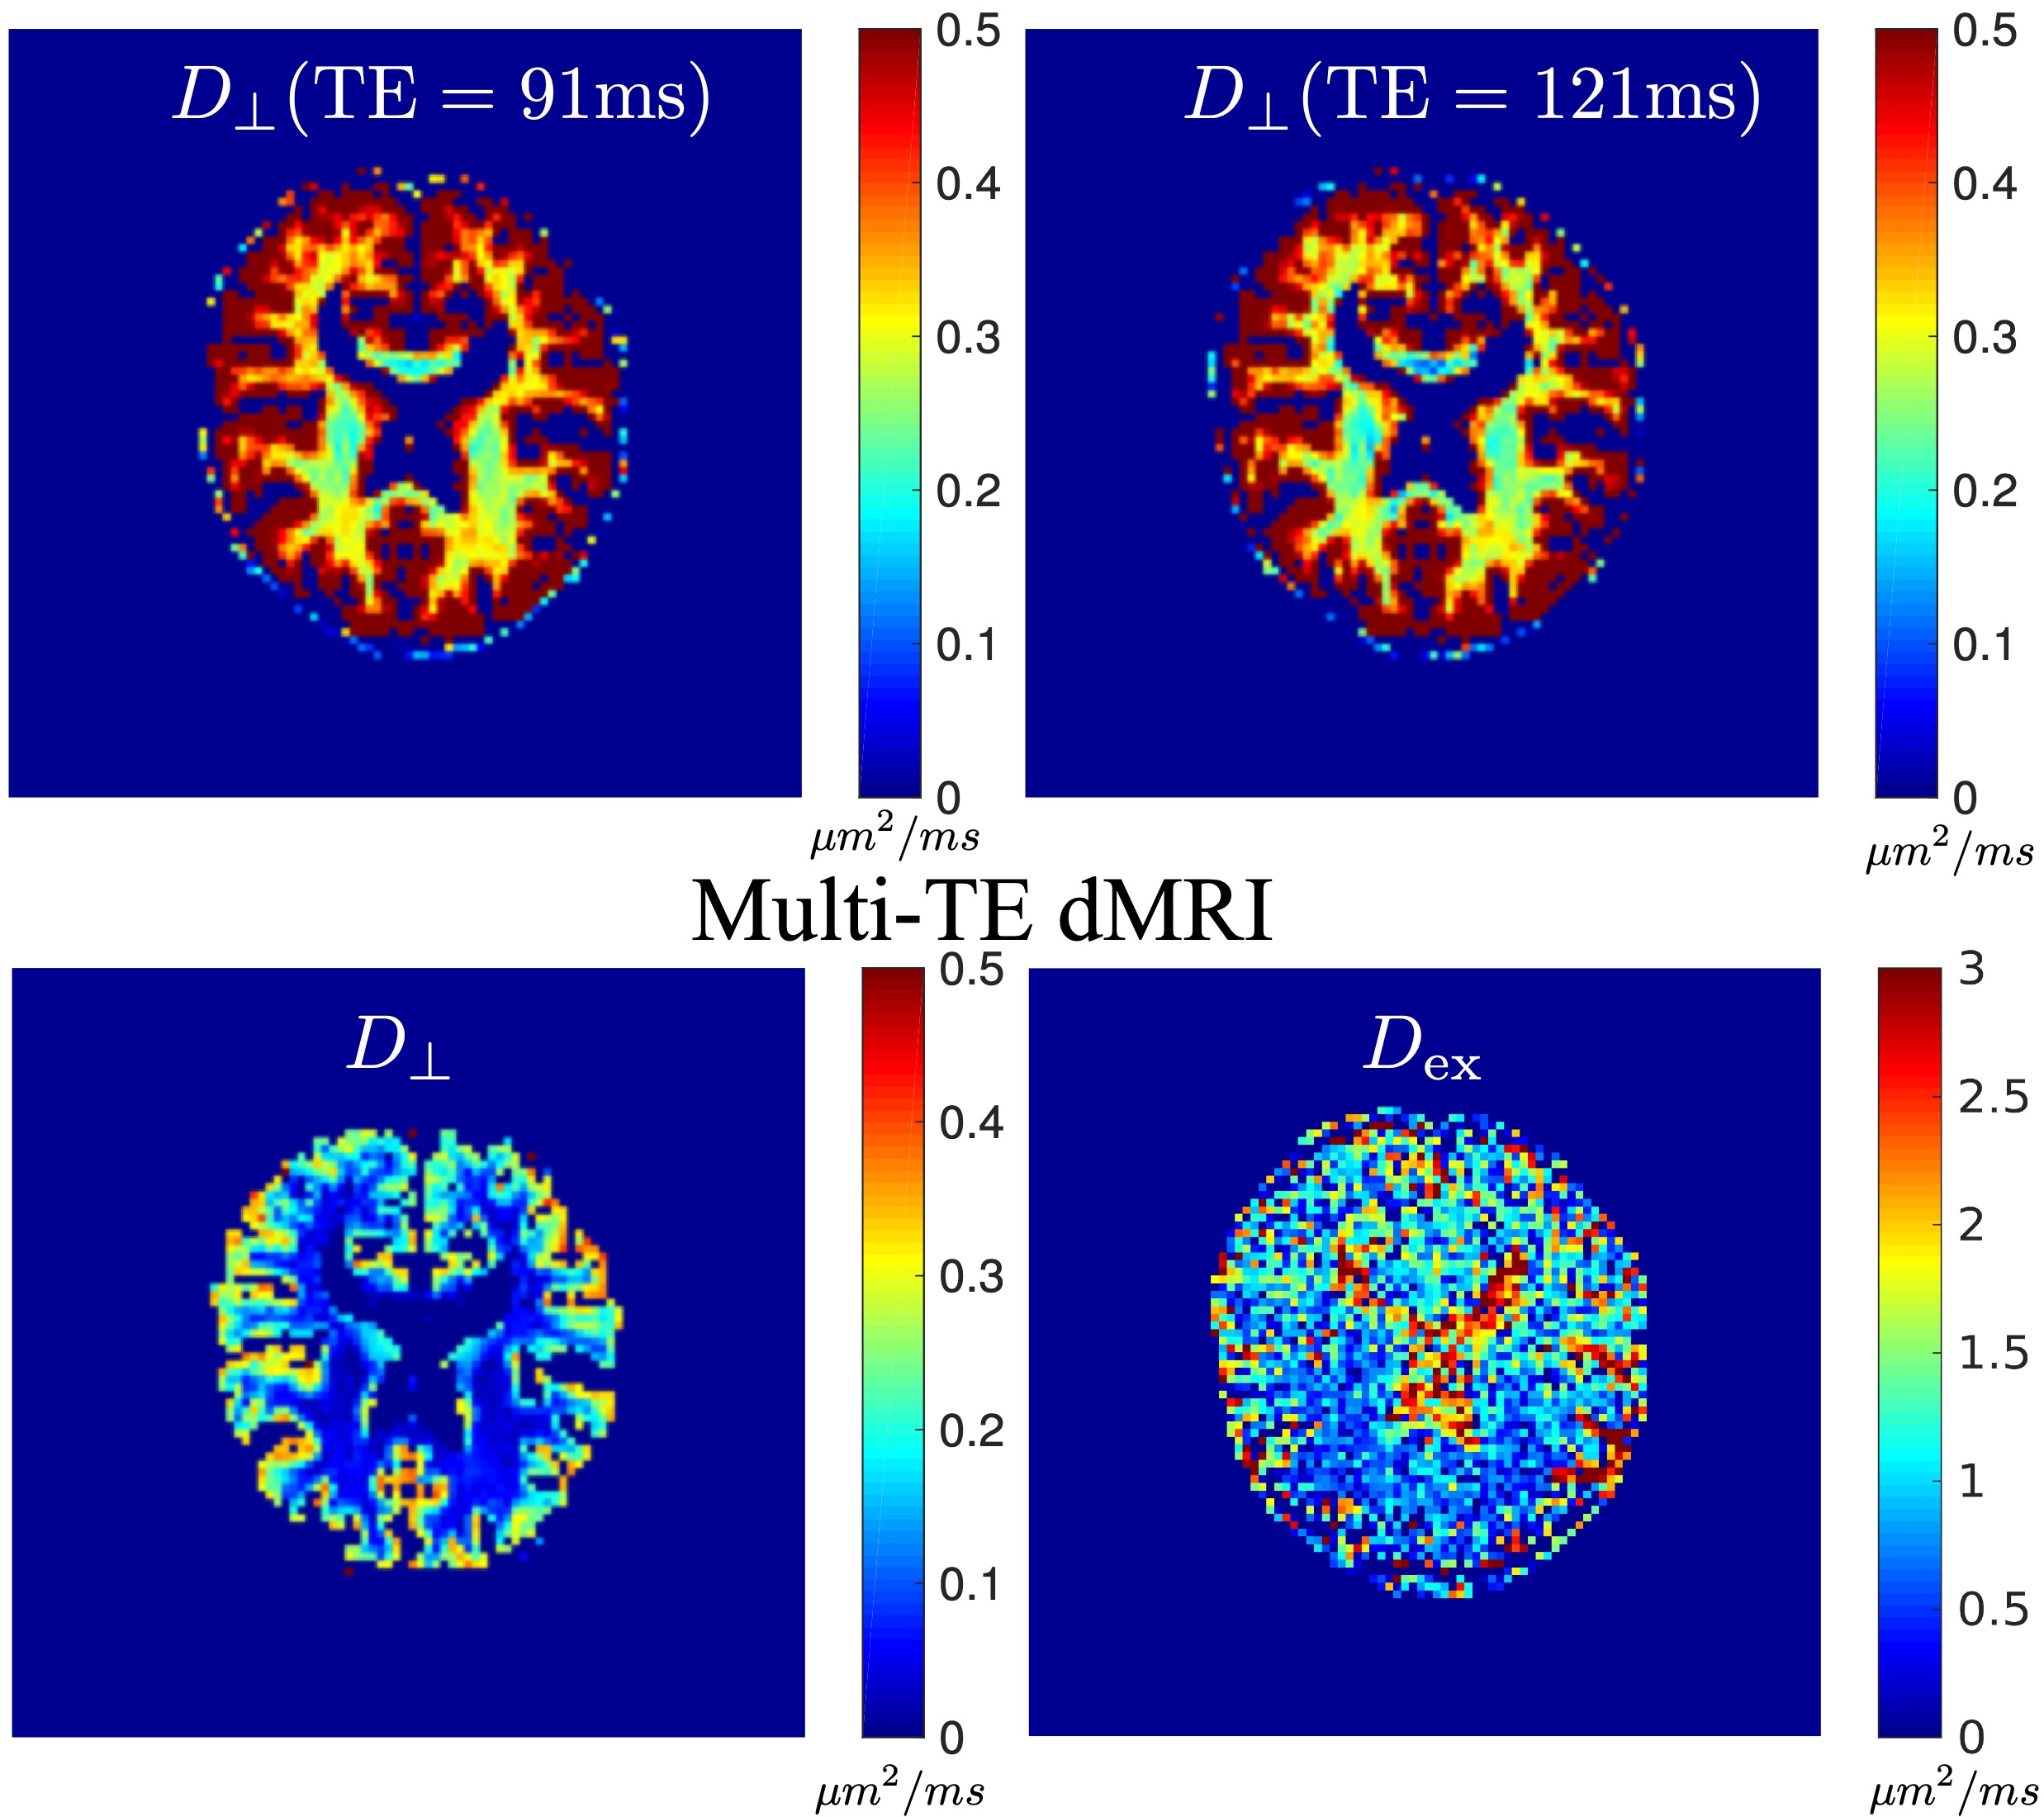
Figure 1 shows the spherical averaged signals at b=6000 s/mm2 at two TEs. The relatively large voxel size and the spherical average method have provided high-quality signals for reliable estimation of model parameters, in particular the $$$r_{2, {\rm in}}$$$ parameter as Step 1 of the estimation method. Figure 2 illustrates the $$$r_2$$$ parameters estimated using dMRI data at different b-values, which clearly shows that the T2 relaxation coefficients depend on b values.The first row of Figure 3 shows the estimated $$$D_\perp$$$ using dMRI signals from each TE separately without considering any extra-axonal signals. For comparison, the second row illustrates the $$$D_\perp$$$ and $$$D_{\rm ex}$$$ using the proposed method based on joint analysis of multi-TE dMRI data where $$$D_\perp$$$ has much lower values than results in the first row.
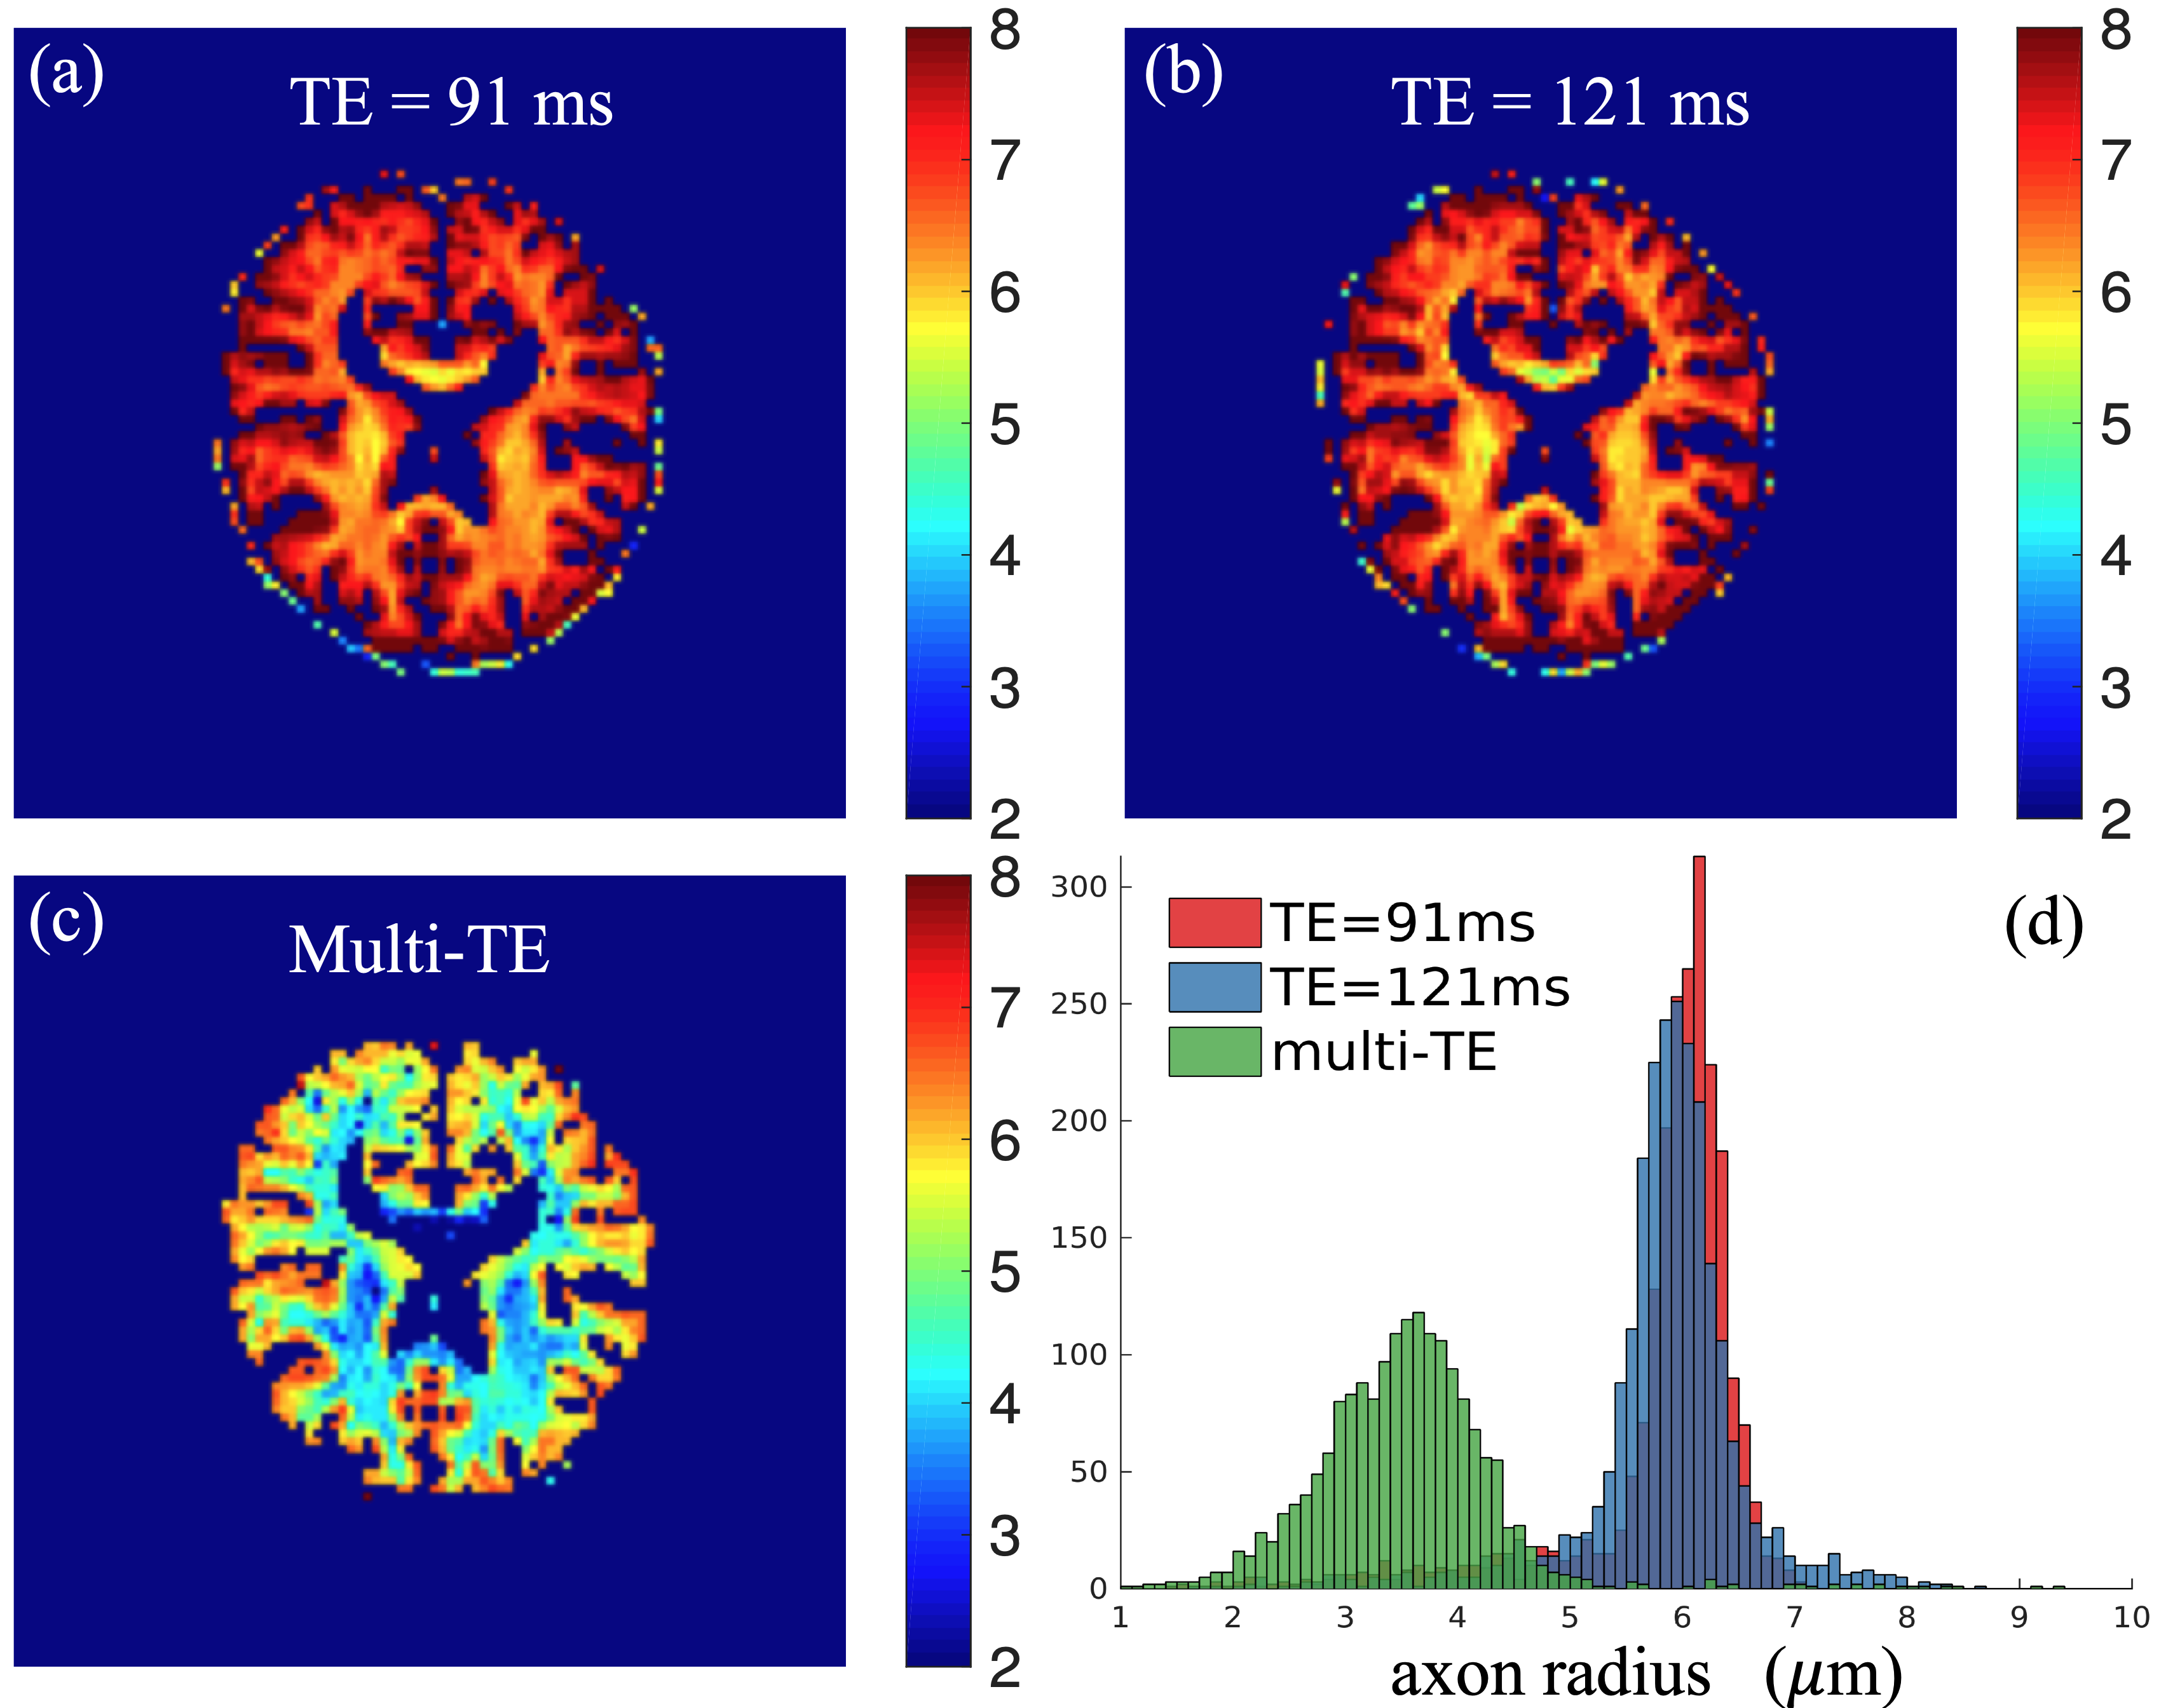
Figure 4 shows the MR-based axon-radius map based on the estimated $$$D_{\perp}$$$ and Eq. (2). The proposed method has provided much lower axon-radius than results from single-TE data and is closer to results from histology studies.
Discussion and Conclusion
We introduce a novel method that uses multi-TE diffusion MRI data for axon-radius mapping. The proposed method can provide reasonable results using in vivo data from a clinical scanner.Acknowledgements
The authors acknowledge funding support by NIH grants K01MH117346, R01MH125860.References
1) Assaf, Y., Blumenfeld-Katzir, T., Yovel, Y., and Basser, P. J. (2008). Axcaliber: a method for measuring axon diameter distribution from diffusion MRI. Magn. Reson. Med. 59, 1347–1354. doi: 10.1002/mrm.21577.
2) Alexander, D. C., Hubbard, P. L., Hall, M. G., Moore, E. A., Ptito, M., Parker, G. J., et al. (2010). Orientationally invariant indices of axon diameter and density from diffusion MRI. Neuroimage 52, 1374–1389. doi: 10.1016/j.neuroimage.2010.05.043.
3) Verraart, J., Nunes, D., Rudrapatna, U., Fieremans, E., Jones, D.K., Novikov, D.S., Shemesh, N., (2020). Noninvasive quantification of axon radii using diffusion MRI. eLife, 9:e49855 DOI: 10.7554/eLife.49855.
4) Ning, L., Gagoski, B., Szczepankiewicz, F., Westin, C.-F., Rathi, Y., (2020), Joint RElaxation-Diffusion Imaging Moments to Probe Neurite Microstructure. IEEE Trans. Med. Imaging. 39(3):668-677. doi: 10.1109/TMI.2019.2933982.
5) Slater, P.J., Palombo, M., Miller, K.L., Westin, C.-F., Laun, F., Kim, D., Haldar, J.P., Benjamini, D., Lemberskiy, G., de Almeida Martins, J.P., Hutter, J. (2021) Combined diffusion-relaxometry microstructure imaging: Current status and future prospects. Mag. Res. Med. 86(6): 2987-3031.
Figures