3544
Simultaneous Mapping of Water Diffusion Coefficients and Metabolite Distributions of the Brain Using MRSI without Water Suppression1Department of Electrical and Computer Engineering, University of Illinois at Urbana-Champaign, Urbana, IL, United States, 2Beckman Institute for Advanced Science and Technology, University of Illinois at Urbana-Champaign, Urbana, IL, United States, 3Radiology Department, Fifth People's Hospital of Shanghai, Fudan University, Shanghai, China, 4School of Biomedical Engineering, Shanghai Jiao Tong University, Shanghai, China, 5Department of Bioengineering, University of Illinois at Urbana-Champaign, Urbana, IL, United States
Synopsis
The feasibility of high-resolution metabolic imaging using water-unsuppressed MRSI has been recently demonstrated in clinical settings using SPICE. This work utilizes the unsuppressed water spectroscopic signals for distortion-free mapping of water diffusion coefficients, thus adding a new feature to SPICE for multi-modal brain mapping. Experimental results demonstrated that simultaneous distortion-free diffusion imaging at 1.0×1.0×2.0 mm3 resolution and metabolic imaging at 2.0×3.0×3.0 mm3 nominal resolution were successfully obtained in a total 8-min scan.
Introduction
Diffusion imaging and metabolic imaging provide complementary information of the brain. There is an increasing interest in including both imaging modalities in clinical applications such as stroke and cancer imaging to improve diagnostic specificity and accuracy1-3. In current practice, diffusion MRI and MRSI data are acquired using separate sequences such as single-shot spin-echo EPI and CSI, respectively4,5. However, single-shot EPI suffers from geometric distortion and limited resolution, and CSI is limited by low resolution and long scan time (more than 20 minutes). Current separate acquisition is not only time consuming, but also challenging for registration given the distortion of diffusion MRI and low SNR, low resolution of MRSI data. In this work, we present a new method to achieve simultaneous diffusion and metabolic imaging built on our recent progress in water-unsuppressed MRSI using SPICE6-10. The SPICE sequence was extended with diffusion-preparation pulses for mapping of diffusion coefficients; and the (k, t)-space was highly sparsely sampled. Furthermore, the unsuppressed water signals of SPICE were incorporated into a generalized series (GS) model for reconstruction and correction of the data corrupted by physiological motion. As a result, distortion-free diffusion images, ADC maps at 1.0×1.0×2.0 mm3 and metabolite maps at 2.0×3.0×3.0 mm3 resolution were simultaneously obtained in an 8-minute scan.Methods
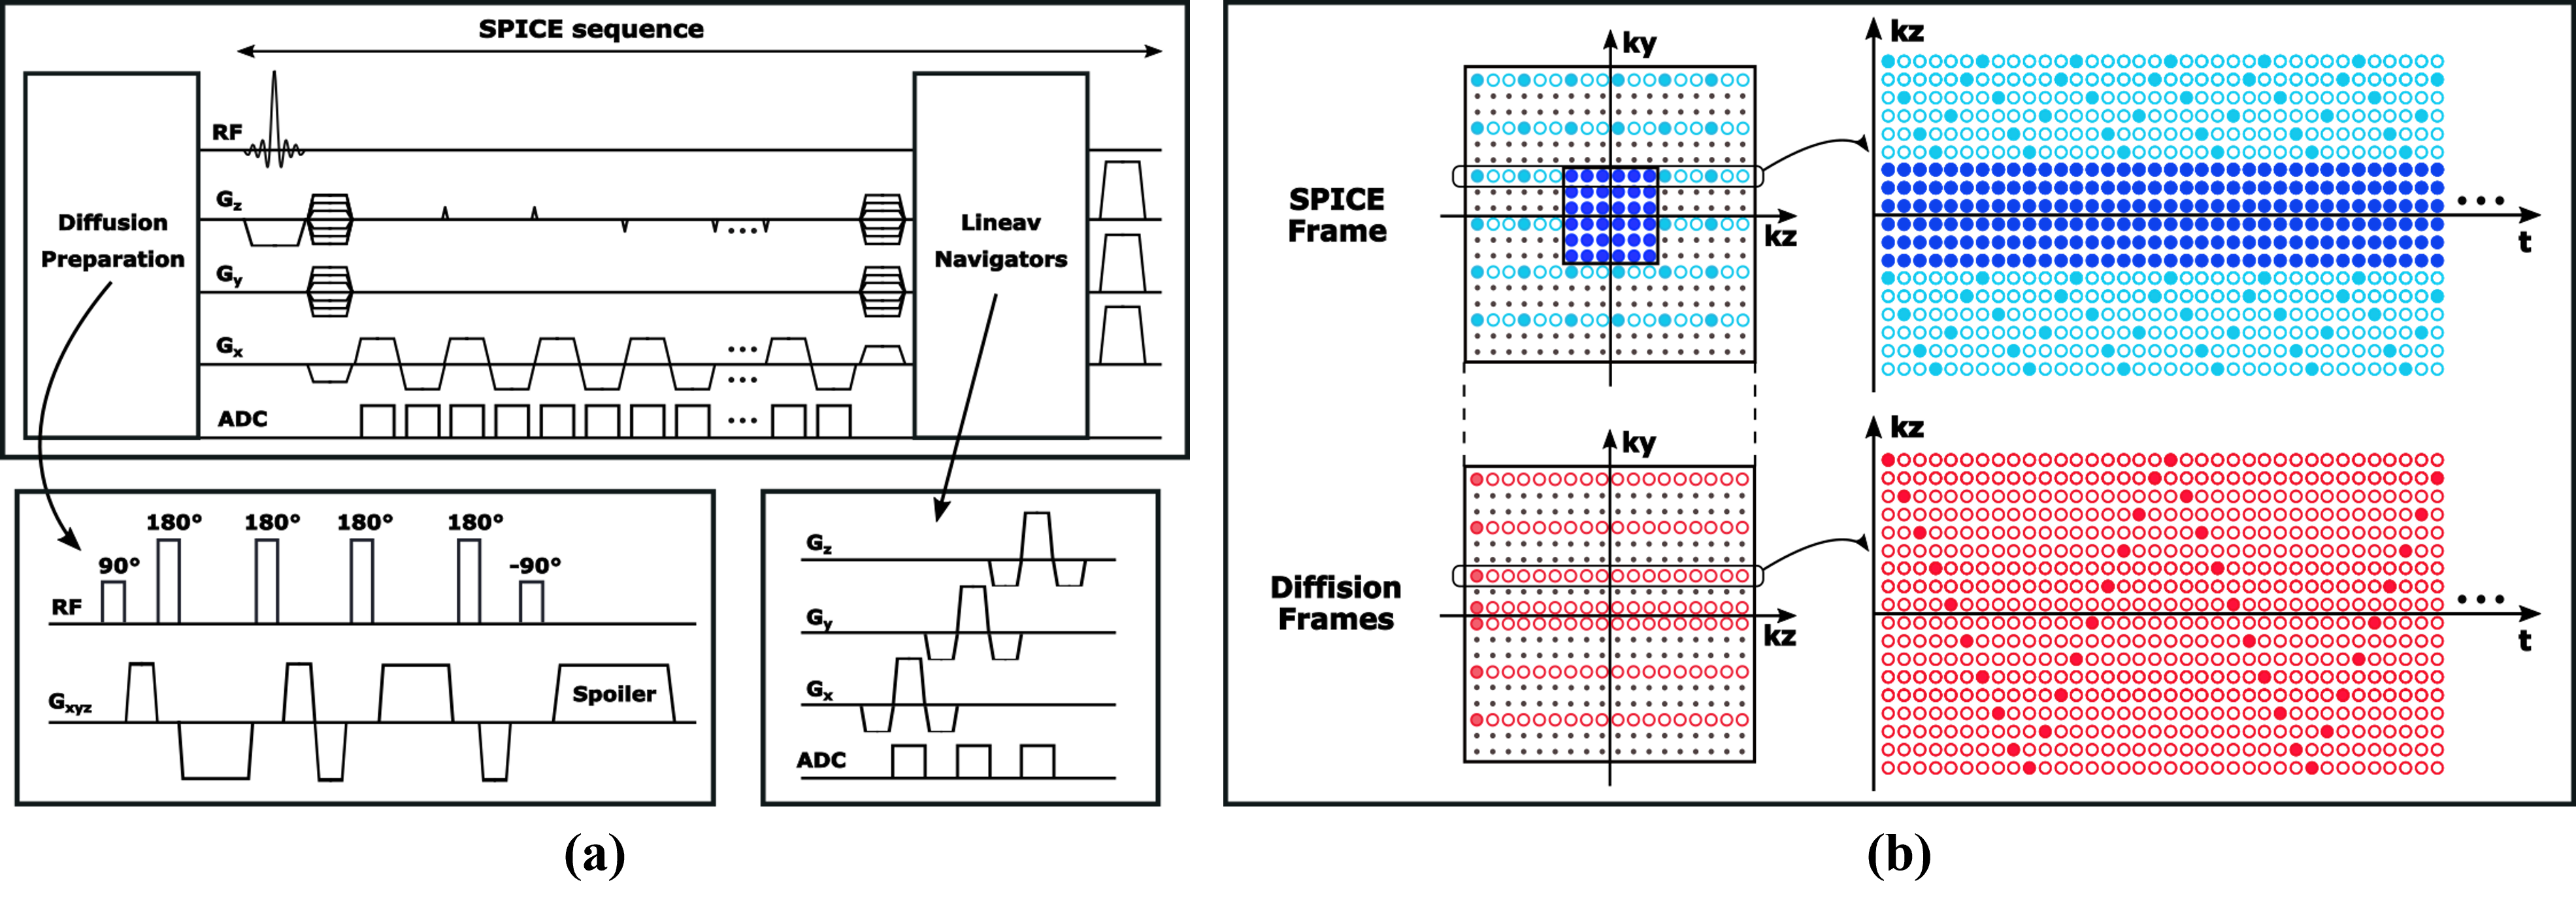
Data Acquisition: As illustrated in Fig. 1(a), the proposed acquisition sequence kept the basic features of the SPICE sequence for water-unsuppressed MRSI while extending with a diffusion preparation module for mapping of water diffusion. The diffusion preparation pulses included three pairs of hard pulses to reduce sensitivity to B0 and B1 inhomogeneity. At the end of each TR, linear navigators in orthogonal directions were embedded to detect whether the data were corrupted by physiological motion. Figure 1(b) shows the sampling pattern of (k, t)-space: first, metabolite signals and high-resolution water signals were acquired using SPICE sequence 10; then diffusion frames with different b values and directions followed; (k, t)-spaces of the diffusion frames were sparsely sampled using CAIPIRINHA trajectories (the spatiotemporal undersampling factor was 388, while the effective spatial undersampling factor is only 2.7 if the temporal encodings were regarded as for spatial encodings) 11, resulting in a 10-second scan time for each diffusion frame. The acquisition parameters of the current implementation were: FOV: 240×240×72 mm3, TR/TE: 160/1.6 ms, matrix size = 110×216×72, b-value = 0, 500 or 1000 s/mm2 in three orthogonal directions, scan time: 7:20 min for SPICE frame, 0:40 min for diffusion frames, thus 8 min in total.Data Processing: Given the acquisition sequence, the differences between the signals in the SPICE frame and the diffusion frames were only diffusion weighting which does not affect FID decay process. Therefore, the relationship between the spatiotemporal functions of the SPICE frame (denoted as $$$\rho_r(x,t)$$$) and diffusion frames (denoted as $$$\rho_i(x,t)$$$) could be expressed using a low order GS model 12:
$$\rho_i(\mathbf{x},t)=\rho_r(\mathbf{x},t)\cdot \sum_{n_i=-N_i/2}^{N_i/2}{c_{n_i}(\mathbf{x})e^{i2{\pi}n_i{\Delta}ft}}$$
where $$$i$$$ denotes a specific diffusion frame, $$$c_{n_i}(x)$$$ the GS coefficients and $$$N_i$$$ the model order. Reconstruction of $$$\rho_i(x,t)$$$ from the sparse data (denoted as $$$d_i$$$) can be done by solving the following optimization problem:
$$\widehat{c}_i={\mathrm{arg}}{\mathrm{min}}_{c_i}\left \| d_i-{\Omega}FBS(G(\rho_r)c_i))) \right \|_2^2 + R(c_i)$$
where $$$c_i$$$ and $$$\rho_r$$$ are the vector forms of {$$$c_{n_i}(x)$$$} and $$$\rho_r(x,t)$$$, $$$\Omega,F,B,S,G,R$$$ operators representing k-space sampling, Fourier transform, field inhomogeneity, coil sensitivity, GS modeling and regularization, respectively. With $$$\widehat{c}_i$$$ being determined, reconstructed diffusion signals $$$\widehat{\rho}_i(x,t)$$$ could be synthesized using the GS model and the SPICE signals.
To correct the errors caused by the physiological motion, first, we identified the corrupted TRs and corresponding data using the navigator signals. Then, the corrupted (k, t)-space data were discarded and interpolated using the uncorrupted data through GS-based reconstruction with stronger constraints. The final reconstruction results were generated from the corrected data.
The generation of metabolite maps from the SPICE frame followed the existing methods5-10.
Results
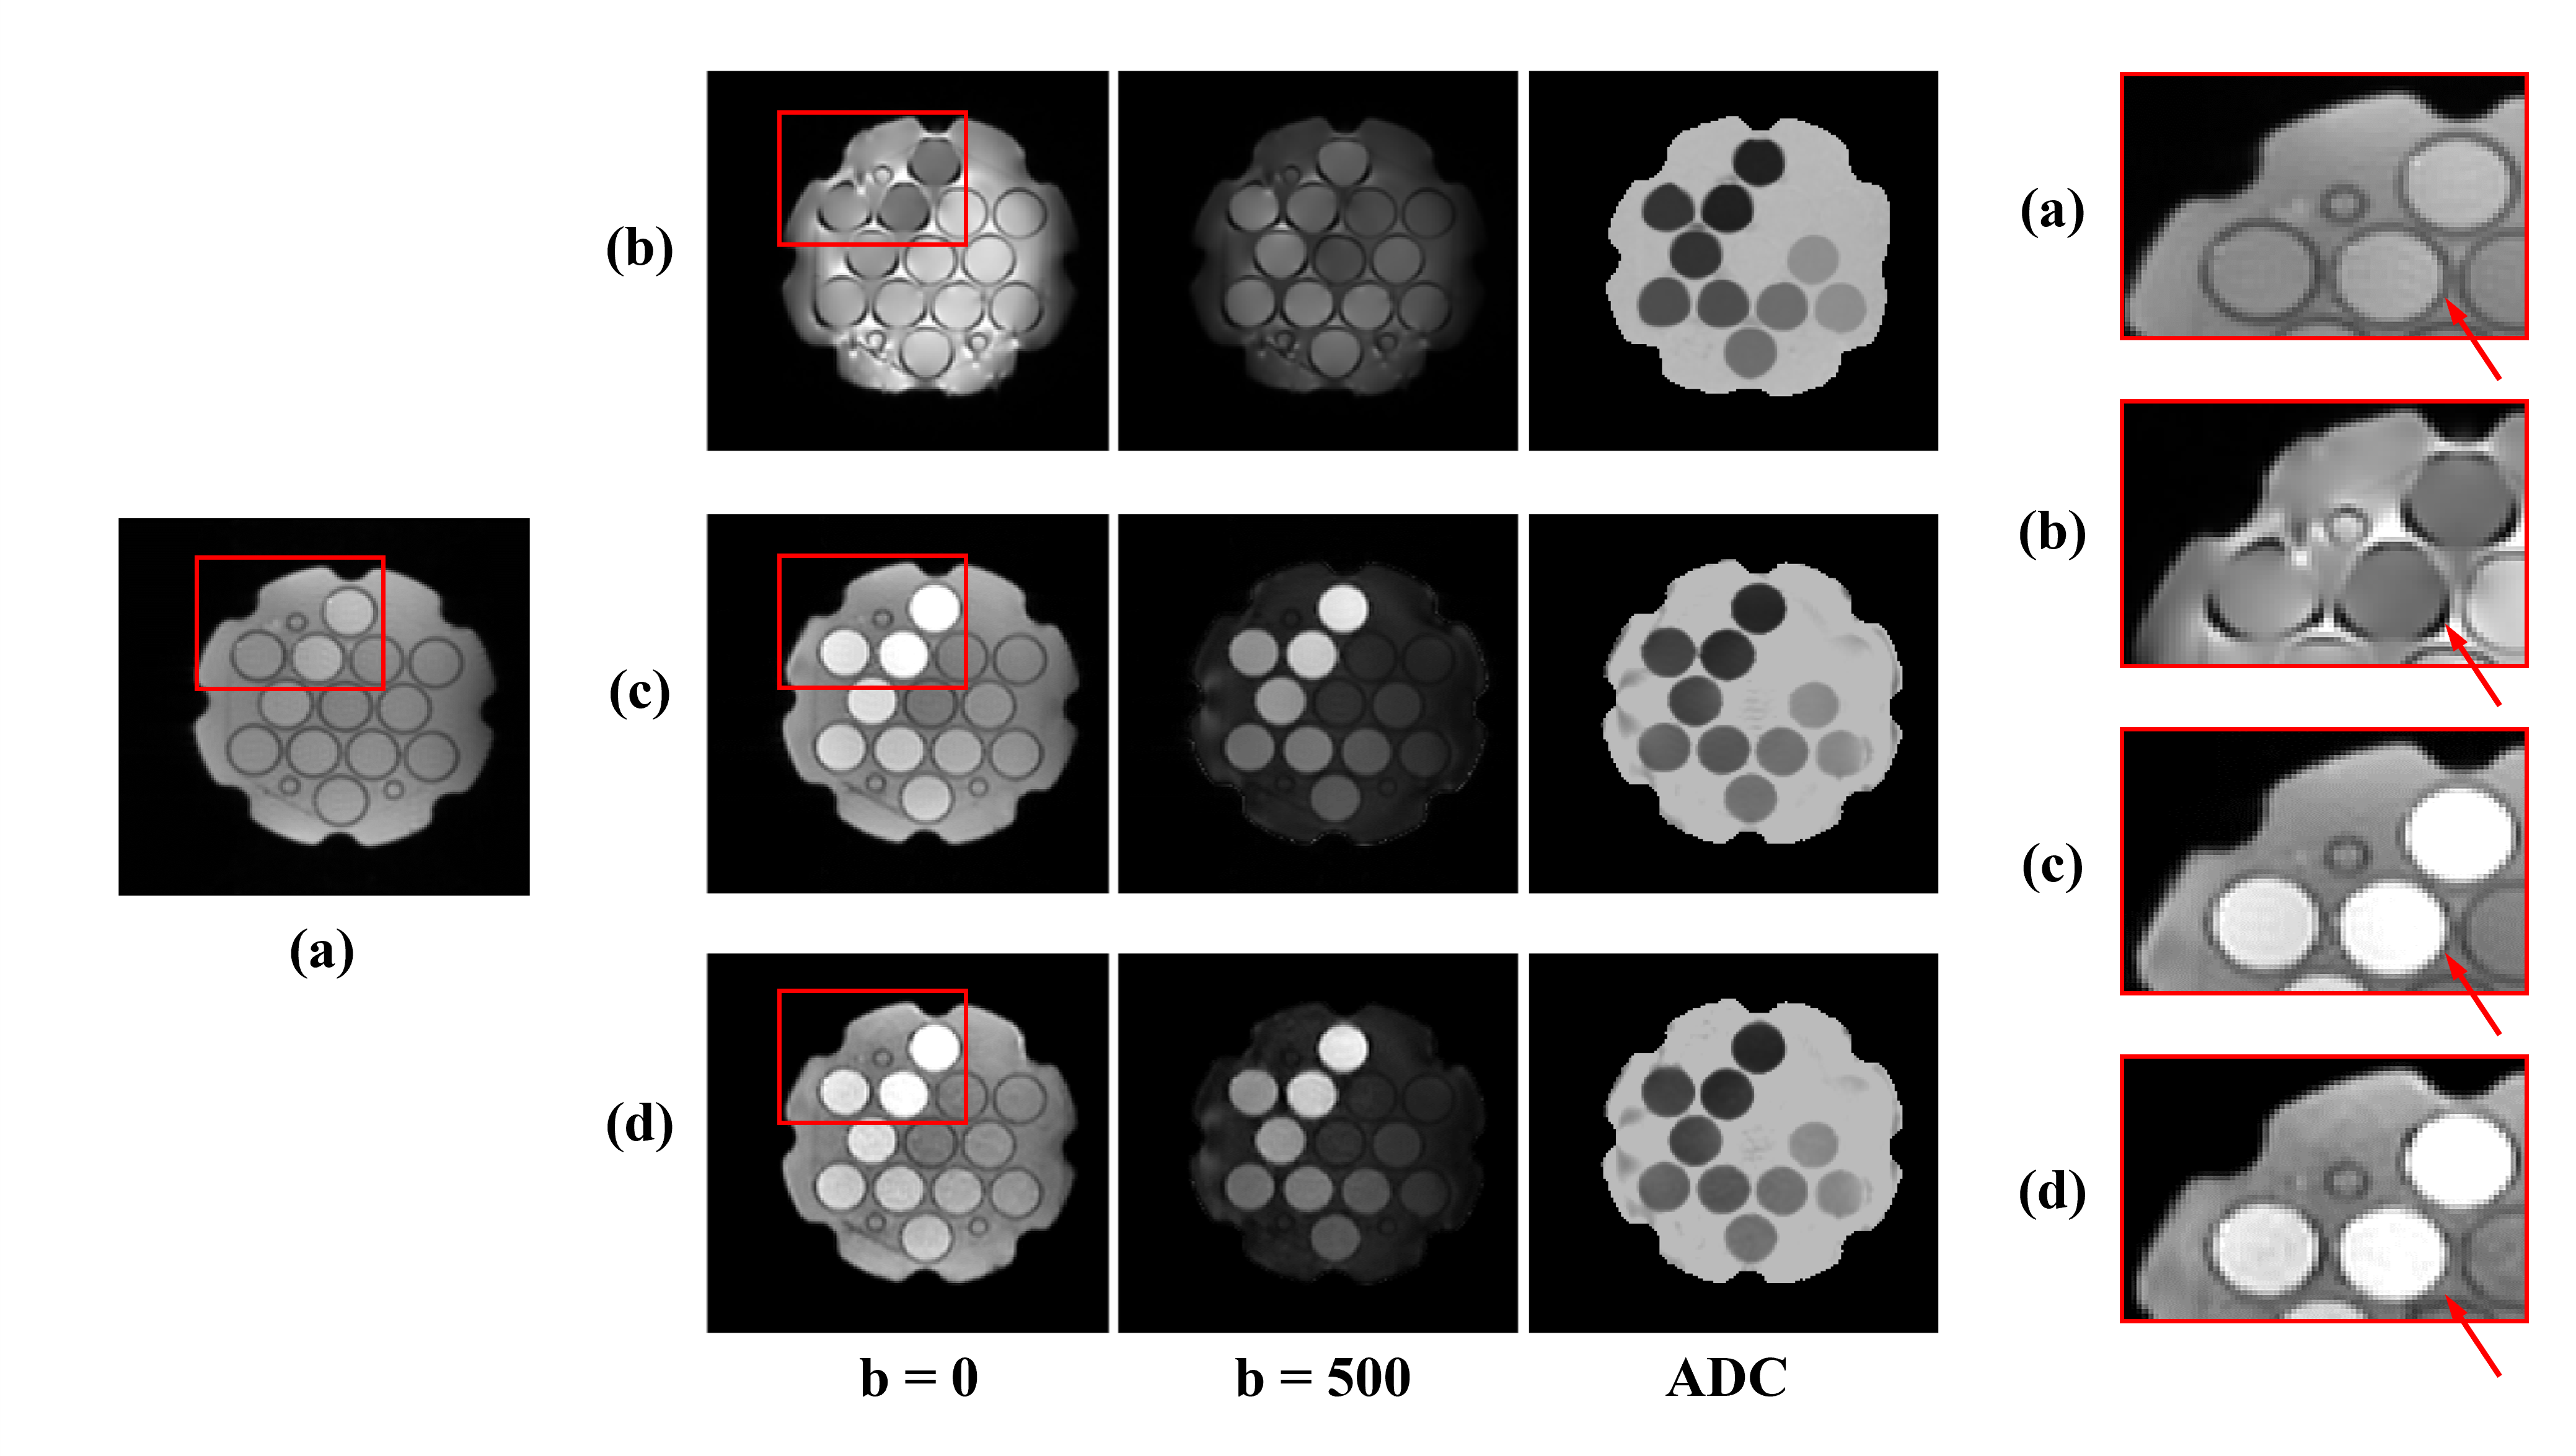
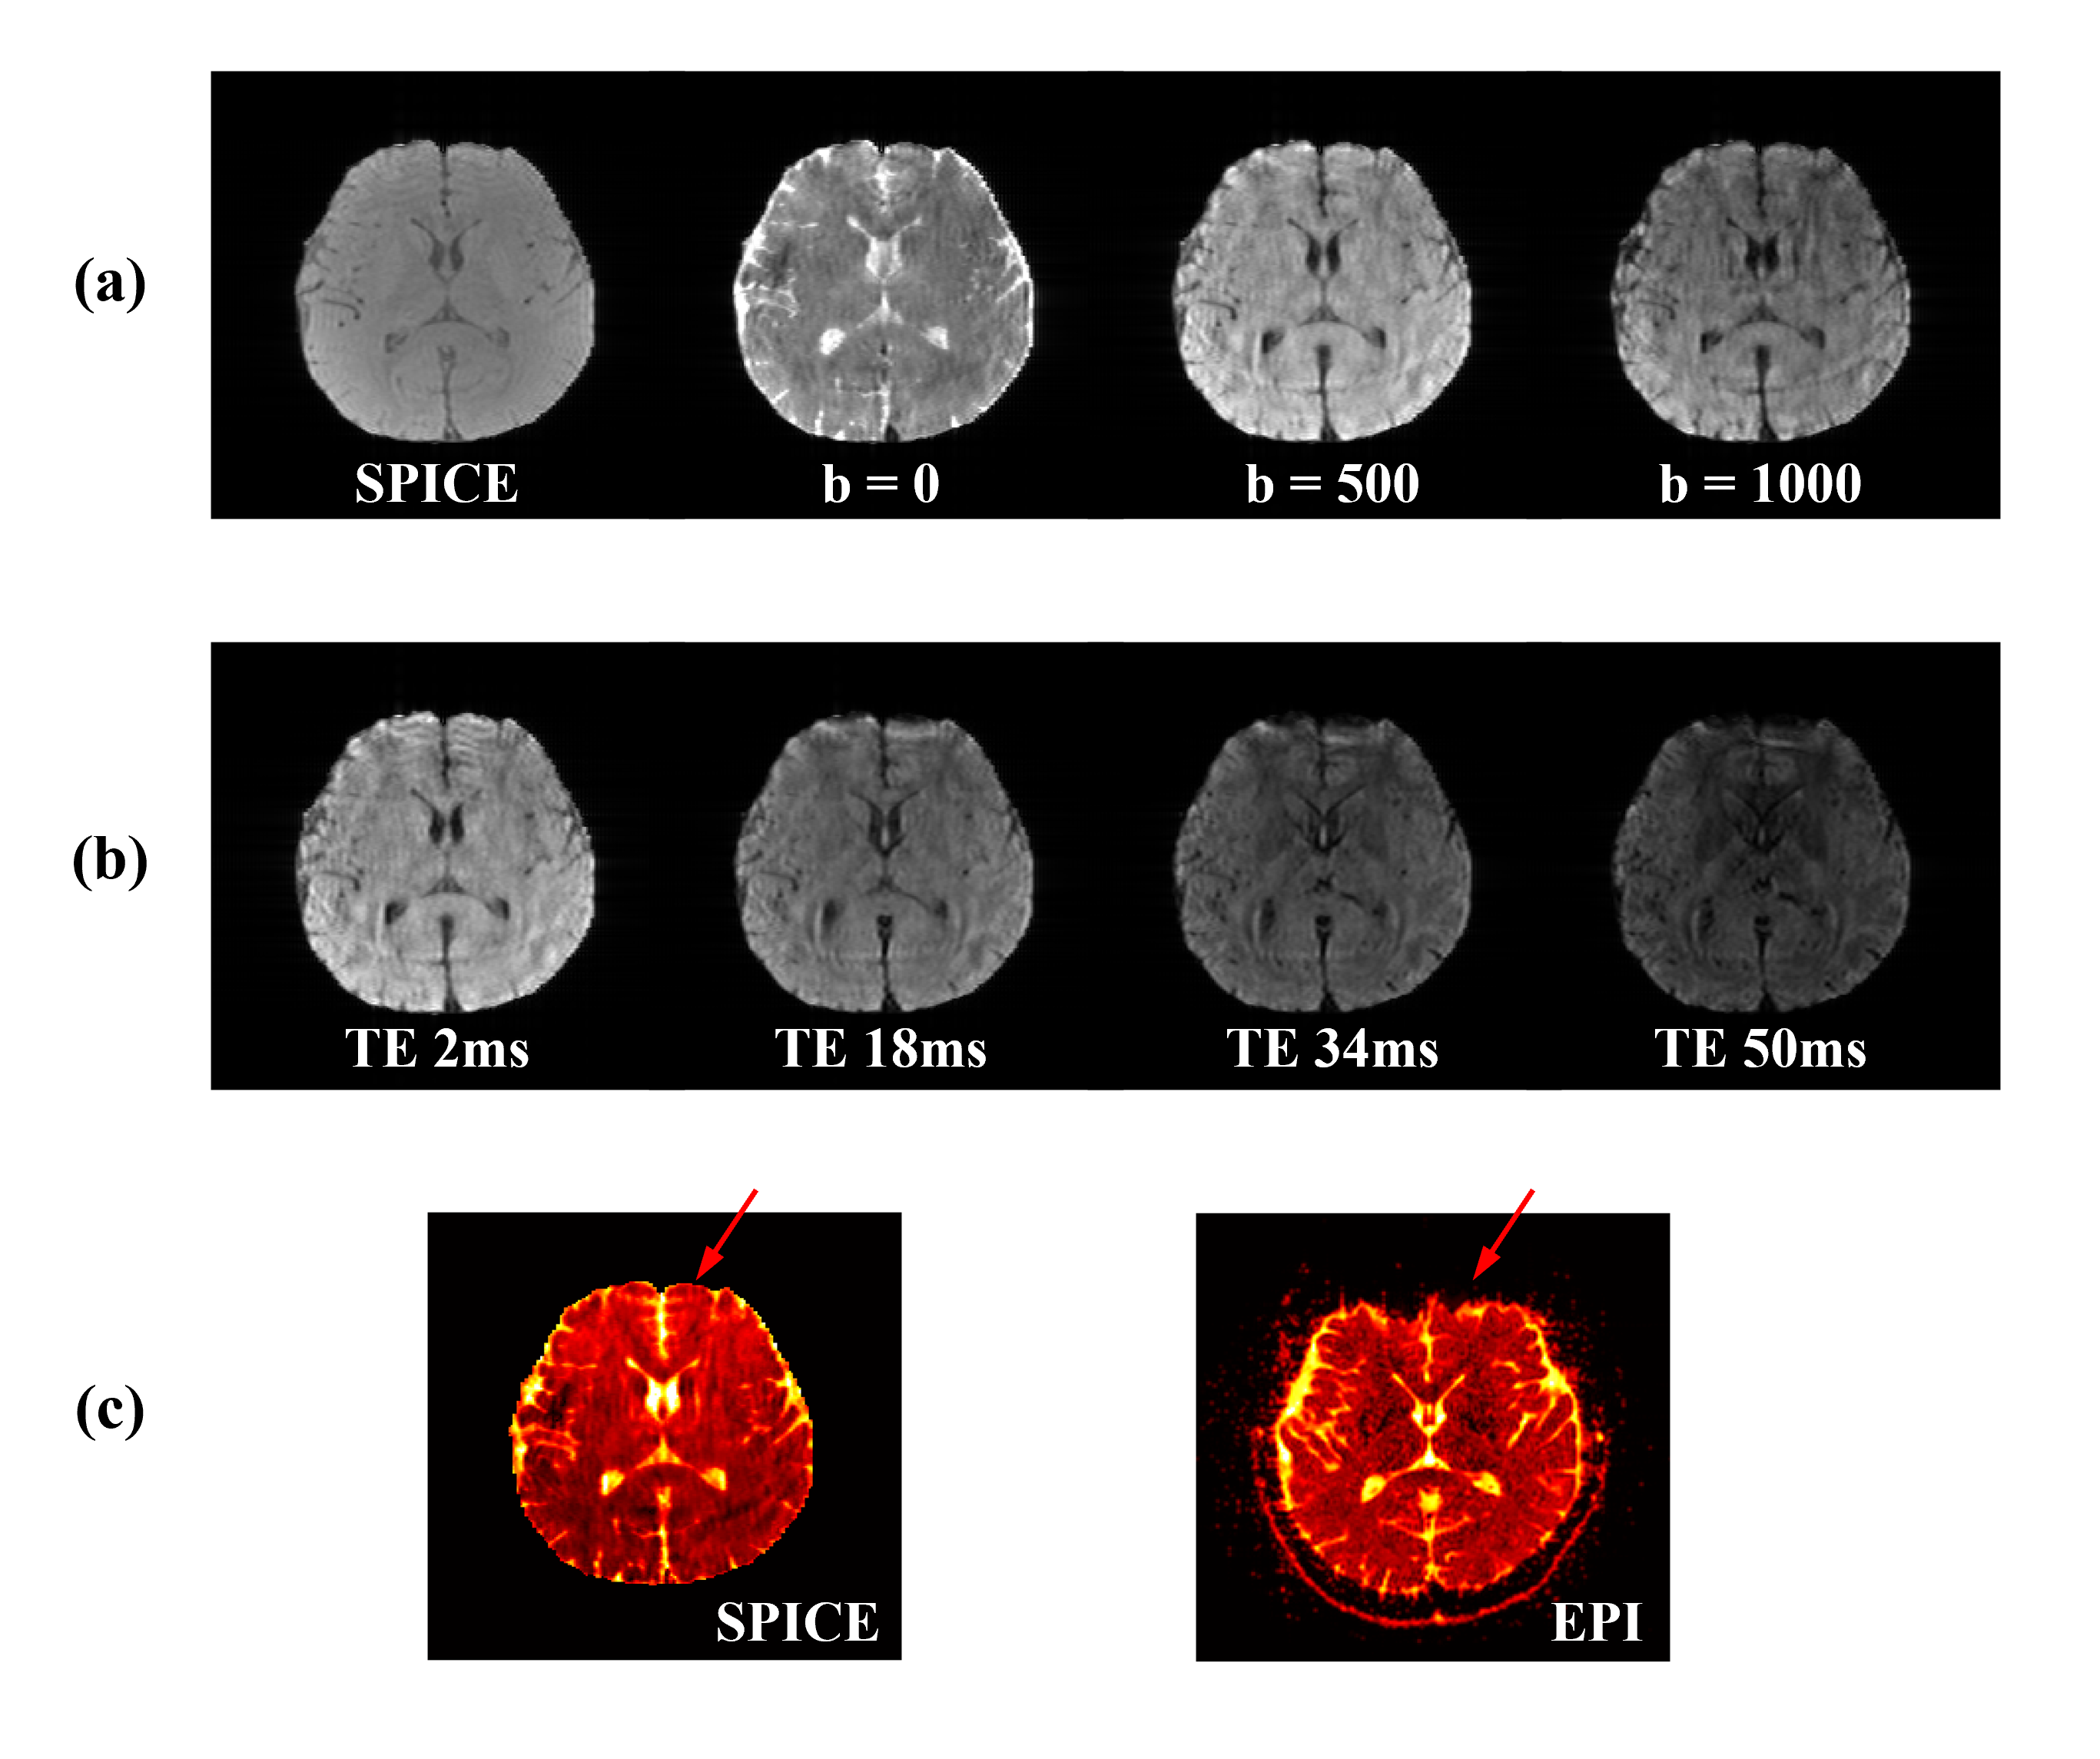
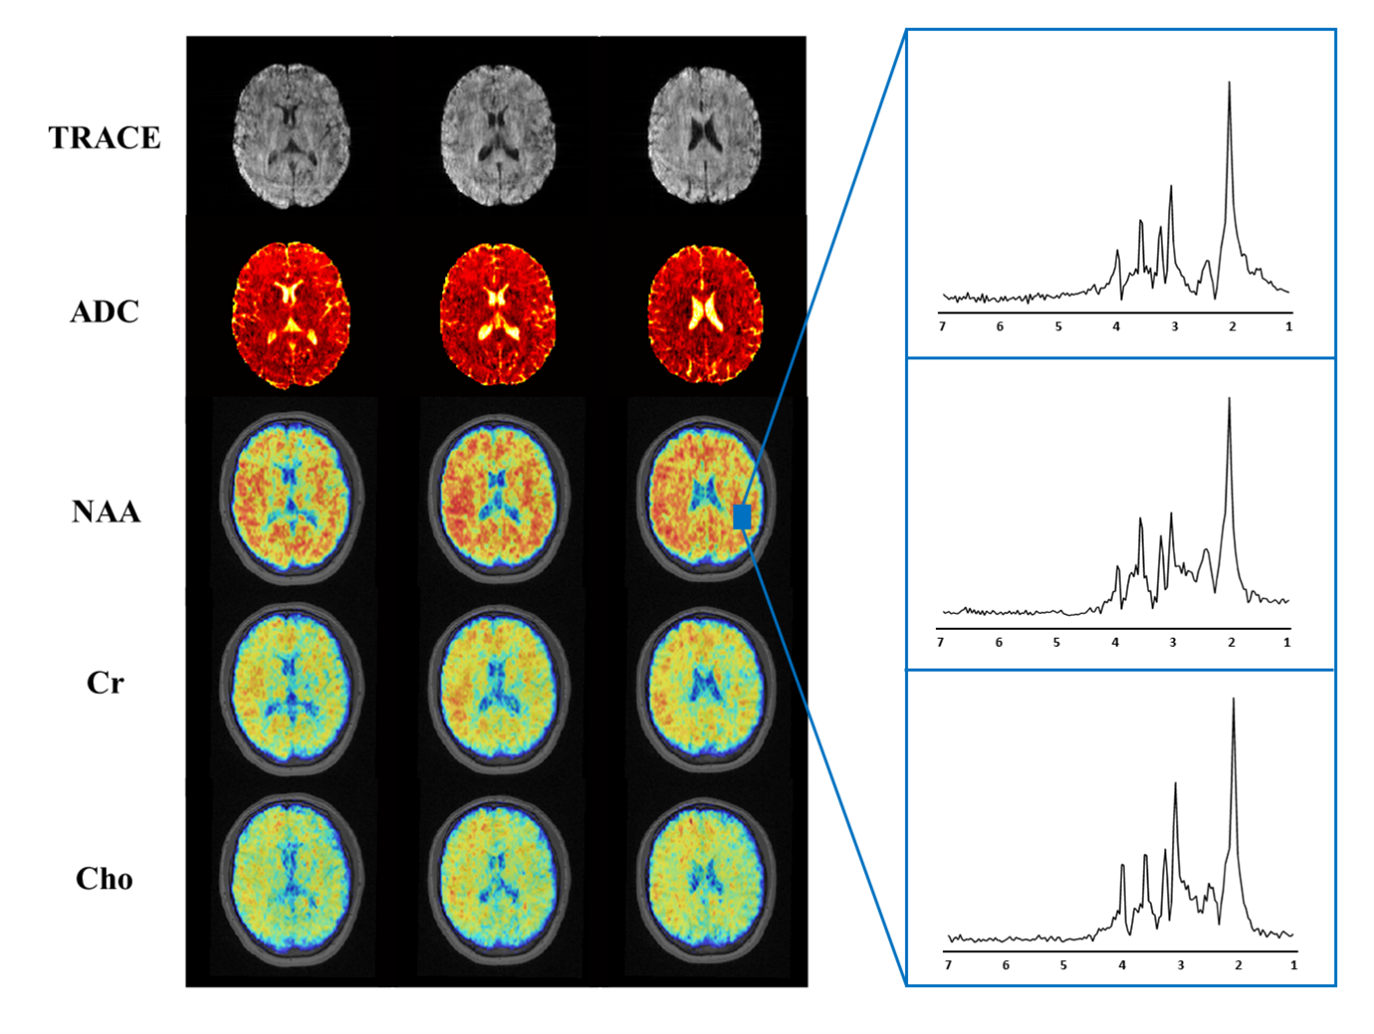
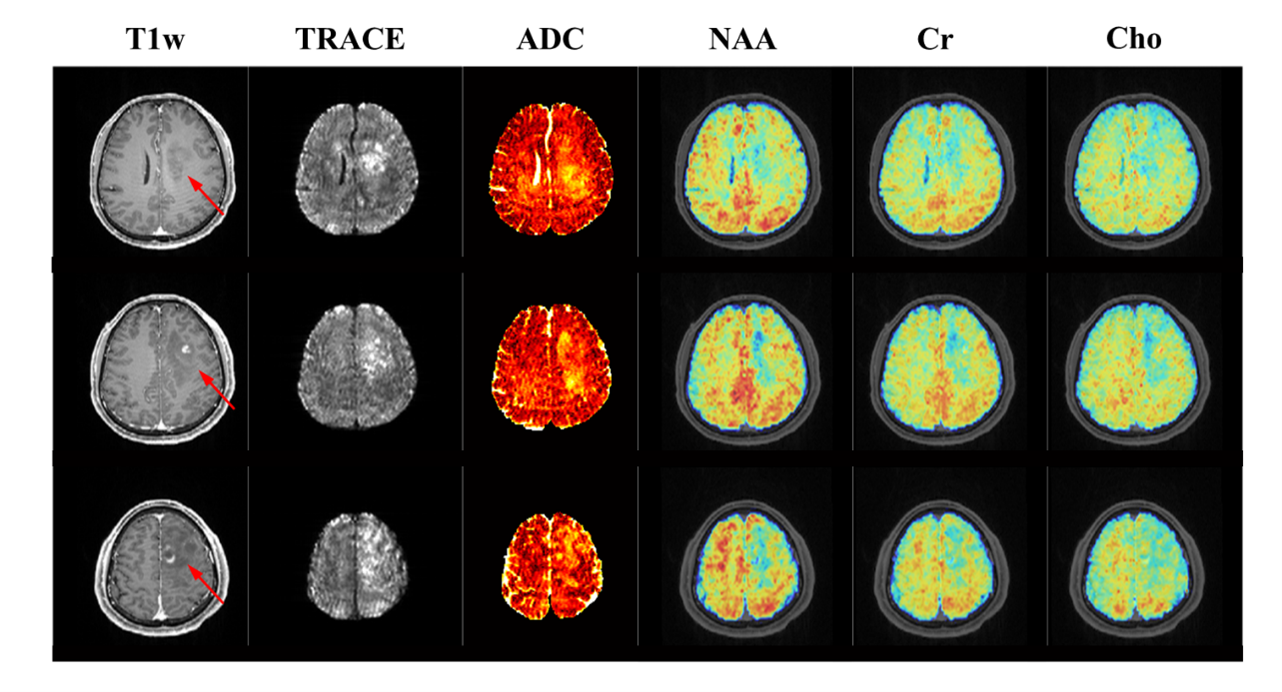
To demonstrate the feasibility and potential of the proposed method, phantom scans were carried out using the NIST/ISMRM diffusion phantom; in vivo experiments were performed on both healthy subjects and tumor patients. Figure 2 shows the water diffusion results obtained from the NIST/ISMRM phantom. Compared with the conventional EPI method, the proposed method showed consistent quantitative ADC values with less geometric distortion. The reconstruction from sparse data (as proposed) also showed good consistency with those from a fully sampled data. Figure 3 shows diffusion images of different b-values, images of different TEs, and ADC maps obtained from a healthy subject. The ADC map also showed consistency with the EPI method but obviously less geometric distortion. Figure 4 shows a complete set of results from the 8-minute scan, including the TRACE image, ADC map and metabolite maps including NAA, Cr and Cho. Another set of results acquired from a tumor patient are shown in Fig. 5. Hyperintensity in the diffusion images, increase of ADC values, and decrease of NAA were observed in the lesion and edema, which were consistent with the literature observations13.Conclusion
This work presents a new method for simultaneous diffusion imaging and metabolic imaging of the brain. Combining diffusion preparation with water-unsuppressed MRSI acquisition, distortion-free diffusion imaging at 1.0×1.0×2.0 mm3 resolution and metabolic imaging at 2.0×3.0×3.0 mm3 nominal resolution were successfully obtained in an 8-min scan.Acknowledgements
No acknowledgement found.References
1. Carhuapoma JR, Wang PY, Beauchamp NJ, et al. Diffusion-weighted MRI and proton MR spectroscopic imaging in the study of secondary neuronal injury after intracerebral hemorrhage. Stroke. 2000;31(3):726-732.
2. Parsons MW, Li T, Barber PA, et al. Combined 1H MR spectroscopy and diffusion-weighted MRI improves the prediction of stroke outcome. Neurology. 2000;55(4):498-505.
3. Rahimifar P, Hashemi H, Malek M, et al. Diagnostic value of 3 T MR spectroscopy, diffusion-weighted MRI, and apparent diffusion coefficient value for distinguishing benign from malignant myometrial tumours. Clin Radiol. 2019;74(7):571.e9-571.e18.
4. Stehling MK, Turner R, Mansfield P. Echo-planar imaging: Magnetic resonance imaging in a fraction of a second. Science. 1991;254(5028):43-50.
5. Brown TR, Kincaid BM, Ugurbil K. NMR chemical shift imaging in three dimensions. Proc Natl Acad Sci U S A. 1982;79(11):3523-3526.
6. Lam F, Liang ZP. A subspace approach to high-resolution spectroscopic imaging. Magn Reson Med. 2014;71(4):1349-1357.
7. Lam F, Ma C, Clifford B, Johnson CL, Liang ZP. High-resolution 1H-MRSI of the brain using SPICE: Data acquisition and image reconstruction. Magn Reson Med. 2016;76(4):1059-1070.
8. Peng X, Lam F, Li Y, Clifford B, Liang ZP. Simultaneous QSM and metabolic imaging of the brain using SPICE. Magn Reson Med. 2018;79(1):13-21.
9. Guo R, Zhao Y, Li Y, Li Y, Liang ZP. Simultaneous metabolic and functional imaging of the brain using SPICE. Magn Reson Med. 2019;82(6):1993-2002.
10. Guo R, Zhao Y, Li Y, et al. Simultaneous QSM and metabolic imaging of the brain using SPICE: Further improvements in data acquisition and processing. Magn Reson Med. 2021;85(2):970-977.
11. Breuer FA, Blaimer M, Mueller MF, et al. Controlled aliasing in volumetric parallel imaging (2D CAIPIRINHA). Magn Reson Med. 2006;55(3):549-556.
12. Liang ZP, Lauterbur PC. A Generalized Series Approach to MR Spectroscopic Imaging. IEEE Trans Med Imaging. 1991;10(2):132-137.
13. Maier SE, Sun Y, Mulkern R V. Diffusion imaging of brain tumors. NMR Biomed. 2010;23(7).
Figures