3543
Quantitative Metabolite Mapping of 12 Metabolites in the Human Brain1MRZ, Max Planck Institute for Biological Cybernetics, Tübingen, Germany, 2IMPRS for Cognitive and Systems Neuroscience, Eberhard-Karls University of Tübingen, Tübingen, Germany, 3Advanced Imaging Research Center, University of Texas Southwestern Medical Center, Dallas, TX, United States
Synopsis
Very short TR (TR < 300) MRSI is a popular method that enables fast acquisition of spectroscopic imaging data; however, raw metabolite signals following short TR acquisitions are influenced by strong T1-weighting. In order to gather more accurate images and to be able to relate MRSI results to SVS studies, it is valuable to correct for T1-weighting and to quantify MRSI images. This study presents results that utilize a voxel-specific, T1-correction method which is an advancement from more traditional methods that utilized average T1-corrections for metabolites. Fully sampled, single-slice 1H MRSI metabolite maps are presented for 12 metabolites.
Introduction
Proton MRSI adds valuable diagnostic information to understanding pathologies such as multiple sclerosis1, tumors2, epilepsy3 and neurodegenerative diseases4,5 due to detectable variations of the neurochemical profile. High-resolution 1H-FID MRSI of the human brain has been showcased previously at 3T6, 7T7, and 9.4T8, and displayed promise in imaging a more comprehensive neurochemical profile compared to results relying on longer TE methods and/or lower field strengths9.However, acquiring high-resolution 1H FID MRSI data with sufficient coverage of the brain in a time efficient manner requires a very short TR of < 300ms which leads to substantial T1-weighting of metabolites7,8 and macromolecules10 (MMs). Correcting for relaxation effects and using the internal water reference to quantify 1H MRSI data was originally shown by Gasparovic et al.11 However, that work relied on an average T1-relaxation time for each metabolite, and this ultimately can lead to the misinterpretation of tissue contrast in metabolite maps. The T1-relaxation times of metabolites have shown to vary depending on the tissue contrast12,13, and in this work we highlight the use of tissue-type specific T1-corrections to arrive at quantitative metabolite maps for 12 metabolites in the human brain at 9.4 T.
Methods
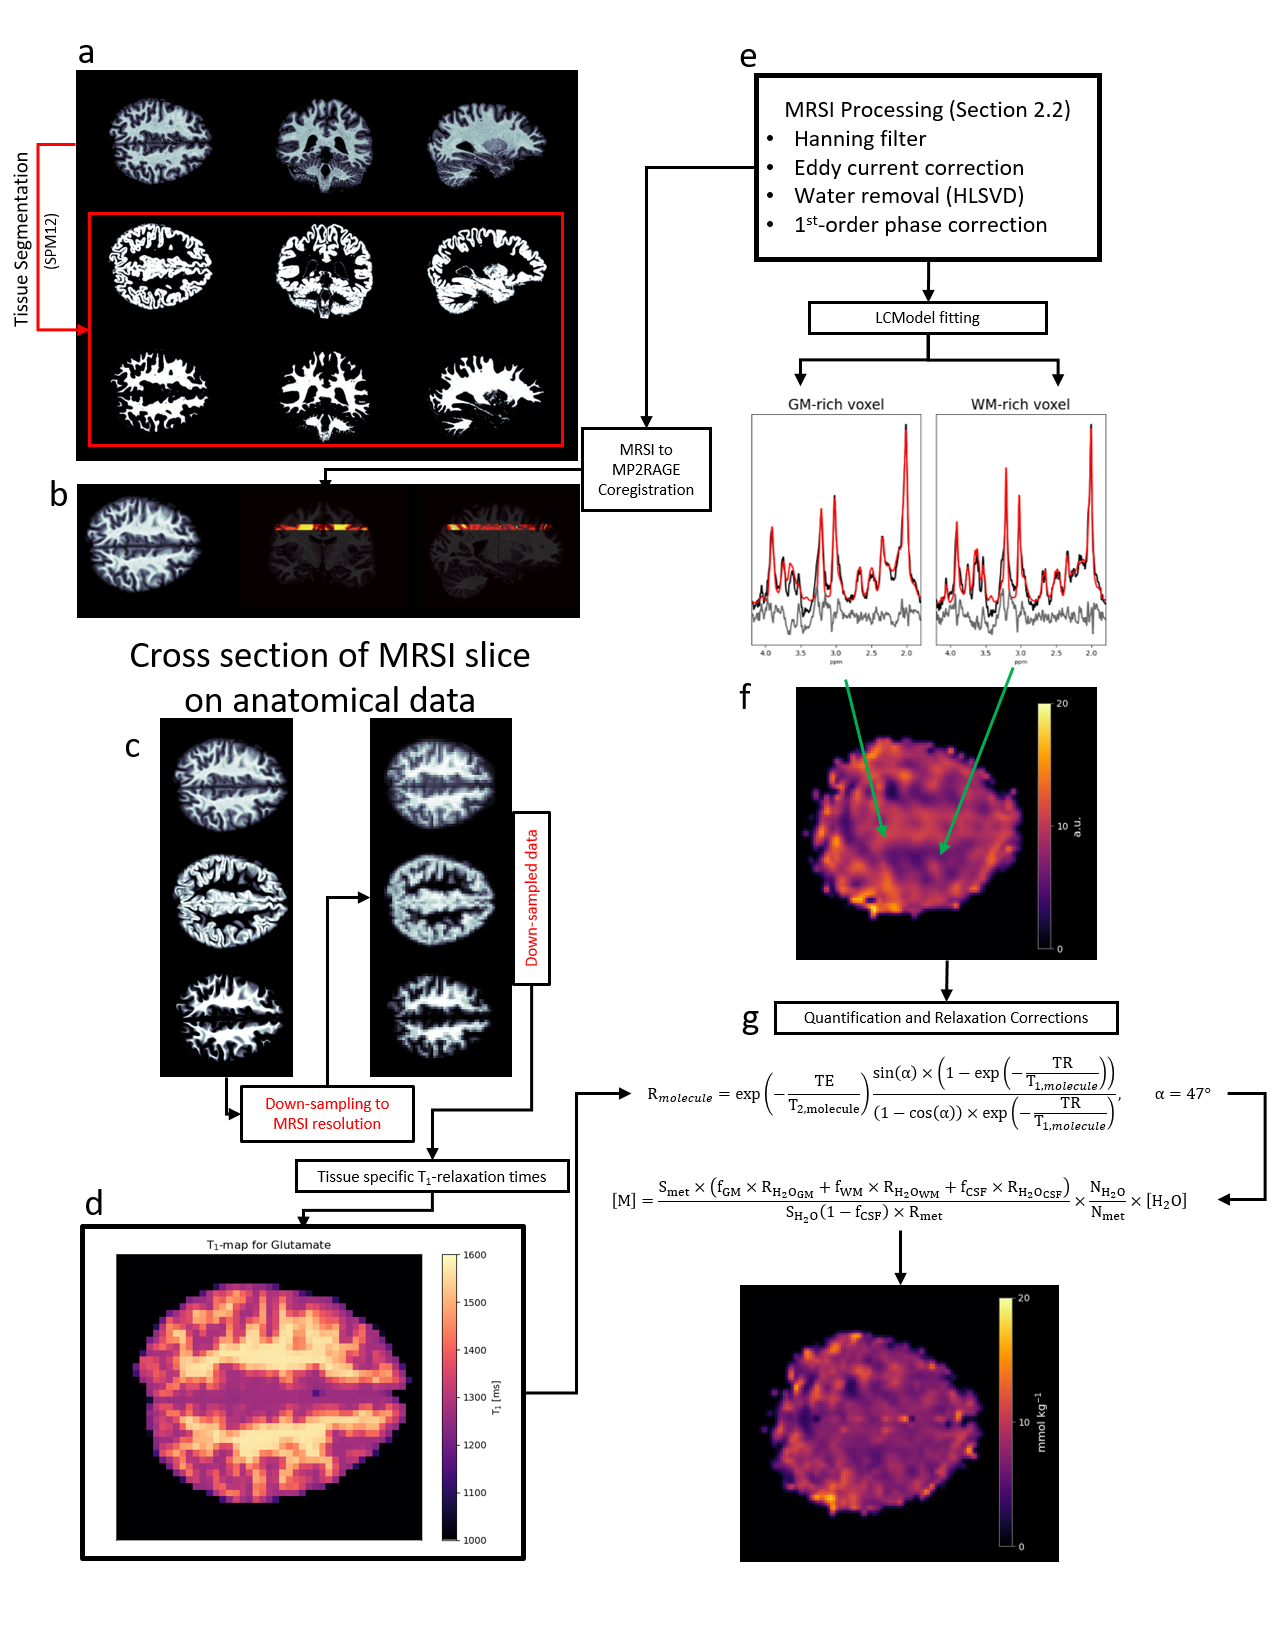
Eight healthy volunteers (29 ± 2 years, 4 women, 4 men) participated in this study with IRB approval and signed consent. An 18/32 Tx/Rx coil14 was utilized to acquire high-resolution 1H-FID-MRSI (TE* = 1.5ms, TR = 300ms) with a matrix size of 64x64 (nominal voxel size: 3.44x3.44x8mm3), flip angle of 47°, BW of 4000Hz, and 512 data points acquired. Water references with identical sequence parameters were acquired to account for bias fields caused by the receive coil and to correct for coil loading between volunteers. All MRSI data were acquired from a slice positioned directly above the corpus callosum for each volunteer.LCModel15 was used to fit metabolite spectra and utilized a simulated MM spectrum (MMAXIOM)13,16 to account for the T1-weighted MM spectrum underlying metabolites. Quantitative 1H MRSI metabolite maps were reconstructed and derived as described in Figure 1. Tissue probability maps were calculated from MP2RAGE images using SPM12, and were coregistered to 1H MRSI with an in-house developed tool to estimate the tissue fraction within each voxel. Voxels with more than 30% CSF contributions were excluded from analysis; as well as voxels where CRLB values indicated poor fitting performance (thresholds discussed in Results).
Results
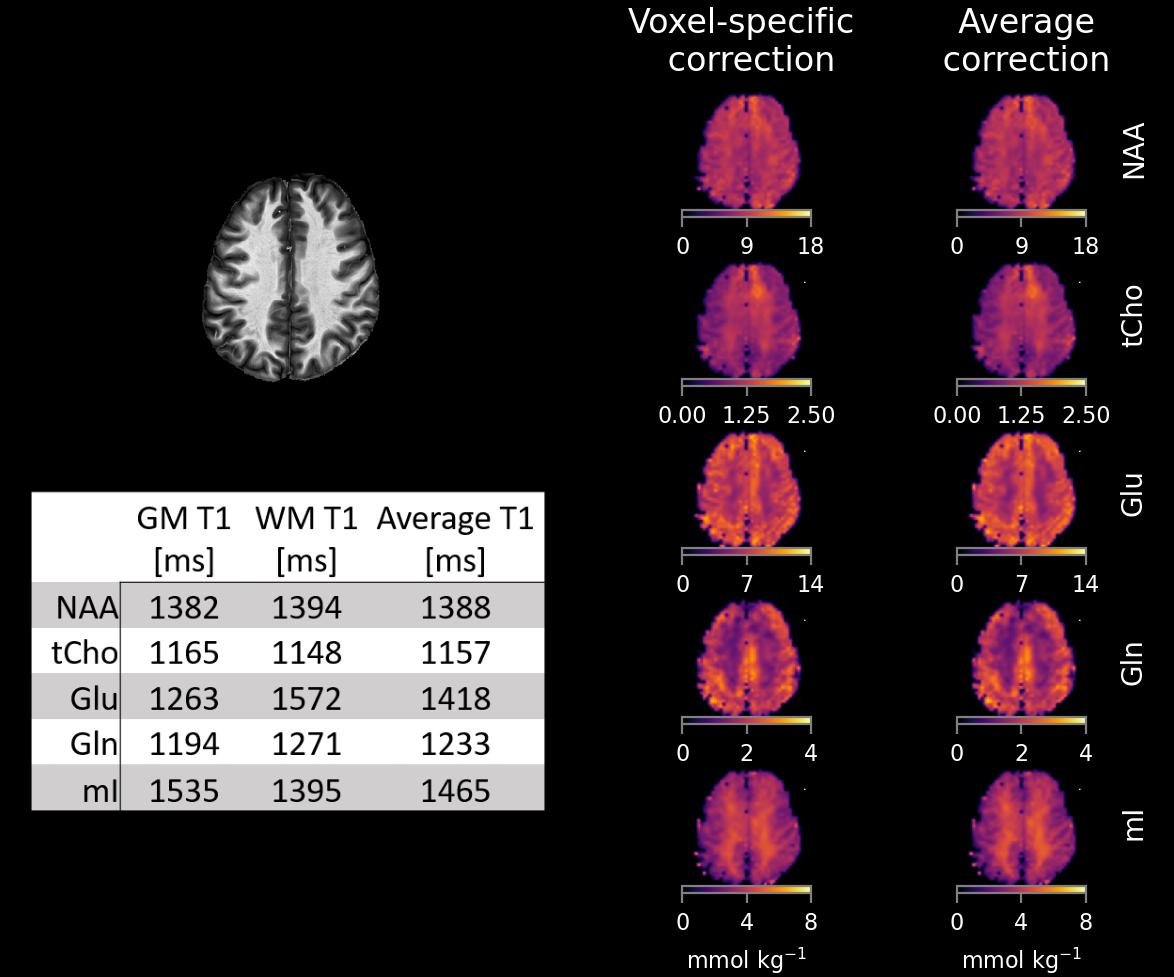
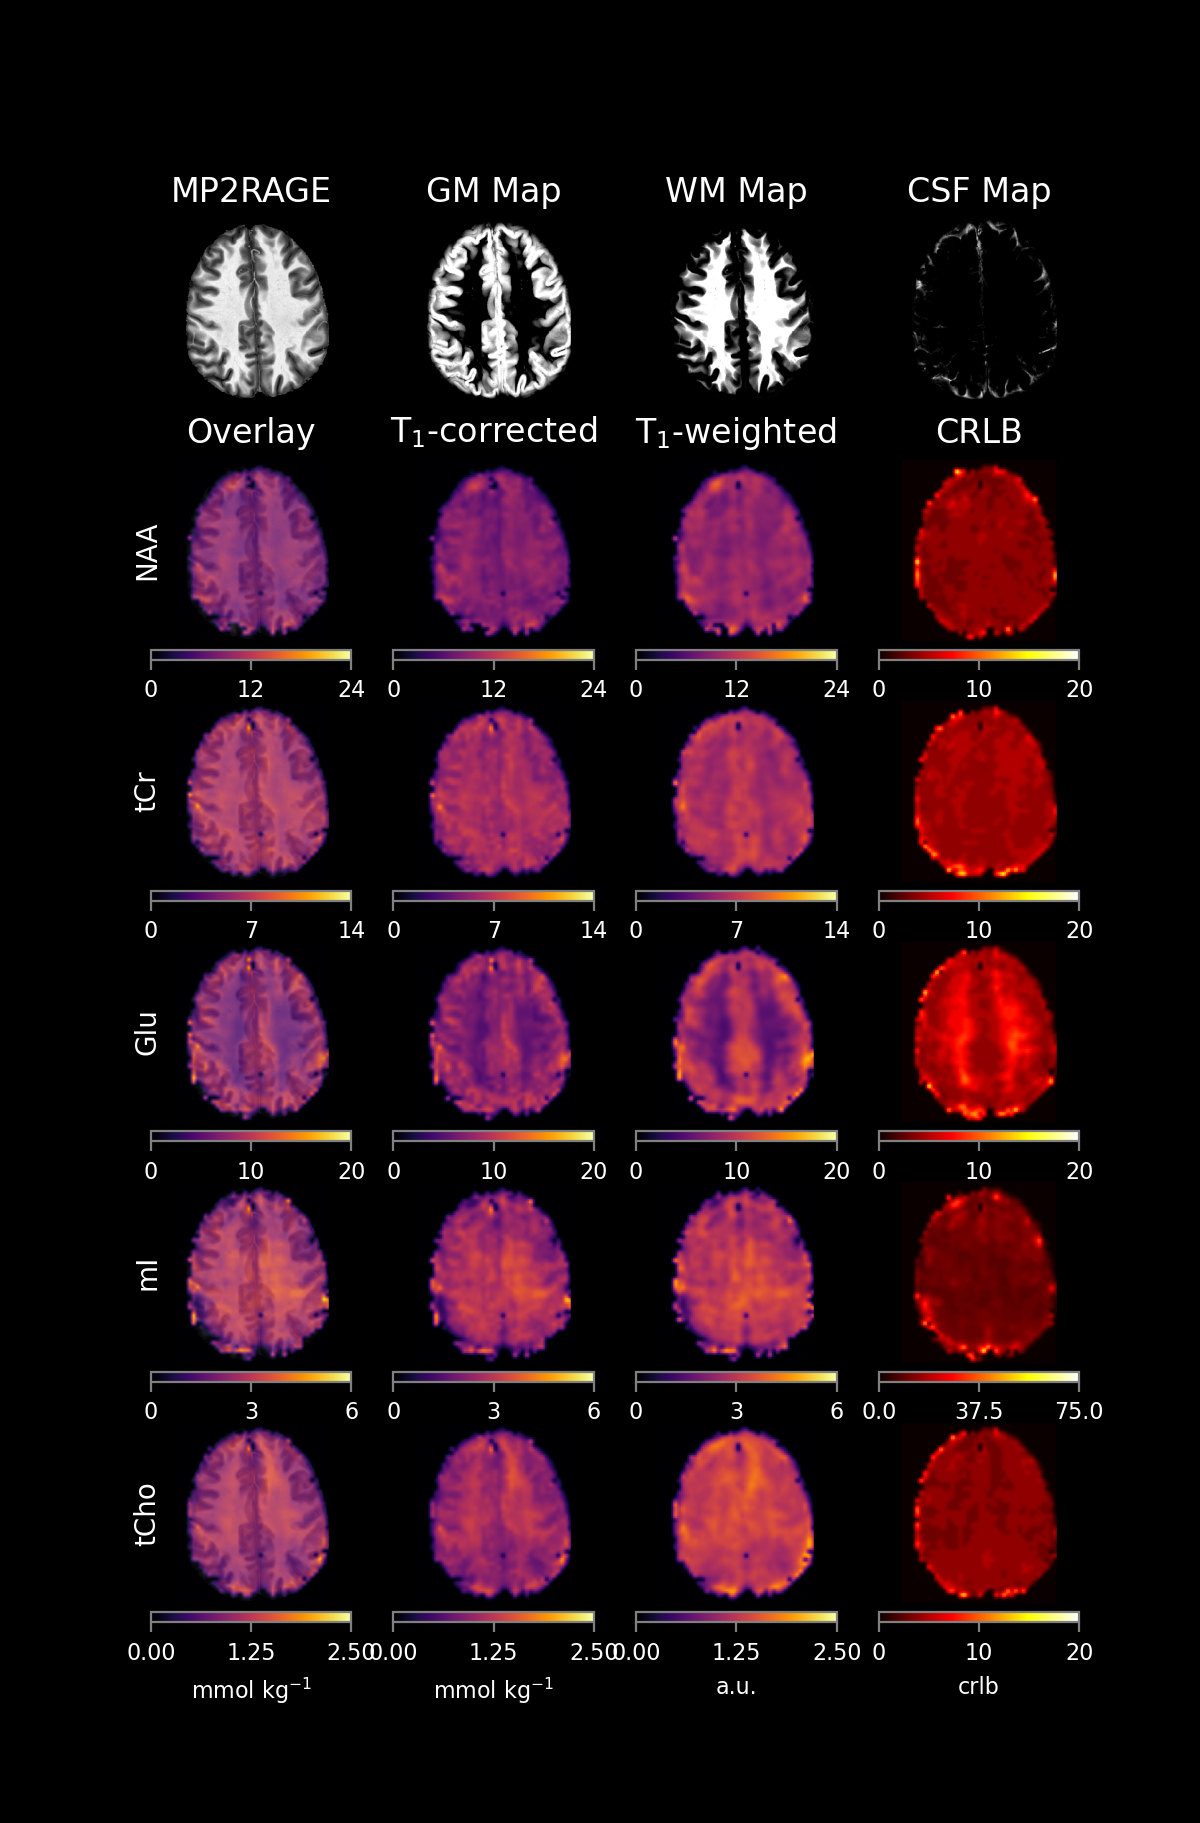
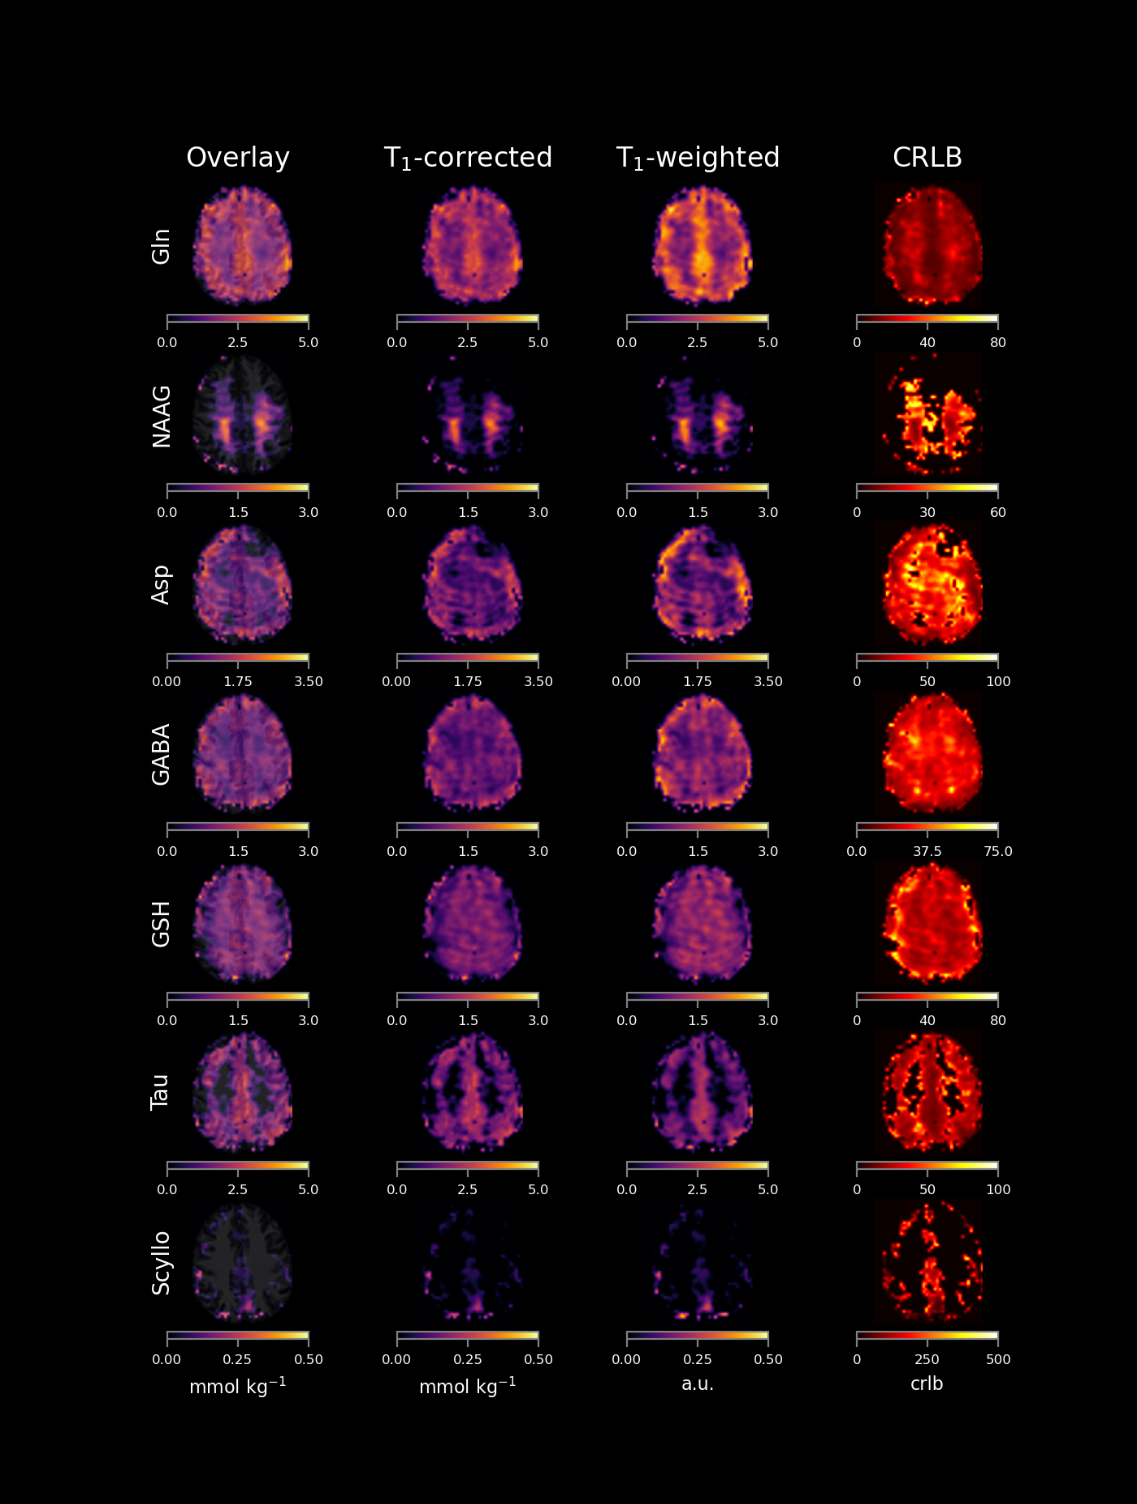
Figure 2 highlights the differences of quantitative metabolite maps when using voxel specific (left) or average (right) T1-relaxation times. The contrast of metabolite maps are affected more by metabolites that have non-similar T1-relaxation times for GM and WM, and thus, a contrast shift is present in Glu and mI.Figure 3 and Figure 4 show quantitative metabolite maps in mmol/kg for a representative volunteer. From left to right, data is presented showing: metabolite maps overlaying the anatomical image; voxel-specific, T1-corrected metabolite maps; T1-weighted metabolite maps; and CRLB maps. It is apparent that voxel-specific, T1-corrections leads to finer structural detail in metabolite maps compared to data without T1-corrections.
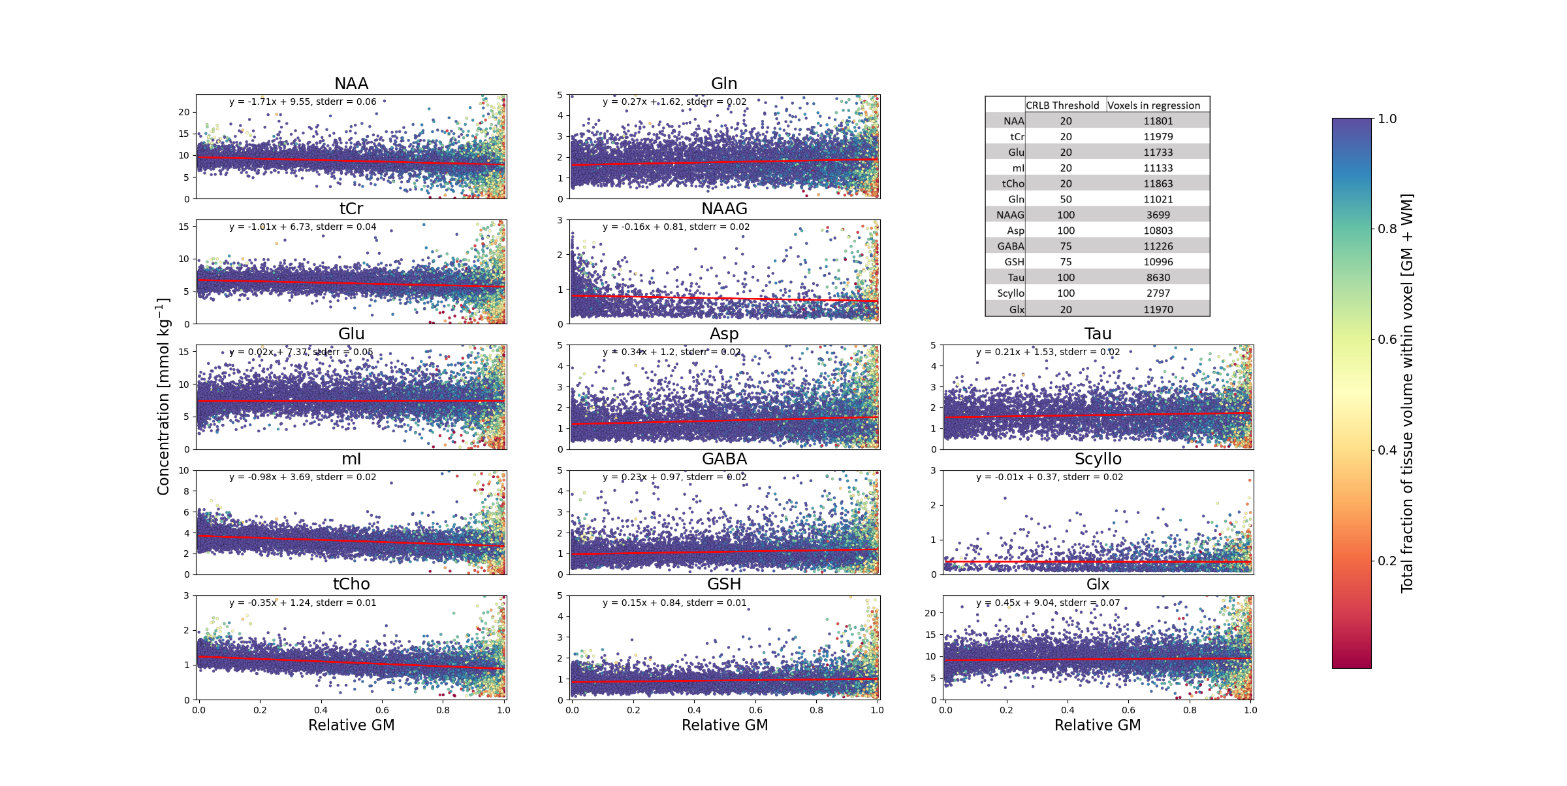
Linear regressions assessing quantification results (pooling all volunteers) as a function of relative GM fraction (GM / (GM+WM)) are shown in Figure 5. The color bar shows the total tissue fraction (GM + WM) within each voxel. Figure 5 also includes a table reporting the CRLB threshold for each metabolite as well as the total number of voxels present in each regression.
Discussion
Based on the investigation of voxel-specific and average T1-relaxation time corrections (Figure 2), it would be beneficial for works that have utilized methods that result in T1-weighting to account for the tissue specific relaxation times of metabolites. This reduces the risk of fallacious assignment of concentration differences that are actually attributable to T1-relaxation time differences.Utilizing corrections based on average T1-relaxation times does improve interpretation of data by already reducing the strong GM/WM contrast observed in Glu and mI metabolite maps. However, using voxel-specific T1-corrections further improves the overall accuracy of metabolites maps; especially for metabolites that have big differences between GM and WM T1-relaxation times.
While Glu does not exhibit strong tissue contrast following voxel-specific T1-relaxation corrections, Gln does still maintain a strong contrast and appears to be primarily located in GM-rich regions. Tau also appears to be located almost exclusively in GM-rich voxels, and Scyllo may also be primarily found in GM-rich regions. Metabolites that are in higher concentration in WM-rich regions include tCho, mI, and NAAG. Based on regressions (Figure 5), NAA and tCr may have higher concentrations in WM; however, further investigation is needed to investigate moiety relaxation effects.
Future work would benefit by investigating metabolite distributions across the full brain at UHF strengths and applying voxel-specific T1-corrections. Another factor that impacts the accuracy of metabolite concentration in T1-weighted 1H MRSI are the differences between T1-relaxation times of metabolite moieties (i.e. NAA-CH3 vs NAA-CH2), and accounting for these differences would ultimately improve quantitative metabolite mapping accuracy.
Conclusion
This work presents quantitative metabolite maps of 12 human brain metabolites and investigates their GM versus WM concentrations. Quantitative metabolite maps with voxel-specific T1-corrections show improved anatomical characteristics (i.e. GM folding) a corrected interpretation of GM/WM tissue contrast.Acknowledgements
This project was co-sponsored by the ERC Starting Grant / SYNAPLAST / 679927 and the Cancer Prevention and Research Institute of Texas (CPRIT) Grant / RR180056References
1. Jain S, Sima DM, Sanaei Nezhad F, et al. Patch-Based Super-Resolution of MR Spectroscopic Images: Application to Multiple Sclerosis. Front Neurosci. 2017;11(January):1-12. doi:10.3389/fnins.2017.00013
2. Li Y, Larson P, Chen AP, et al. Short-echo three-dimensional H-1 MR spectroscopic imaging of patients with glioma at 7 tesla for characterization of differences in metabolite levels. J Magn Reson Imaging. 2015;41(5):1332-1341. doi:10.1002/jmri.24672
3. Gilliam FG, Maton BM, Martin RC, et al. Hippocampal 1H-MRSI correlates with severity of depression symptoms in temporal lobe epilepsy. Neurology. 2007;68(5):364-368. doi:10.1212/01.wnl.0000252813.86812.81
4. Schreiner SJ, Kirchner T, Wyss M, et al. Low episodic memory performance in cognitively normal elderly subjects is associated with increased posterior cingulate gray matter N-acetylaspartate: a 1H MRSI study at 7 Tesla. Neurobiol Aging. 2016;48:195-203. doi:10.1016/J.NEUROBIOLAGING.2016.08.022
5. Schreiner SJ, Kirchner T, Narkhede A, et al. Brain amyloid burden and cerebrovascular disease are synergistically associated with neurometabolism in cognitively unimpaired older adults. Neurobiol Aging. 2018;63:152-161. doi:10.1016/J.NEUROBIOLAGING.2017.12.004
6. Maudsley AA, Domenig C, Govind V, et al. Mapping of brain metabolite distributions by volumetric proton MR spectroscopic imaging (MRSI). Magn Reson Med. 2009;61(3):548-559. doi:10.1002/mrm.21875
7. Bogner W, Gruber S, Trattnig S, Chmelik M. High-resolution mapping of human brain metabolites by free induction decay 1 H MRSI at 7 T. 2012;(May 2011):873-882. doi:10.1002/nbm.1805
8. Nassirpour S, Chang P, Henning A. High and ultra-high resolution metabolite mapping of the human brain using 1H FID MRSI at 9.4T. Neuroimage. 2016;(July):1-11. doi:10.1016/j.neuroimage.2016.12.065
9. Motyka S, Moser P, Hingerl L, et al. The influence of spatial resolution on the spectral quality and quantification accuracy of whole-brain MRSI at 1.5T, 3T, 7T, and 9.4T. Magn Reson Med. 2019;82(2):551-565. doi:10.1002/mrm.27746
10. Murali‐Manohar S, Wright AM, Borbath T, Avdievich NI, Henning A. A novel method to measure T 1 ‐relaxation times of macromolecules and quantification of the macromolecular resonances. Magn Reson Med. August 2020:mrm.28484. doi:10.1002/mrm.28484
11. Gasparovic C, Song T, Devier D, et al. Use of tissue water as a concentration reference for proton spectroscopic imaging. Magn Reson Med. 2006;55(6):1219-1226. doi:10.1002/mrm.20901
12. Ethofer T, Mader I, Seeger U, et al. Comparison of longitudinal metabolite relaxation times in different regions of the human brain at 1.5 and 3 Tesla. Magn Reson Med. 2003;50(6):1296-1301. doi:10.1002/mrm.10640
13. Wright AM, Murali-Manohar S, Borbath T, Avdievich NI, Henning A. Relaxation-corrected macromolecular model enables determination of 1H longitudinal T1-relaxation times and concentrations of human brain metabolites at 9.4T. Magn Reson Med. 2021;00:1-17. doi:10.1002/mrm.28958
14. Avdievich NI, Giapitzakis I-A, Bause J, Shajan G, Scheffler K, Henning A. Double-row 18-loop transceive-32-loop receive tight-fit array provides for whole-brain coverage, high transmit performance, and SNR improvement near the brain center at 9.4T. Magn Reson Med. 2019;81(5):3392-3405. doi:10.1002/mrm.27602
15. Provencher SW. Automatic quantitation of localizedin vivo1H spectra with LCModel. NMR Biomed. 2001;14(4):260-264. doi:10.1002/nbm.698
16. Wright AM, Murali Manohar S, Ziegs T, Henning A. Relaxation corrected simulated MM model for improved fitting and quantification of 1H FID MRSI data. In: 2021 ISMRM & SMRT Annual Meeting & Exhibition (ISMRM 2021). ; 2021.
Figures