3542
Changes in lung microstructure during the cardiac cycle assessed by rapid hyperpolarized 129Xe chemical shift saturation recovery1Institute of Diagnostic and Interventional Radiology, Hannover Medical School, Hannover, Germany, 2Biomedical Research in Endstage and Obstructive Lung Disease Hannover (BREATH), German Center for Lung Research (DZL), Hannover, Germany, 3Department of Clinical Airway Research, Fraunhofer Institute for Toxicology and Experimental Medicine, Hannover, Germany, 4Department of Respiratory Medicine, Hannover Medical School, Hannover, Germany
Synopsis
A rapid chemical shift saturation recovery (CSSR) pulse sequence is developed for reconstructing CSSR uptake curves in different cardiac phases by employing retrospective gating. The sequence is tested in a study with 6 healthy volunteers and compared to conventional CSSR. A significant difference in septal wall thickness between trough and crest of the pulse wave in lung tissue is found. Results from rapid and conventional CSSR are strongly correlated and show good absolute agreement. The proposed rapid CSSR pulse sequence may provide valuable new insights into normal lung function, improve precision of CSSR results and may have clinical applications.
Introduction
The lung is highly complex and many physiological aspects of lung function and structure are still to be elucidated. Microscopy is typically used for lung morphometry and stereologic analysis is established to obtain unbiased morphometric estimates. However, microscopic methods require fixation of tissue not accurately conserving the in-vivo state.1CSSR spectroscopy combined with the gas uptake model by Patz et al.2 is an experimental tool for non-invasive assessment of alveolar septal thickness, surface-to-volume ratio and capillary transit time. Influence of cardiac function on CSSR results has been acknowledged3 but is not well investigated. Results from microscopy indicate an influence of vascular pressure on pulmonary capillay diameters and consequently septal thickness but provide limited information on the in-vivo situation.4
Purpose of this study was to develop a Look–Locker-based rapid CSSR pulse sequence allowing measurement of uptake curves in different cardiac phases, to investigate the influence of cardiac function on CSSR in a study with healthy volunteers and to compare the results with conventional CSSR.
Methods
A rapid CSSR sequence based on the Look–Locker approach5,6 as well as a conventional CSSR sequence² were implemented as shown in Figure 1. The study was approved by the institutional review board and all subjects provided written informed consent. 6 healthy volunteers underwent hyperpolarized 129Xe MRI with both sequences and lung function testing.Measurements were performed at 1.5T (Avanto, Siemens) using a circularly polarized birdcage coil (Rapid Biomedical). 129Xe (500ml/600ml for conventional/rapid CSSR) was hyperpolarized (Polarean 9810), and diluted with nitrogen to 1L. Subjects inhaled the gas starting from functional residual capacity and held their breath. Fingertip plethysmograms were recorded and gating signals stored in rapid CSSR raw data.
In rapid CSSR data analysis, the first and last three data points were discarded and remaining data Fourier-transformed, resulting in an effective TE of 136.4µs where gas and dissolved-phase have a phase difference of π. After zeroth order phasing, the ratio of dissolved and gas-phase 129Xe was obtained as ratio of integrated real parts multiplied by –1.
To avoid potential delays in plethysmographic gating, spectra were interpolated to coarsely resolve the two dissolved-phase resonances and piecewise sine functions fit to filtered ratio data using information from plethysmography for starting values. Each rapid CSSR readout was assigned to the two phases crest and trough assuming a width of 40% (symmetric) for crest and 60% for trough. The model by Patz et al. was fit to the individual uptake curves and resulting parameters were compared by signed-rank tests. Further, results for crest and trough were averaged and compared to conventional CSSR results using Pearson‘s correlation and Bland–Altman plots. In an additional analysis, data were analyzed in a sliding window of width 40% with a variable phase ranging from 0 to 7π/4 subtracted from the sine phase from piecewise fits.
Results
Table 1 summarizes participant demographics and results from lung function testing. Figure 2 shows an exemplary spectrum, spectral ratios for gating, reconstructed uptake curves and fitting results. There was a significant increase of septal wall thickness during the crest of the pulse wave compared to trough, p = 0.031.Correlation and Bland–Altman plots are shown in Figure 3. A very strong and significant correlation is observed between the averaged rapid CSSR and conventional CSSR results for septal wall thickness. The correlations in the cases of capillary transit time and surface-to-volume ratio are somewhat weaker. Surface-to-volume ratio is reduced in rapid CSSR.
Figure 4 shows results from sliding-window reconstruction with varying phase in individual participants and averaged over the study group. Despite the non-significant difference of capillary transit time in the analysis with fixed delay, strong relative changes are apparent.
Discussion
We have developed a rapid CSSR pulse sequence to elucidate influences of blood flow and cardiac function on results from CSSR. We found a significant difference of septal wall thickness between trough and crest of the blood pulse wave going through the lung with a relative mean difference in the percent range. While this is consistent with diameter changes of pulmonary capillaries with varying blood pressure,4 the authors are not aware of a previous literature report of changes in septal thickness throughout the cardiac cycle. Previous studies found a periodic change in pulmonary capillary blood flow rate during the cardiac cycle7. The fact that we found no evidence for changes in capillary transit time could be similarly due to changes in capillary diameter or due to the limited number of subjects. The strong correlations of rapid and conventional CSSR results and good absolute agreement suggest that the 1° hard excitations only introduce small bias. Future studies for a more detailed picture of microstructural changes, e.g. through MOXE analysis,8 would require sacrificing temporal resolution in order to cleanly separate the dissolved-phase resonances. A potential clinical application could be discrimination of different cardiopulmonary diseases.9 The method may also have improved precision due to control of the cardiac influence.Conclusion
Rapid CSSR may provide novel insights into physiological processes not well established in the literature. Septal wall thickness as obtained from rapid CSSR is influenced by the cardiac cycle. The precision of CSSR measurements could potentially be improved by controlling the cardiac phase during the acquisition.Acknowledgements
This work was funded by the German Center for Lung Research (DZL).References
1. Hsia, C. C., Hyde, D. M., Ochs, M. & Weibel, E. R. American Thoracic Society Documents An Official Research Policy Statement of the American Thoracic Society / European Respiratory Society : Standards for Quantitative Assessment of Lung Structure. Am J Respir Crit Care Med 181, 394–418 (2010).2. Patz, S. et al. Diffusion of hyperpolarized 129 Xe in the lung: a simplified model of 129 Xe septal uptake and experimental results. New J. Phys. 13, 015009 (2011).
3. Ruppert, K. et al. Detecting pulmonary capillary blood pulsations using hyperpolarized xenon-129 chemical shift saturation recovery (CSSR) MR spectroscopy. Magn. Reson. Med. 75, 1771–1780 (2016).
4. Watson, R. R., Fu, Z. & West, J. B. Minimal distensibility of pulmonary capillaries in avian lungs compared with mammalian lungs. Respir. Physiol. Neurobiol. 160, 208–214 (2008).
5. Kern, A. L. et al. Mapping of regional lung microstructural parameters using hyperpolarized 129Xe dissolved-phase MRI in healthy volunteers and patients with chronic obstructive pulmonary disease. Magn. Reson. Med. 81, (2019).
6. Ruppert, K. et al. Investigating biases in the measurement of apparent alveolar septal wall thickness with hyperpolarized 129Xe MRI. Magn. Reson. Med. 84, 3027–3039 (2020).
7. Lee, G. de J. & DuBois, A. B. Pulmonary Capillaray Blood Flow In Man. J. Clin. Invest. 34, 1380–1390 (1955).
8. Chang, Y. V. MOXE: A model of gas exchange for hyperpolarized 129 Xe magnetic resonance of the lung. Magn. Reson. Med. 69, 884–890 (2013).
9. Wang, Z. et al. Diverse Cardiopulmonary Diseases are Associated with Distinct Xenon MRI Signatures. Eur Respir J in press (2019).
Figures
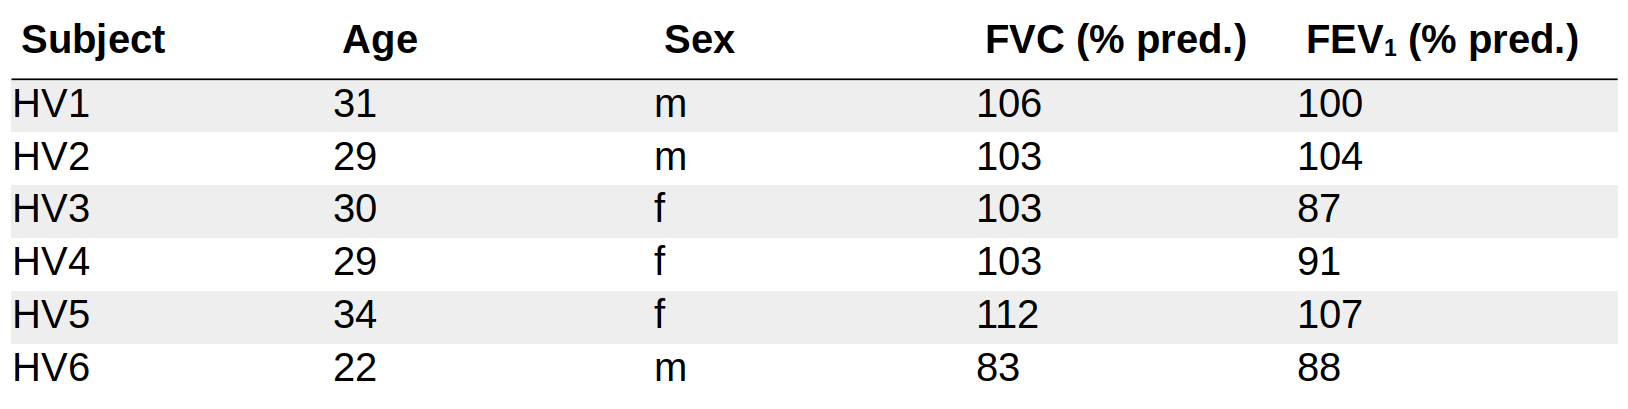
Table 1. Participant demographics and results from lung function tests. All participants had normal lung function.
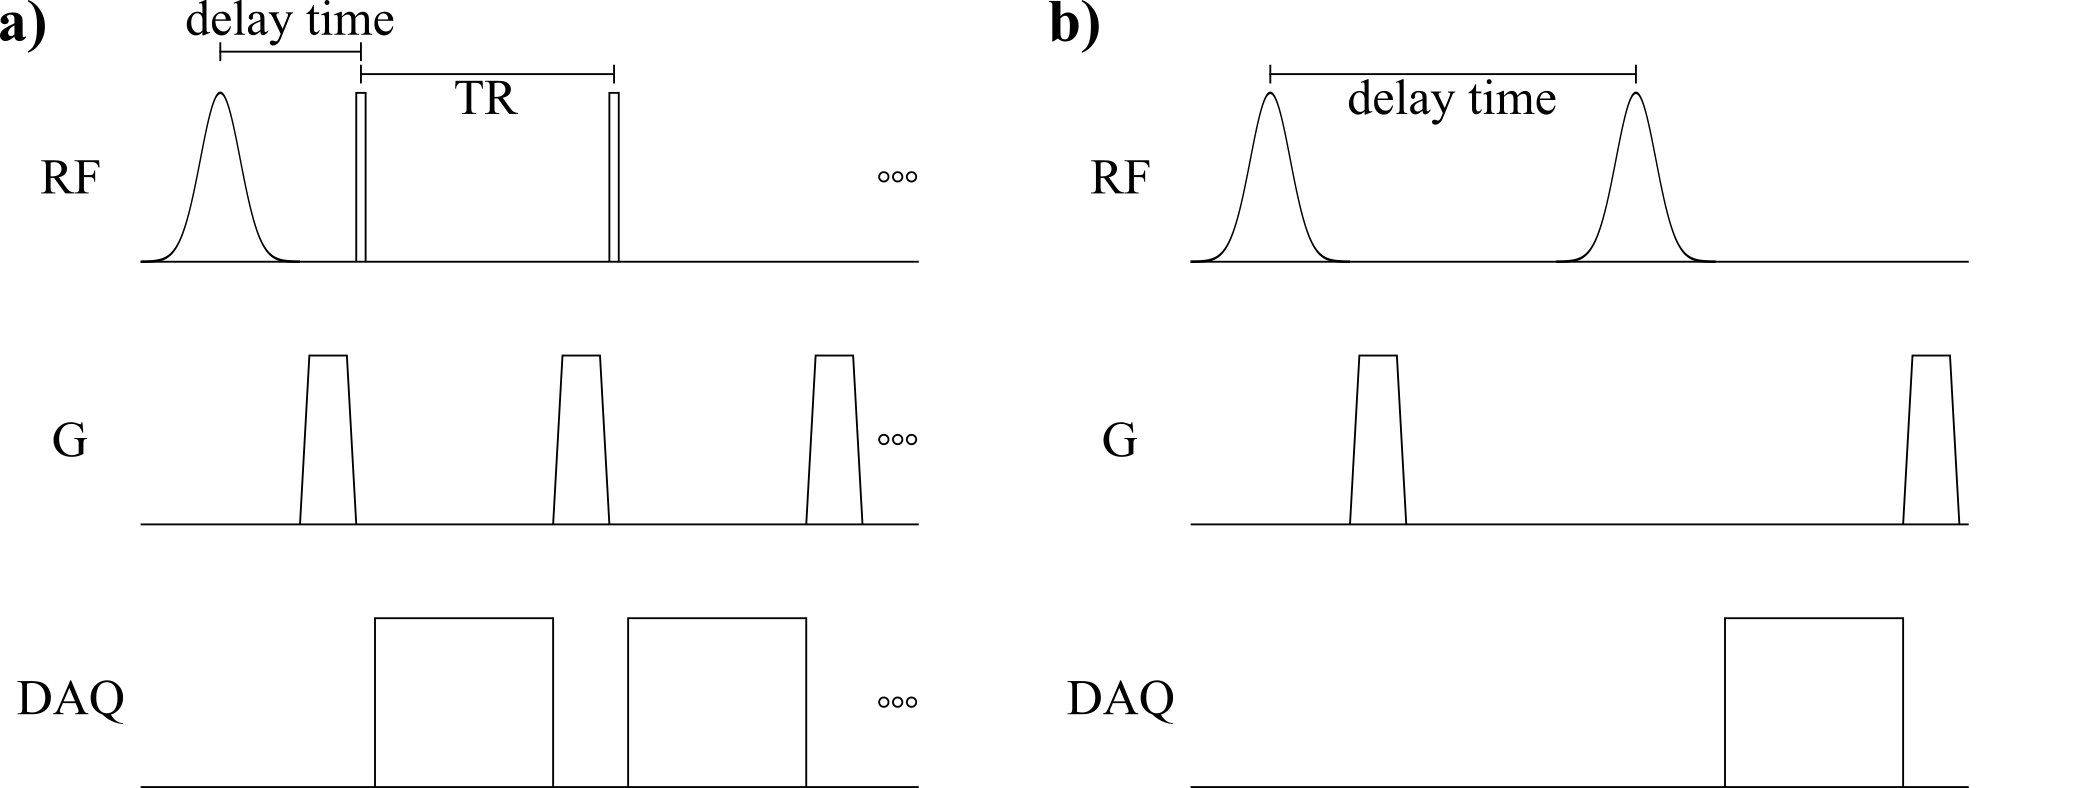
Figure 1. a) Rapid CSSR sequence: Magnetization in the 129Xe dissolved phase is destroyed by a 1200µs 90° Gaussian RF pulse at 208ppm and subsequent spoiler gradient. At delay times from 1.09ms to 397.73ms, gas and dissolved-phase magnetization is excited using 20µs 1° hard pulses. Sequence parameters include TR/TE 2.96ms/0.11ms, 30 repetitions. b) Conventional CSSR sequence: Magnetization is both saturated and excited by a 1200µs 90° Gaussian RF pulse at 208ppm with variable delay time from 2.3ms to 600ms.
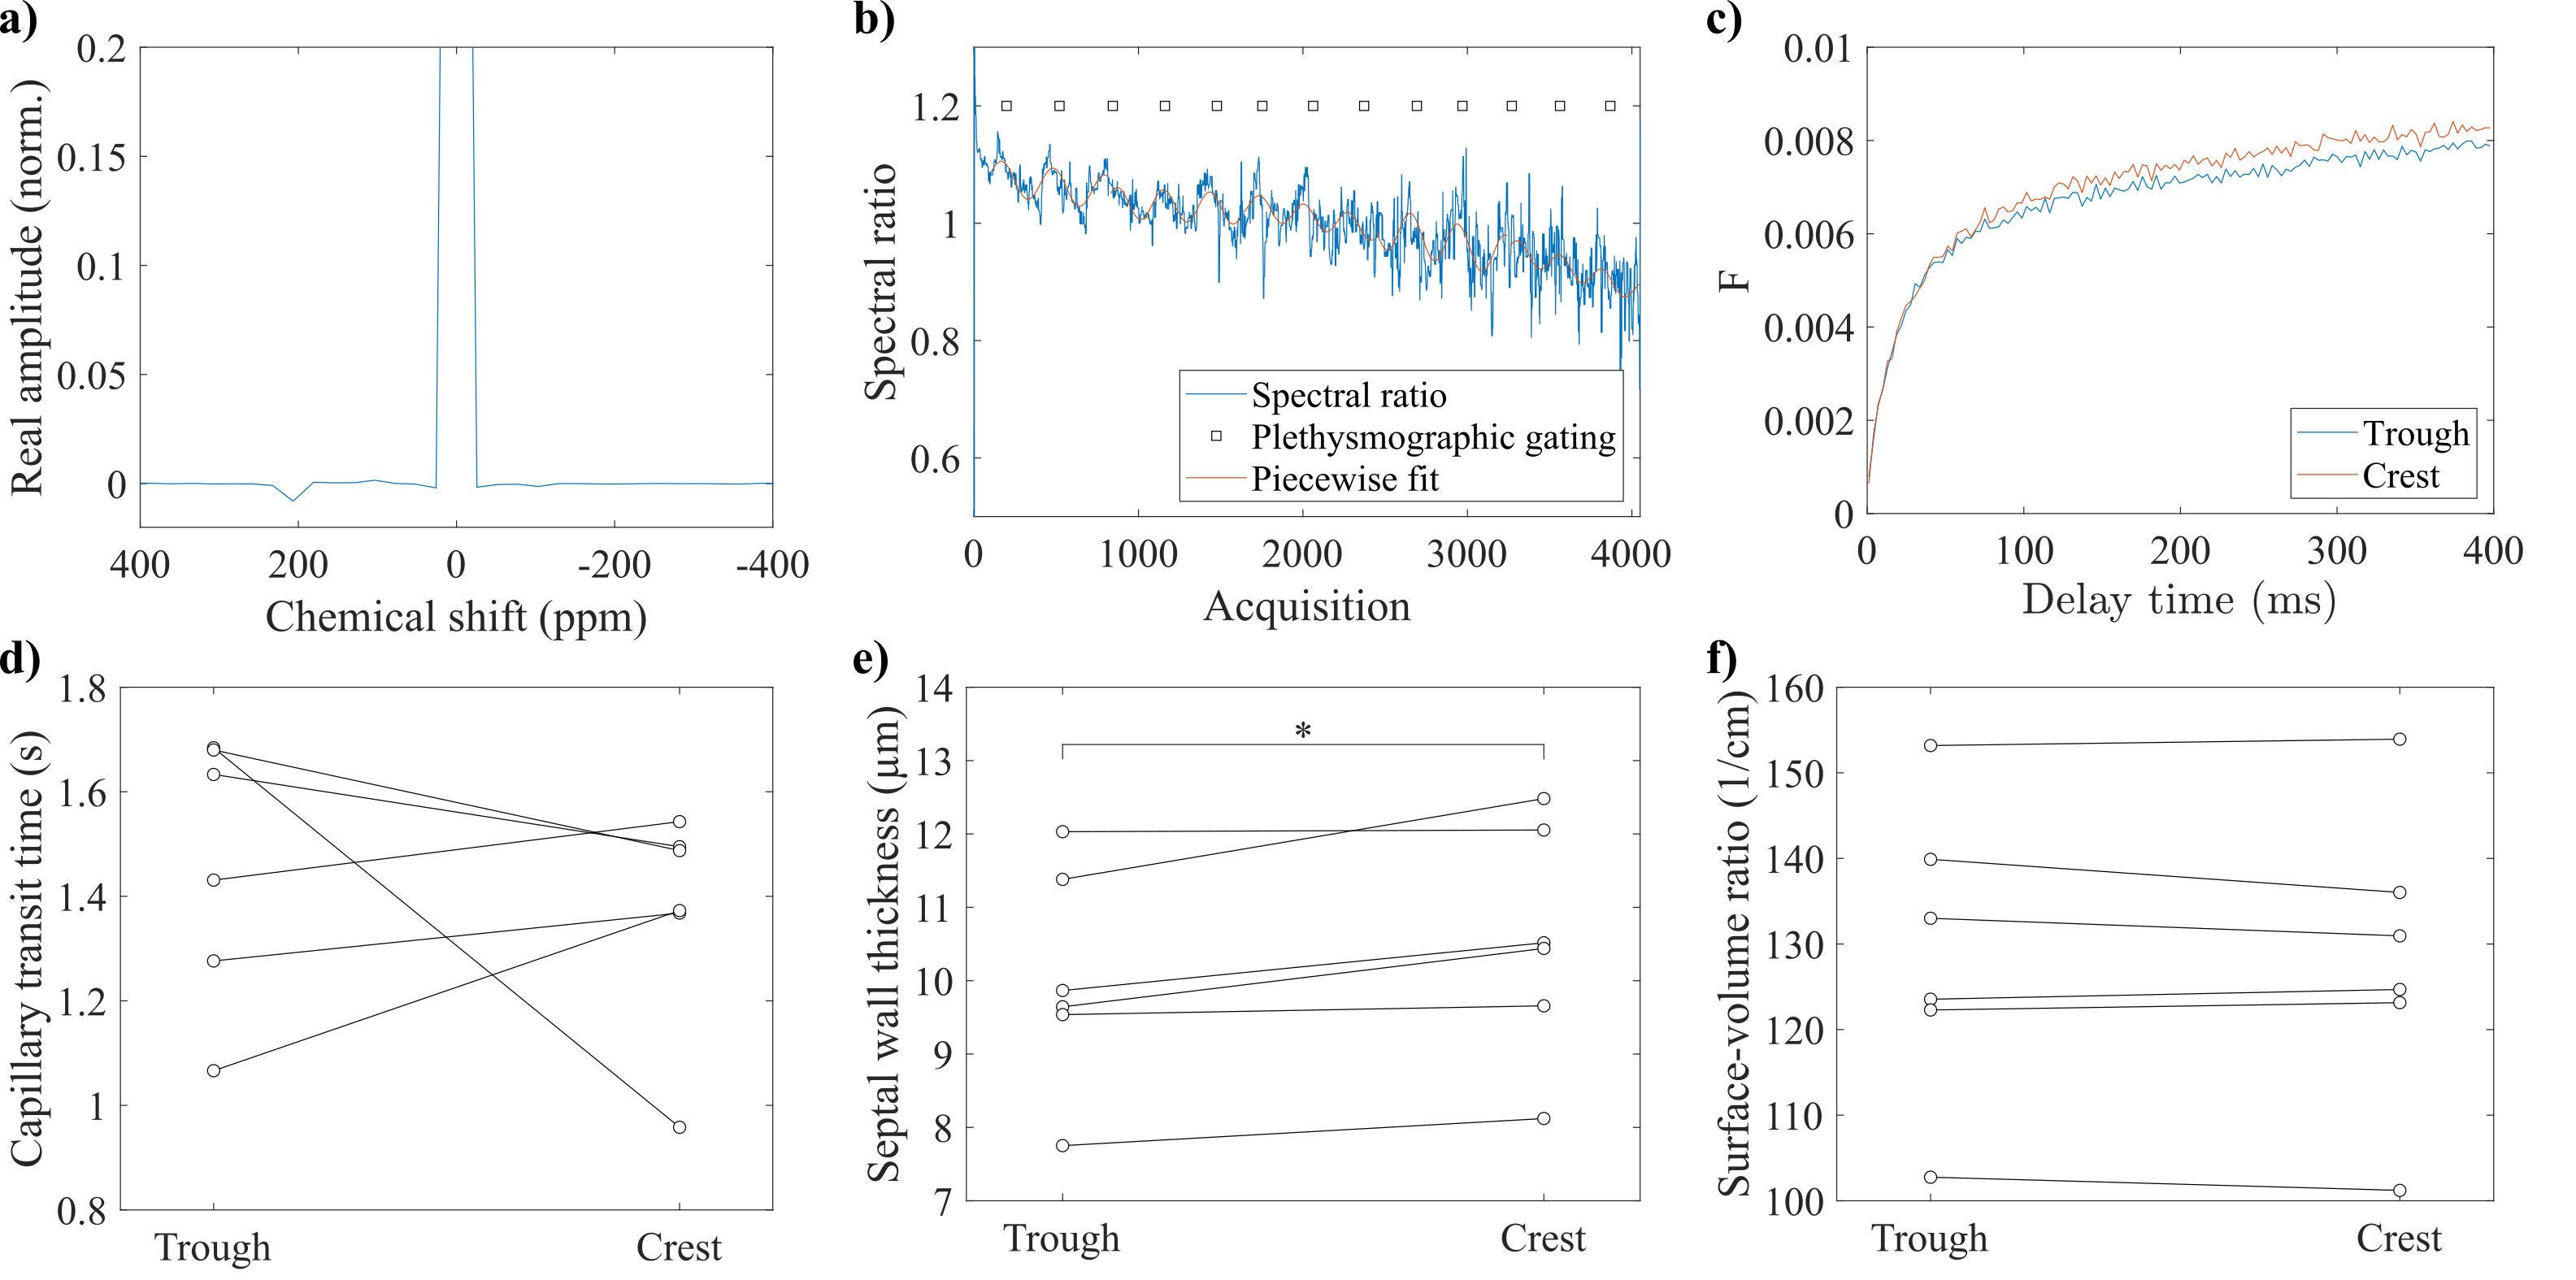
Figure 2. a) Rapid CSSR spectrum before interpolation at maximum delay time, gas resonance normalized to 1. b) Ratio of interpolated spectra around 225ppm and 195ppm after removing delay-time associated changes by division through an averaged curve and filtering. c) Reconstructed gas uptake curves for trough and crest. Parameters from Patz model fit in trough and crest for d) capillary transit time, e) septal wall thickness (significant difference with p = 0.031) and f) surface-to-volume ratio.
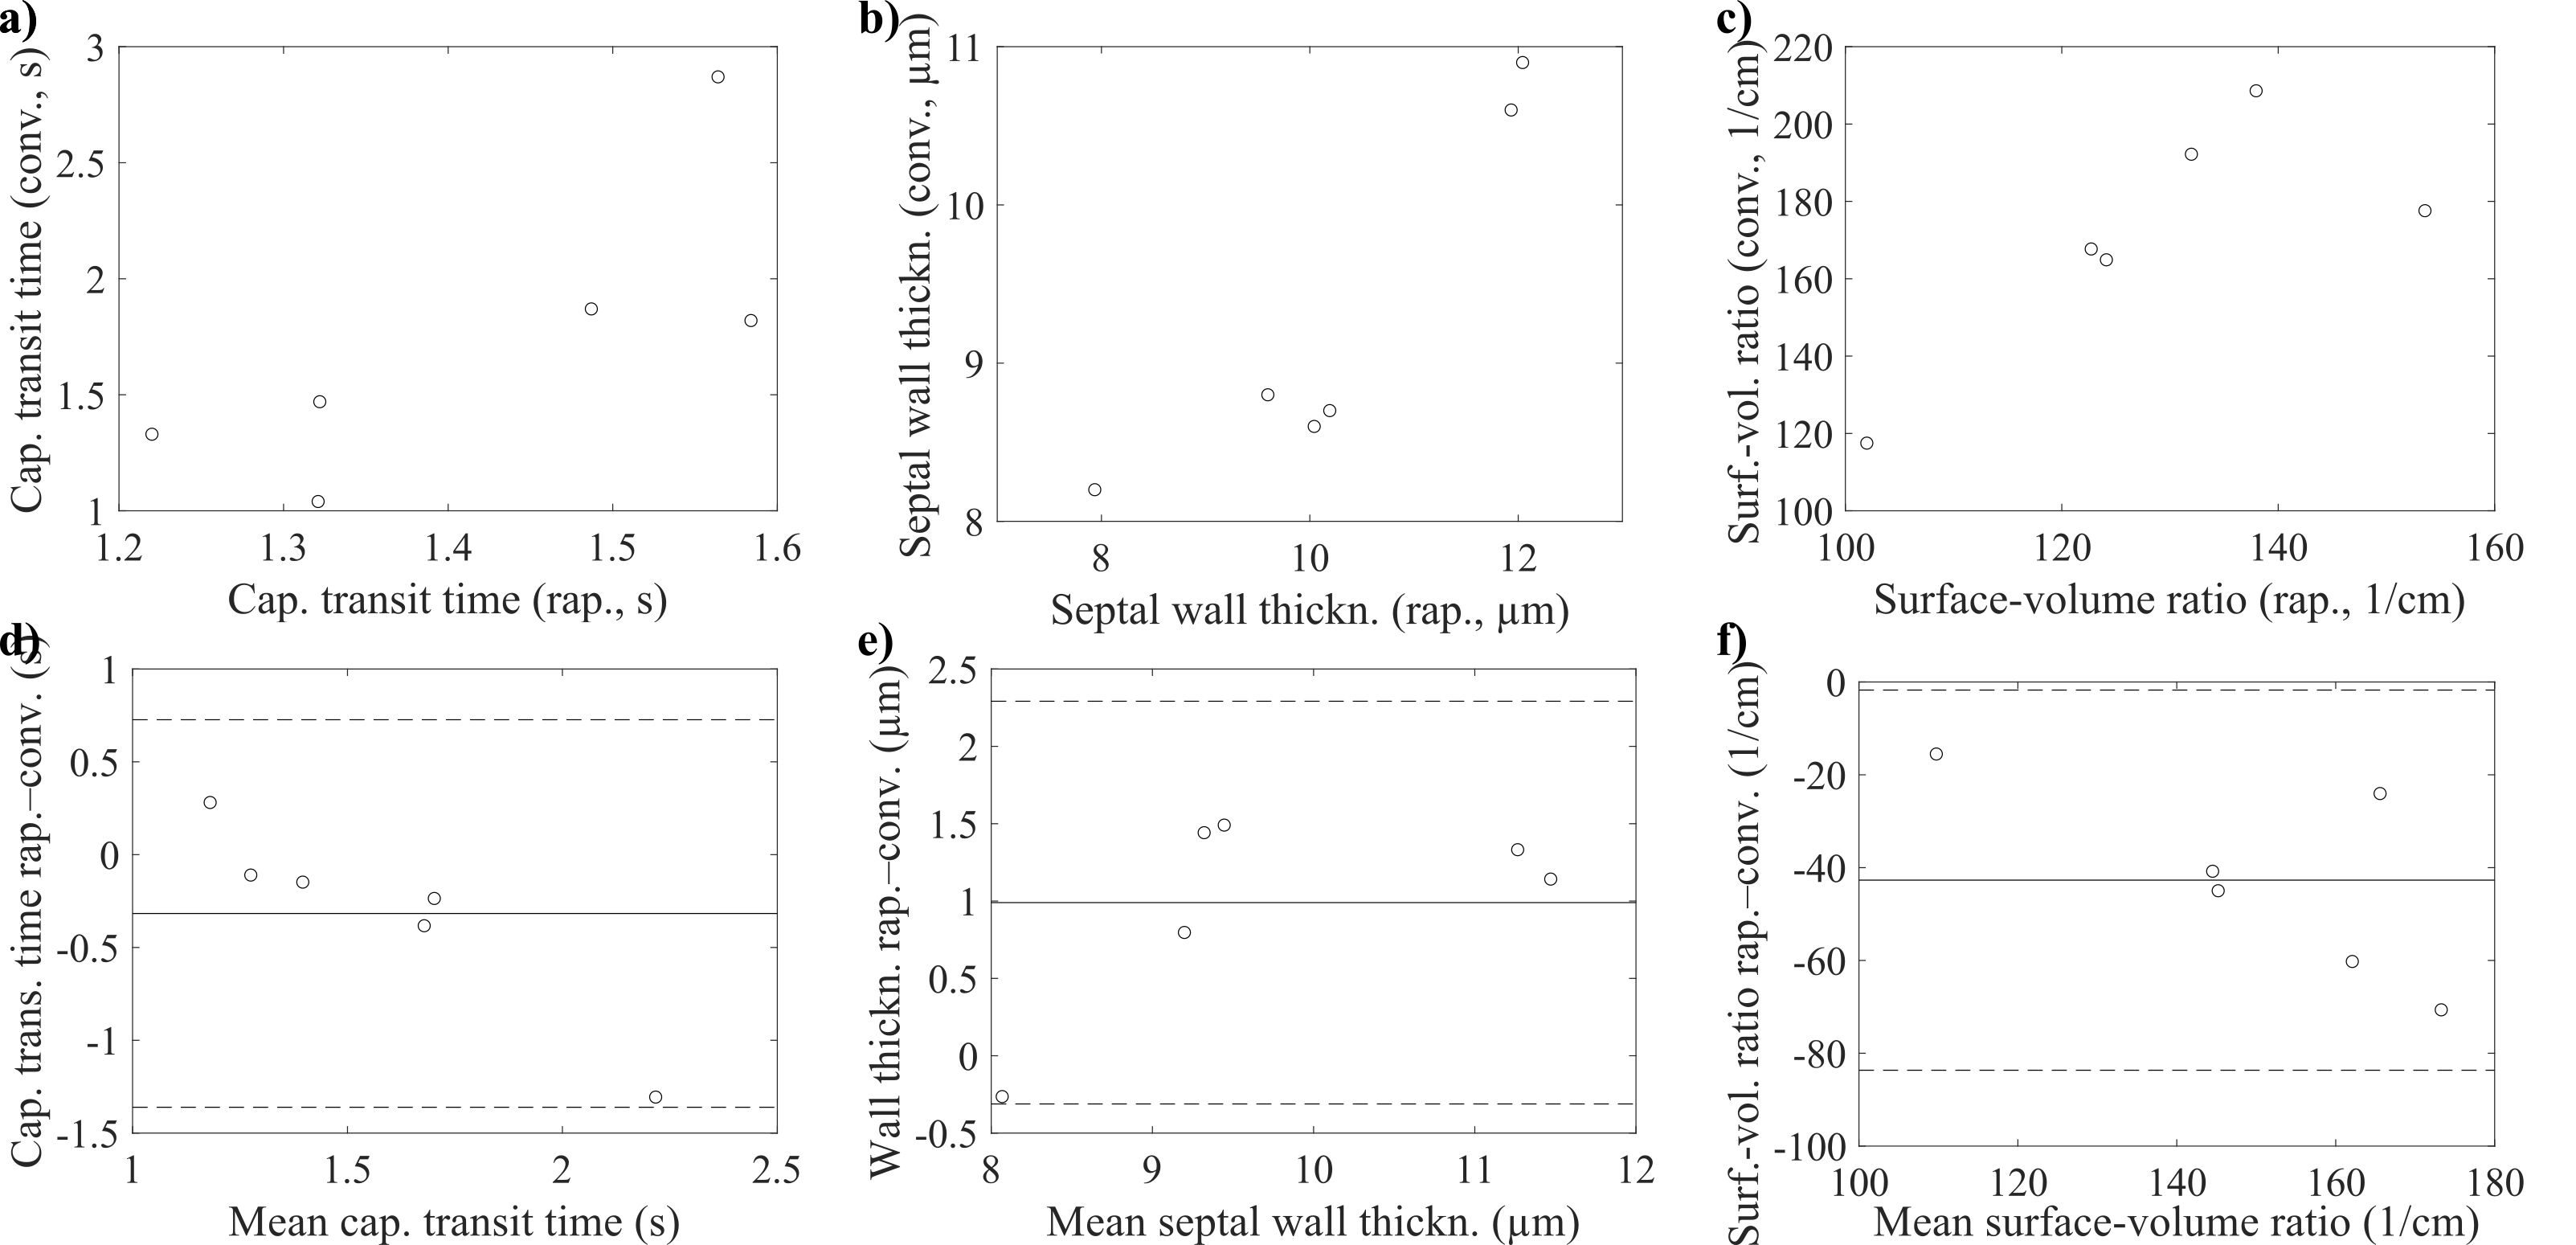
Figure 3. Correlations between results averaged for trough and crest from rapid CSSR and conventional CSSR for a) capillary transit time, R = 0.761, p = 0.050, b) septal wall thickness, R = 0.919, p = 0.019, c) surface-to-volume ratio, R = 0.770, p = 0.092. Bland–Altman analysis for d) capillary transit time, e) septal wall thickness and f) surface-to-volume ratio.
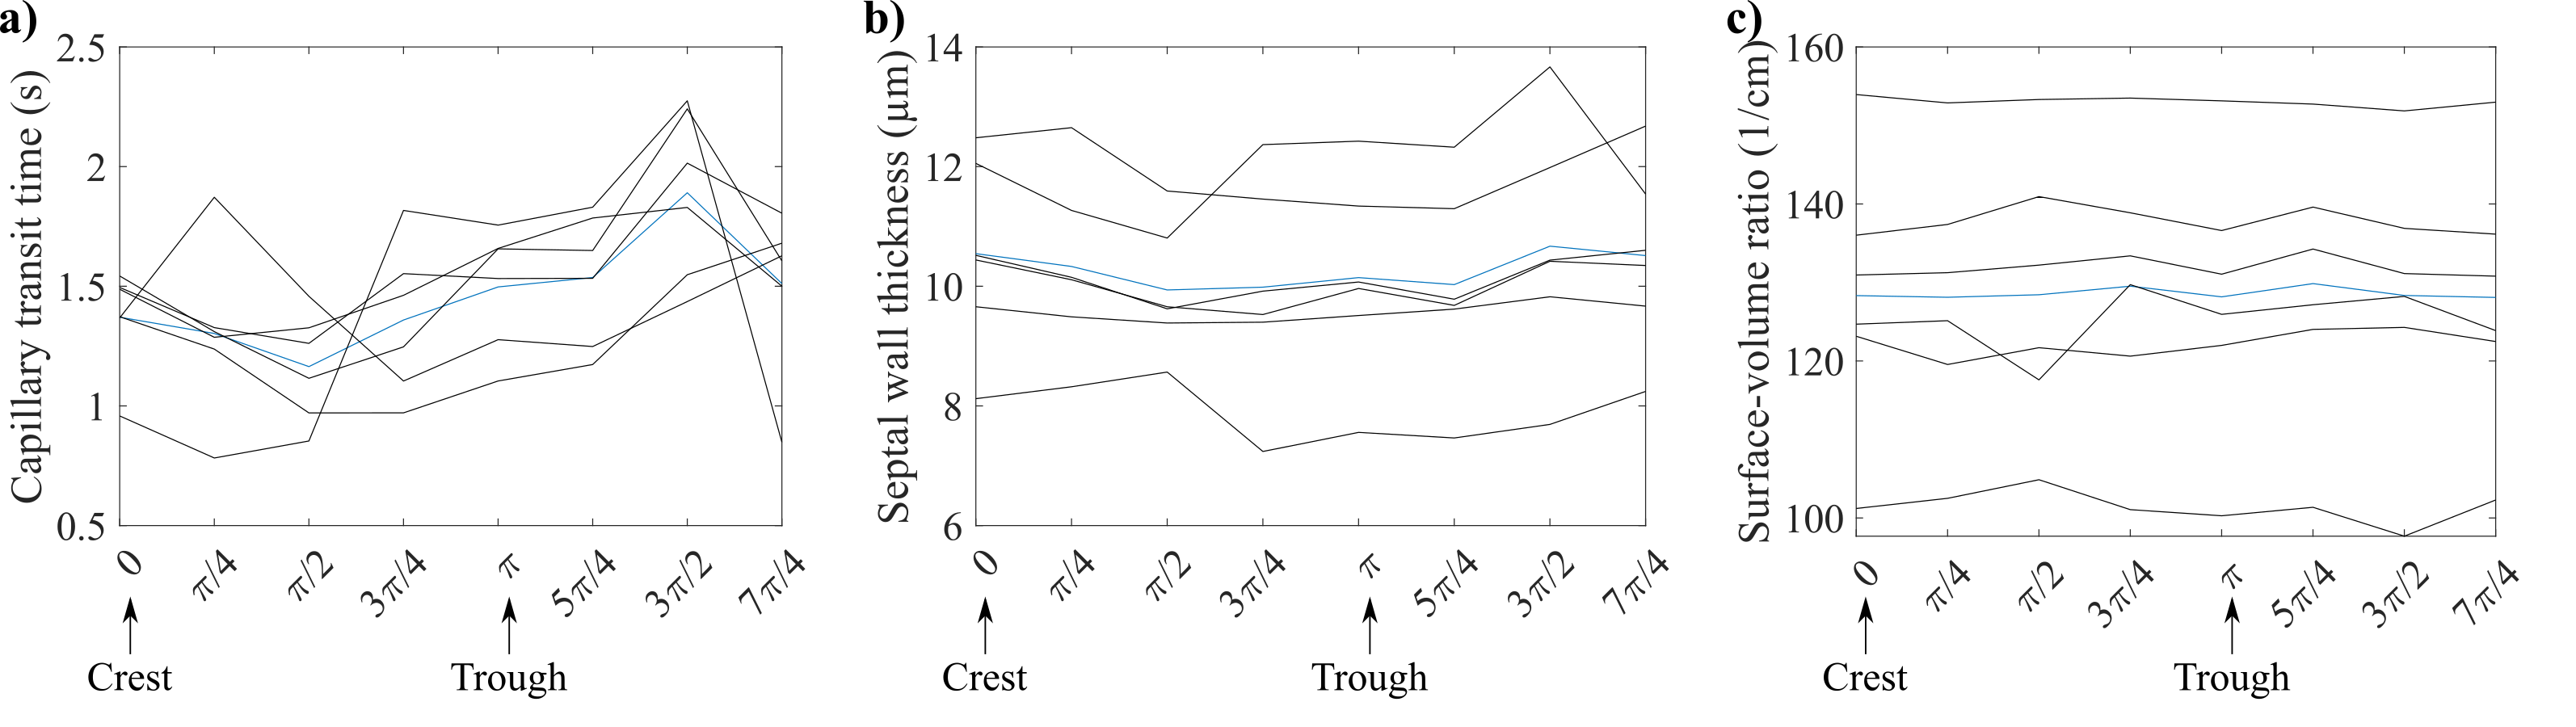
Figure 4. Sliding-window reconstruction as function of the phase subtracted from the sine argument obtained through piecewise sine fit for a) capillary transit time, b) septal wall thickness and c) surface-to-volume ratio. Data are shown in black for each participant. Blue curve shows an average over all participants. Lines are drawn to guide the eye.