3540
Glutamate Metabolism Mapping after Oral Administration of 1-13C-Glc using 1H MRSI in the human brain at 9.4 T1High-Field MR Center, Max Planck Institute for Biological Cybernetics, Tuebingen, Germany, 2Advanced Imaging Research Center, University of Texas Southwestern Medical Center, Dallas, TX, United States
Synopsis
Glutamate is the major excitatory neurotransmitter in the brain and malfunction of glutamatergic metabolism is associated with various neurological disorders. Respective metabolic rates can be determined via direct 13C or indirect 1H-[13C] MRS after intake of 13C labelled tracers. In this work, labeling effects after oral intake of [13C-1]glucose are observed in human brain using a 1H-FID-MRSI sequence at 9.4T. Spectral time series of GM and WM voxels as well as metabolite maps show regionally distinct and tissue type specific labelling induced changes of Glu and Gln spectral pattern that allow for the determination of 13C label uptake rates.
Introduction
Glutamate is the major excitatory transmitter in the brain and malfunction of glutamatergic metabolism is associated with various neurological and psychiatric disorders1-7. For better insights into the function of the glutamatergic system, metabolic rates can be determined via direct 13C or indirect 1H-[13C] magnetic resonance spectroscopy after the administration of a 13C labelled tracer such as [13C-1]glucose. Subsequent changes in the spectra due to the incorporation of the 13C nuclei from Glc into different metabolites further downstream from glycolysis to the TCA cycle and into the glutamatergic metabolism can be observed by either direct 13C or indirect 1H-[13C] MRS. Boumezbeur et al. showed the feasibility to observe 13C label incorporation by observing additional peak splitting due to J-coupling between protons and 13C nuclei using conventional 1H MRS8 in monkeys, which abandons the need of specialized 13C hardware and scan software. This single voxel 1H MRS approach has been recently reproduced in the human brain and observation of respective change in Glu and Gln have been shown9-12.In the present work, the feasibility of measuring metabolic uptake curves in a highly spatially and temporally resolved manner by 1H MRSI for more metabolites and in more voxels than ever before in human brain is shown. The [1-13C]Glc was administered orally instead of intravenous and the spectra were measured with a 2D 1H MRSI sequence in the human brain at 9.4T.
Methods
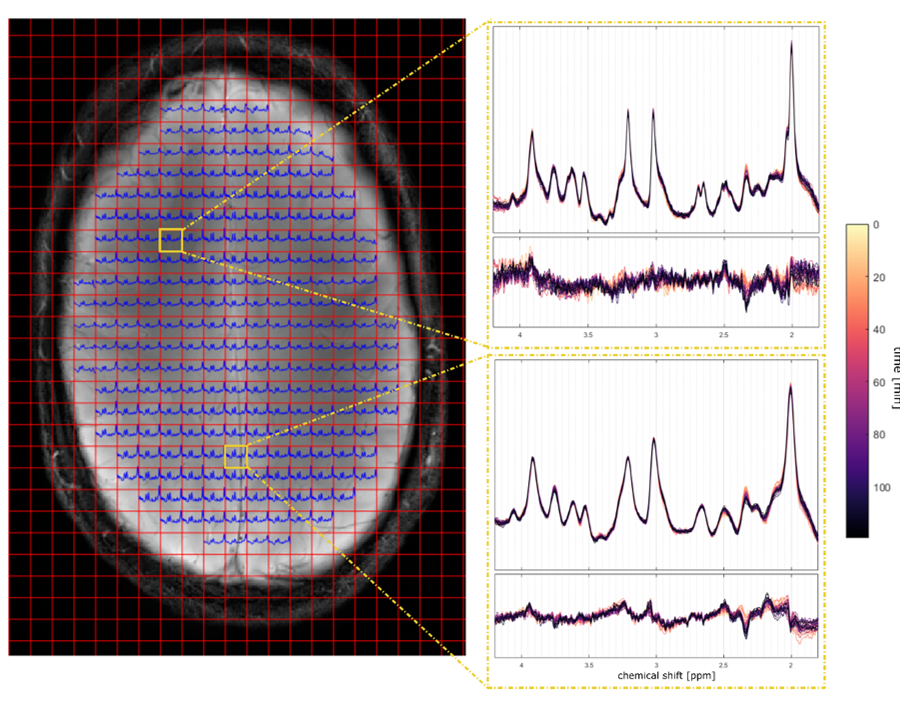
The study was performed after IRB approval and signed consent of all five volunteers, who fastened for 9 hours before the measurement started. For each volunteer a solution containing 0.75g of [13C-1]glucose (Aldrich Chemical Company, Miamisburg, Ohio, USA; API for clinical studies) per kilogram body weight were prepared. All measurements were performed using a 9.4T Magnetom whole-body MR scanner (Siemens Healthineers, Erlangen, Germany) with an in-house built radiofrequency (RF) array coil with 18 transmit and 32 receive channels13. The transversal MRSI slice (FOV 220 mm x 220 mm x 7 mm) were positioned just above the Corpus Callosum (Figure 1). The slice was B0 shimmed using the vendor implemented image-based second-order B0 shimming routine. A customized 1H FID MRSI sequence14 (resolution 32x32, TR = 300 ms, TE*=1.5 ms, flip angle = 48°, spectral width= 8000 Hz, acquisition time = 128 ms) with water suppression was acquired15 before a non-water suppressed reference scan with the same resolutions was acquired with the same parameters as the MRSI scan. The scan time for one MRSI acquisition was 3.6 minutes. After the mentioned measurements were executed, the scanner table was pulled out and the volunteers drunk the [13C-1]glucose solution as fast as possible (if possible while lying down and keeping the head as still as possible while drinking). After this short break, the scanner table was pushed back into the scanner. After verification whether repositioning of the MRSI slice was needed due to motion, 1H MRSI data acquisition was resumed immediately and as many as possible MRSI data sets we recorded to fill a total scan time of 2 hours. In a different session, an MP2RAGE image from each volunteer was acquired.The MRSI data was reconstructed with in-house-written Matlab code15 and fitted using LCModel16 with a basis set simulated with VeSPA17 that included basis spectra for 12C and 13C Glu and Gln as well as a simulated relaxation corrected MM spectrum18-20.
Results
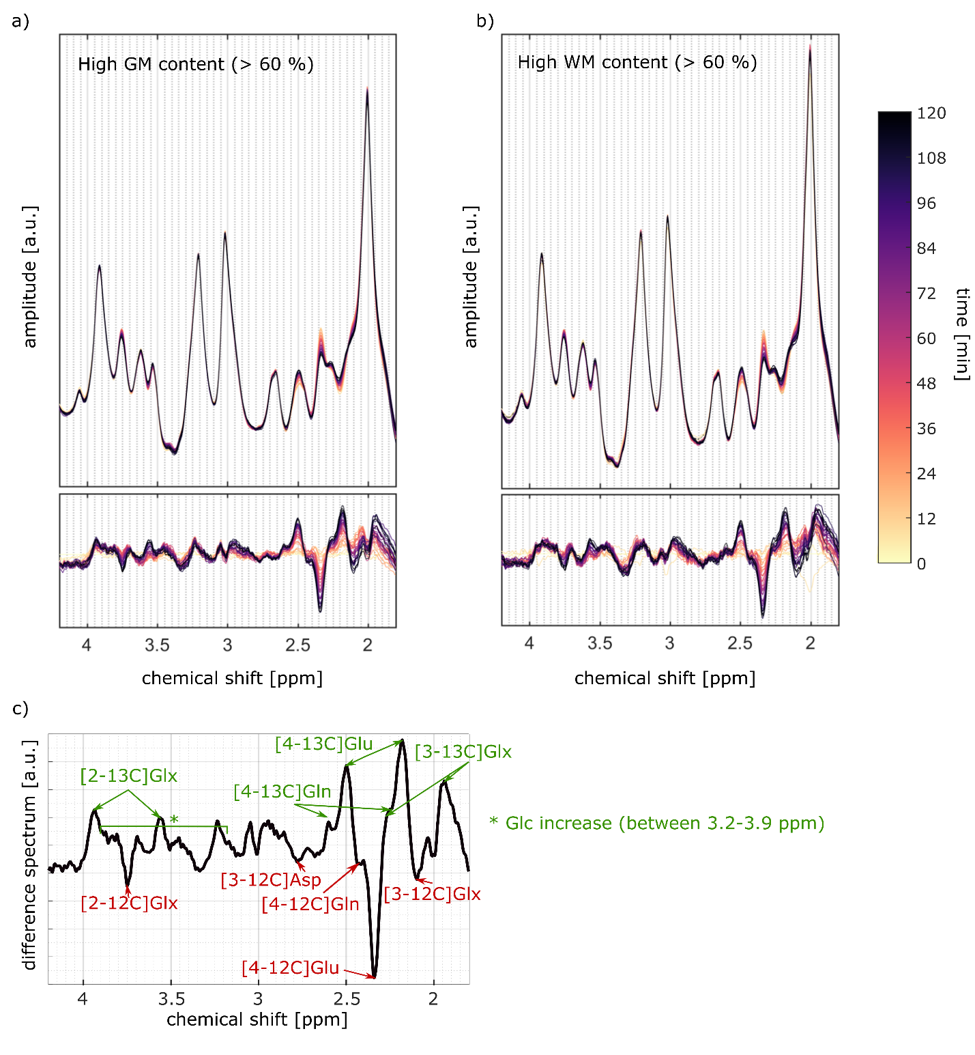
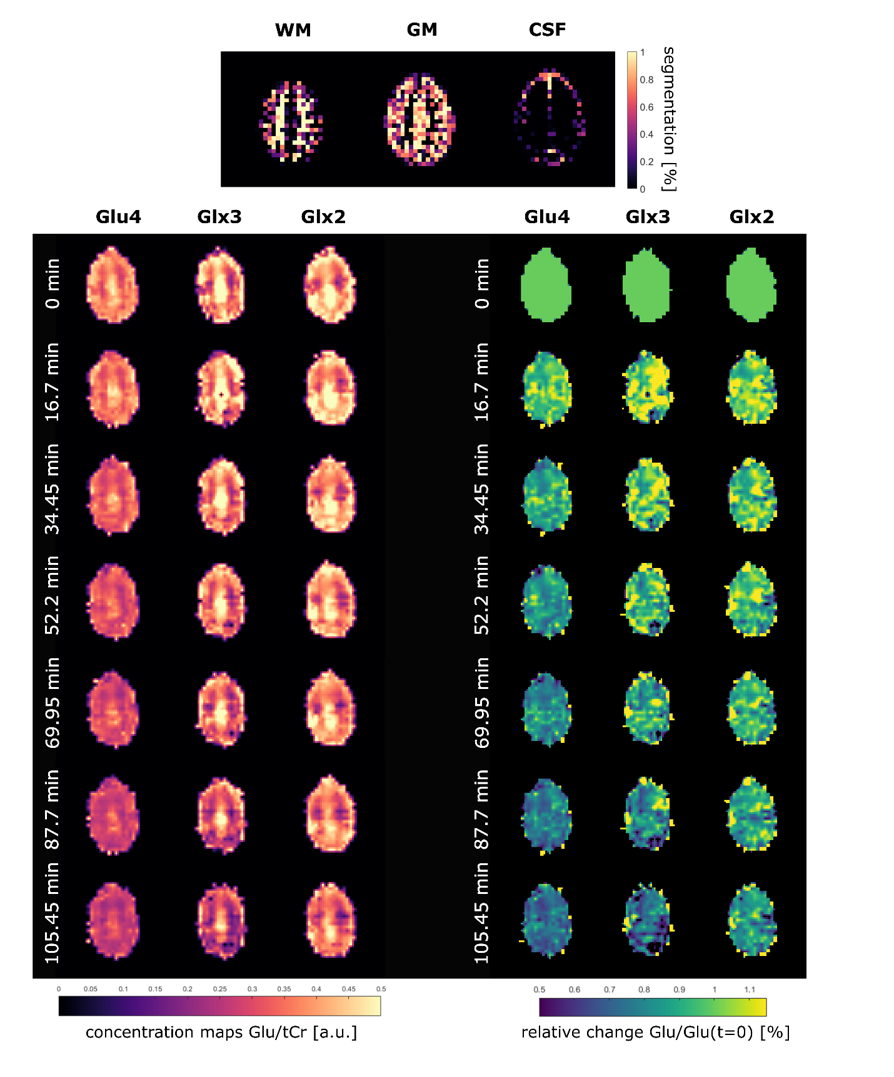
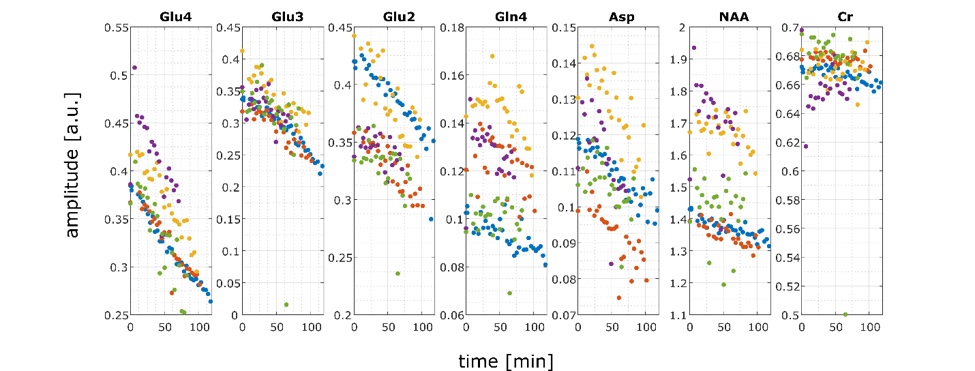
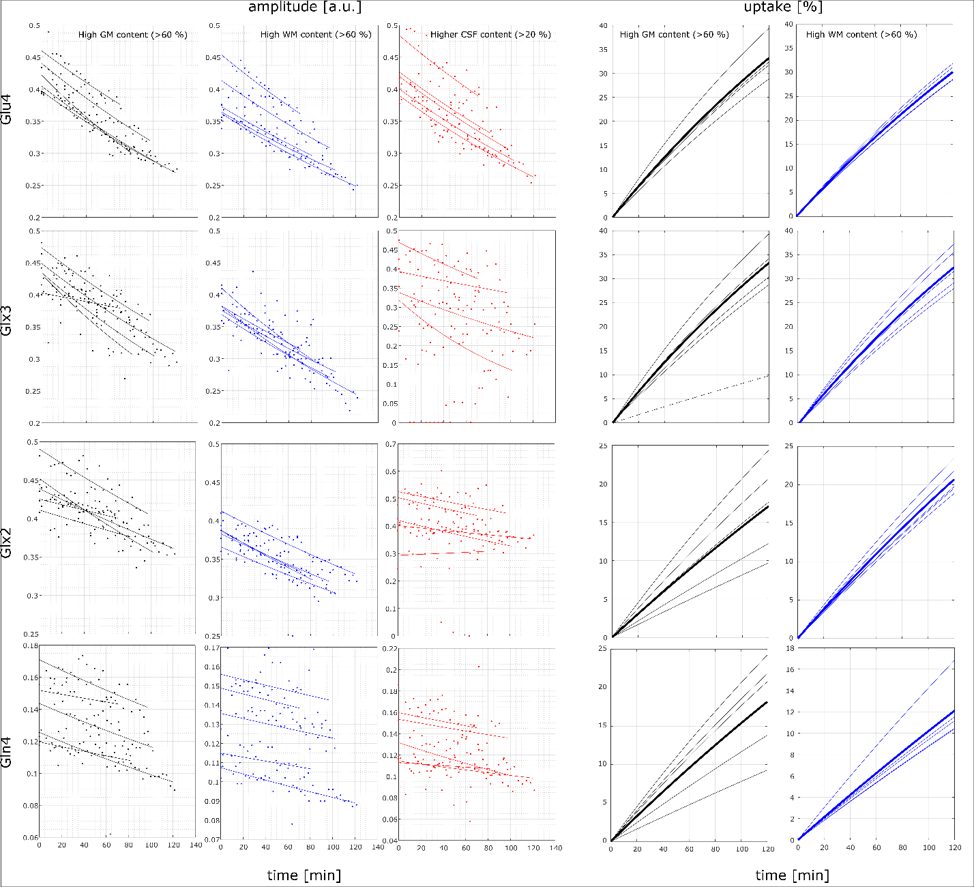
A high spectral quality and a high reproducibility of the 1H MRSI data was obtained across the entire transversal brain slice parallel to the Corpus Callosum using ultra-short TE and TR 1H FID-MRSI in five volunteers (Figure 1). Spectral pattern changes over time related to 13C label incorporation into glutamate could be observed in individual voxels (Figure 1). Summed spectra from grey matter (GM) rich and white matter (WM) rich brain tissue revealed 13C labelling induced spectral pattern changes for a number of additional metabolites (Figure 2). High quality spatially and temporally resolved 12C concentration maps and relative change maps could be derived for [4-12C]Glu, [3-12C]Glx and [2-12C]Glx peaks with a high temporal (3.6 min) and spatial resolution (32x32 grid with nominal voxel size of 0.33 μL) (Figure3). These glutamate metabolism images allow for a distinction of GM and WM in the human brain. In addition whole brain summed spectra allowed to derive signal intensity curves for [4-12C]Glu, [3-12C]Glx, [2-12C]Glx, [4-12C]Gln, total Asp and [6-12C]NAA (Figure 4). From the observed decrease in 12C labelled metabolite concentration the respective increase in 13C label uptake can be derived (Figure 5). Summed spectra of GM rich and WM rich spectra finally allowed the investigation of tissue type specific 13C label incorporation via the decreasing [4-12C]Glu, [3-12C]Glx, [2-12C]Glx and [4-12C]Gln signal amplitudes (Figure 5).Discussion & Conclusion
This work demonstrates for the first time that glutamatergic metabolism can be investigated with high spatial and temporal resolution by 1H MRSI at 9.4T in the human brain. No specialized 13C hardware or scan software was needed and the scan protocol as well as the oral intake of [13C-1]glucose was well tolerated by all subjects. Since the distinction of Glu and Gln was possible the data allow for modelling of neurotransmitter turnover rates in the human brain in GM versus WM in future.Acknowledgements
Funding by the ERC Starting Grant (SYNAPLAST MR, Grant Number: 679927) of the European Union and the Cancer Prevention and Research Institute of Texas (CPRIT, Grant Number: RR180056) is gratefully acknowledged.References
1. Luykx JJ, Laban KG, van den Heuvel MP, et al. Region and state specific glutamate downregulation in major depressive disorder: A meta-analysis of 1H-MRS findings. Neurosci Biobehav Rev. 2012;36(1):198-205. doi:10.1016/j.neubiorev.2011.05.014
2. Mitchell ND, Baker GB. An update on the role of glutamate in the pathophysiology of depression. Acta Psychiatr Scand. 2010;122(3):192-210. doi:10.1111/j.1600-0447.2009.01529.x
3. Yüksel C, Öngür D. Magnetic resonance spectroscopy studies of glutamate-related abnormalities in mood disorders. Biol Psychiatry. 2010;68(9):785-794. doi:10.1016/j.biopsych.2010.06.016
4. Sanacora G, Zarate CA, Krystal JH, Manji HK. Targeting the Glutamatergic System to Develop Novel, Improved Therapeutics for Mood Disorders. Nat Rev Drug Discov. 2009;7(5):426-437. doi:10.1038/nrd2462 5.
5. Blüml S, Moreno A, Hwang J-H, Ross BD. 1- 13 C glucose magnetic resonance spectroscopy of pediatric and adult brain disorders. NMR Biomed. 2001;14(1):19-32. doi:10.1002/nbm.679 6.
6. Pfund Z, Chugani DC, Juhász C, et al. Evidence for coupling between glucose metabolism and glutamate cycling using FDG PET and 1H magnetic resonance spectroscopy in patients with epilepsy. J Cereb Blood Flow Metab. 2000;20(5). doi:10.1097/00004647-200005000-00014 7.
7. Bartnik-Olson BL, Ding D, Howe J, Shah A, Losey T. Glutamate metabolism in temporal lobe epilepsy as revealed by dynamic proton MRS following the infusion of [U13-C] glucose. Epilepsy Res. 2017;136(April):46-53. doi:10.1016/j.eplepsyres.2017.07.010
8. Boumezbeur F, Besret L, Valette J, et al. NMR measurement of brain oxidative metabolism in monkeys using 13C-labeled glucose without a 13C radiofrequency channel. Magn Reson Med. 2004;52(1):33-40. doi:10.1002/mrm.20129
9. An L, Li S, Ferraris Araneta M, Johnson CS, Murdoch JB, Shen J. In Vivo Detection of 13 C Labeling of Glutamate and Glutamine Using Proton MRS at 7T. ISMRMB Abstr. 2015;23(2014):25150. doi:10.1002/mrm.25150.3.
10. An L, Li S, Murdoch JB, Araneta MF, Johnson CS, Shen J. Detection of glutamate, glutamine, and glutathione by radiofrequency suppression and echo time optimization at 7 Tesla. Magn Reson Med. 2015;73(2):451-458. doi:10.1002/mrm.25150
11. Dehghani M, Zhang S, Kumaragamage C, Rosa-Neto P, Near J. Dynamic 1H-MRS for detection of 13C-labeled glucose metabolism in the human brain at 3T. Magn Reson Med. 2020. doi:10.1002/mrm.28188
12. Ziegs T, Dorst J, Henning A. 13C-Glucose Labeling Effects measured in the Occipital Lobe and the Frontal Cortex using short TE 1H MC-semiLASER SVS at 9.4T. Proceedings of the 29th annual scientific meeting of ISMRM, May 15th – 20th 2021
13. Avdievich NI, Giapitzakis I-A, Bause J, Shajan G, Scheffler K, Henning A. Double-row 18-loop transceive-32-loop receive tight-fit array provides for whole-brain coverage, high transmit performance, and SNR improvement near the brain center at 9.4T. Magn Reson Med. 2019;81(5):3392-3405. doi:10.1002/mrm.27602
14. Henning A, Fuchs A, Murdoch JB, Boesiger P. Slice-selective FID acquisition, localized by outer volume suppression (FIDLOVS) for 1H-MRSI of the human brain at 7 T with minimal signal loss. NMR Biomed. 2009;22(7):683-696. doi:10.1002/nbm.1366
15. Nassirpour S, Chang P, Henning A. High and ultra-high resolution metabolite mapping of the human brain using 1 H FID MRSI at 9.4T. Neuroimage. 2018;168:211-221. doi:10.1016/j.neuroimage.2016.12.065
16. Provencher SW. Estimation of metabolite concentrations from localizedin vivo proton NMR spectra. Magn Reson Med. 1993;30(6):672-679. doi:10.1002/mrm.1910300604
17. Soher BJ, Semanchuk P, Todd D, Steinberg J, Young K. VeSPA: Integrated Applications for RF Pulse Design, Spectral Simulation and MRS Data Analysis.; 1994.
18. Murali-Manohar S, Wright AM, Borbath T, Avdievich NI, Henning A. A novel method to measure T1-relaxation times of macromolecules and quantification of the macromolecular resonances. Magn Reson Med. 2020;85(2):601-614. doi:10.1002/mrm.28484
19. Murali-Manohar S, Borbath T, Wright AM, Soher B, Mekle R, Henning A. T2 relaxation times of macromolecules and metabolites in the human brain at 9.4 T. Magn Reson Med. 2020;84(2):542-558. doi:10.1002/mrm.28174
20. Wright AM, Murali-Manohar S, Borbath T, Avdievich NI, Henning A. Relaxation corrected macromolecular model enables determination of 1H longitudinal T1-relaxation times and concentrations of human brain metabolites at 9.4 T. Magnetic Resonance in Medicine, Epub 2021
Figures