3539
Spatially resolved FID spectroscopy using a 3D spiral UTE imaging sequence1Section on Experimental Radiology, University Hospital Tübingen, Tübingen, Germany, 2Institute for Diabetes Research and Metabolic Diseases, Helmholtz Center Munich at the University of Tübingen, Tübingen, Germany
Synopsis
This method allows for the calculation of pixel-wise FID spectra based on a 3D spiral UTE imaging sequence. Images were acquired for 36/72 TE and extrapolated. The method is advantageous for rapidly decaying 1H signals such as those of collagen in tendons or fibrotic tissue. A phantom (6 collagen solutions) served for evaluation. Resulting spectra are comparable to a standard non-localized FID spectrum and show positive correlation between collagen concentration and signal. First in-vivo results recorded in the subcutaneous adipose tissue exhibit the typical fat resonances. The presented UTE-FID spectroscopy seems feasible for spatially resolved applications of rapidly decaying signals.
Introduction
Biologically interesting signals can exhibit fast transverse relaxation and frequency shifts compared to free water. Such are for example 1H signals from water and collagen in tendons and bones1 or myelin water signals and are only detectable at very short echo times, as enabled by pulse-acquire spectroscopy or UTE imaging sequences. Common CSI or MRSI2,3 methods offer a simultaneous assessment of spatial and spectral information but require phase-encoding strategies between RF excitation of the magnetization and the start of signal acquisition resulting in a delay of at least 1ms. For spectral assignment, a UTE imaging sequence was modified to provide pixel-wise FID acquisition with minimal delay of 0.05ms after RF excitation.Methods
All measurements were performed on a 3T whole body imager MAGNETOM PrismaFit (Siemens Healthcare, Erlangen, Germany). Phantom measurements (six vials with 55%, 44%, 37%, 29%, 17% and 9% aqueous collagen solutions surrounded by distilled water) were conducted on a 20-channel head-neck coil, while standard non-localized FID-spectroscopy (TE=0.15ms, TR=1500ms, 32 acquisitions, 2048 time points) of a sphere filled with 50% collagen solution was executed with a wrist coil and in-vivo UTE images of a healthy knee were acquired using a knee coil. The UTE-FID approach presented relies on a prototypical multi-echo 3D spiral UTE sequence with six echoes per RF excitation (echo spacing=3ms, TR=22ms) resulting in 64 partitions (matrix size=128x128, FOV=128x128mm²) with 2mm thickness. A complex pixel-wise raw data set for FID spectroscopy is obtained by several temporal interleaves with systematic shifting of the readout by 0.25ms (phantom) or 0.5ms (in-vivo), until the time domain is filled for 18ms resulting in a measurement time of 24min or 12min, respectively. This leads to a chemical shift range of 4kHz for the phantom study and thus to oversampling regarding the chemical shift range of collagen signals at 3T. Every second data set of the phantom study was omitted to evaluate the influence of the dwell time on the spectral quality. B0 drifts are compensated by mapping and according temporal and spatial phase correction. Autoregressive extrapolation of the signal with Burg’s algorithm4 resulting in 2048 time points is performed prior to Gaussian filtering (σ=10ms) and calculation of the spectrum by Fourier transformation.Results
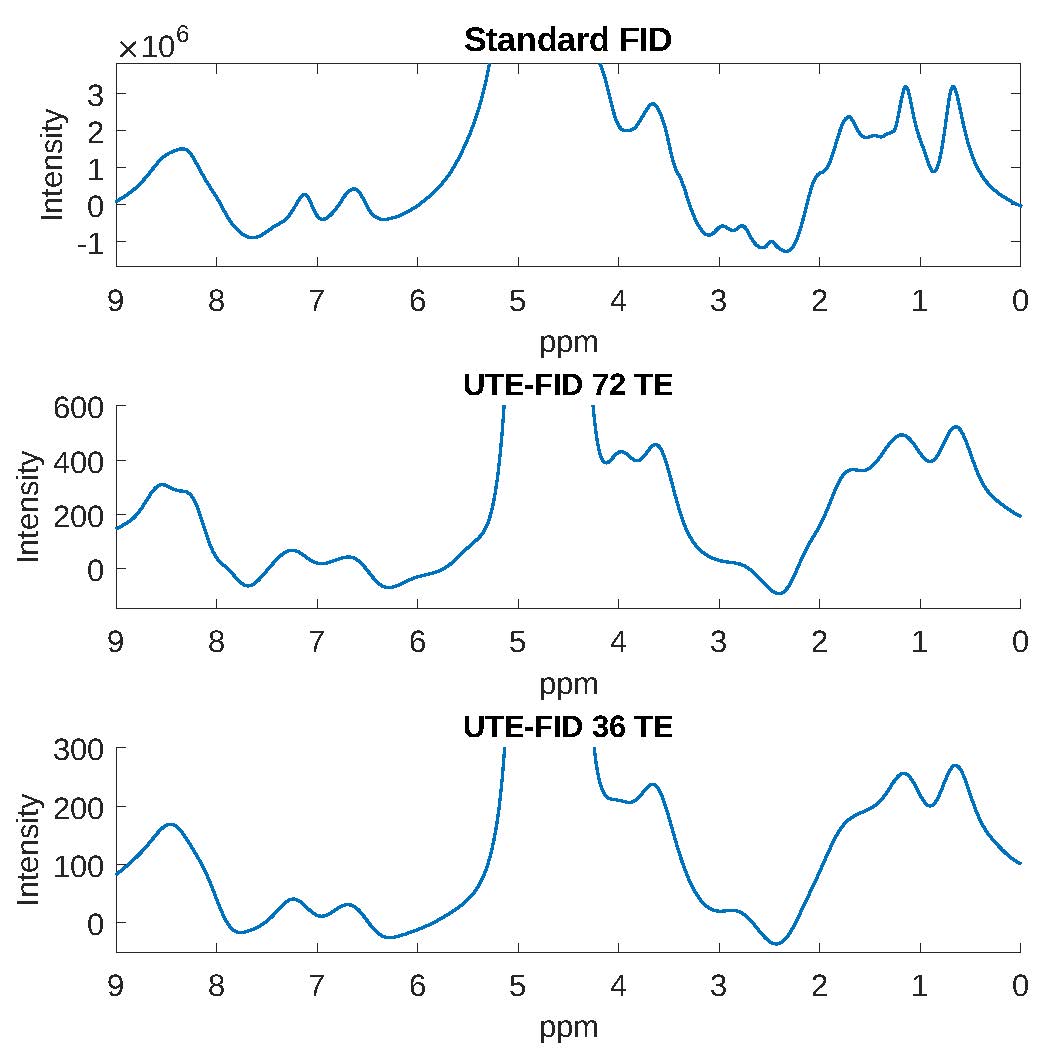
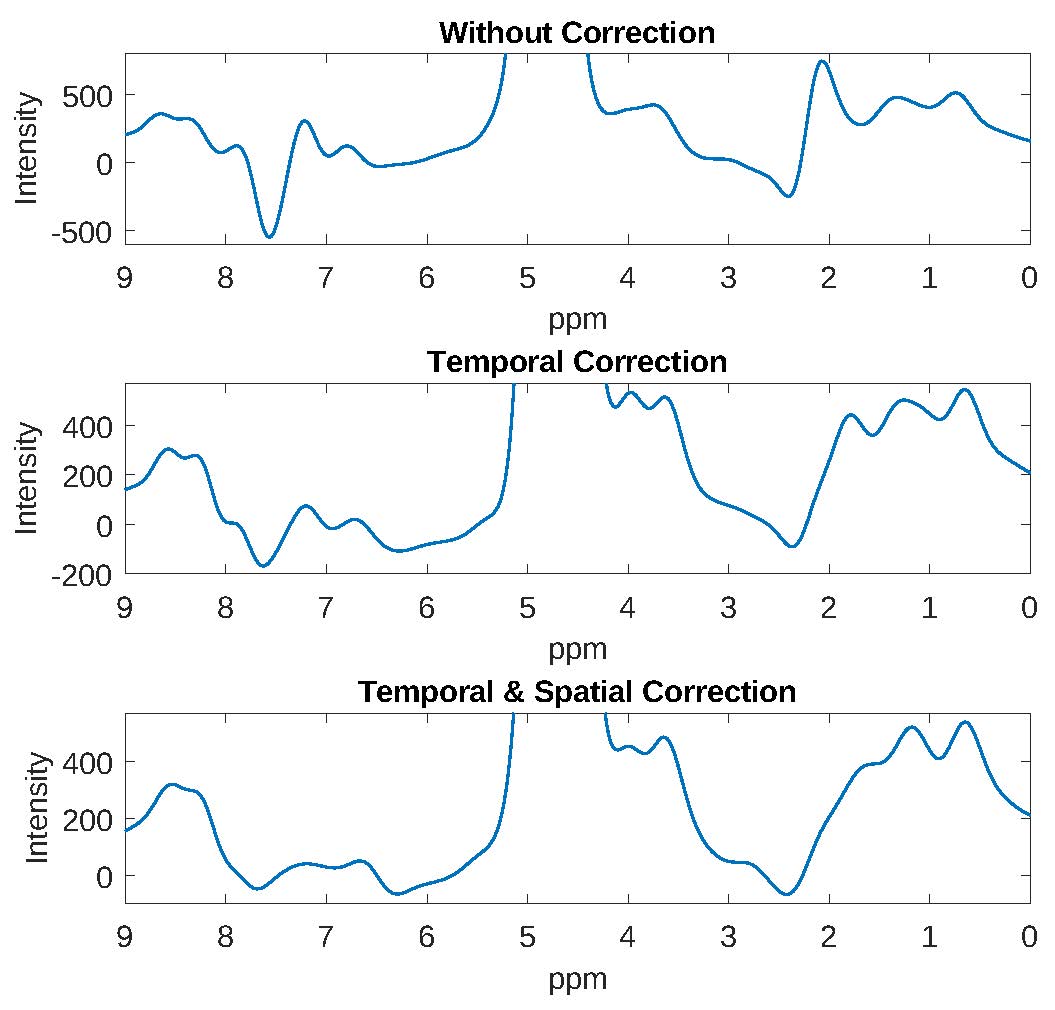
UTE-FID spectra (72 and 36 echo times) and the non-spatially selective pulse-acquire FID spectrum of a 50% collagen solution are depicted in Figure 1. Only minor deviations are present between the UTE-FID spectra with different numbers of temporal interleaves. A reduction of the measurement time to 12min would therefore be feasible for acquiring collagen spectra at 3T. Furthermore, the spectra calculated from the UTE images exhibit a signal pattern comparable to the non-spatially selective pulse-acquire FID spectrum. According to Wishart et al.5 the resonances between 0.5 and 2.5ppm in the spectra are attributable to the aliphatic protons of valine, hydroxyproline, proline and lysin. The resonances evident downfield of water agree with those found by Winkler et al.6 to disappear when the solvent is changed to D2O which is why their origin was assumed in exchangeable protons of amine, amide, and OH groups. The broader linewidths evident for the UTE-FID spectra are caused by the Gaussian filtering.The impact of the field drift correction steps is shown in Figure 2. Without correction, artefacts overlap the spectrum at 7-8ppm and 2-3ppm. Those almost completely vanish after the correction of temporal B0 field drift while only minor further improvement is received by correction of location-dependent drift.
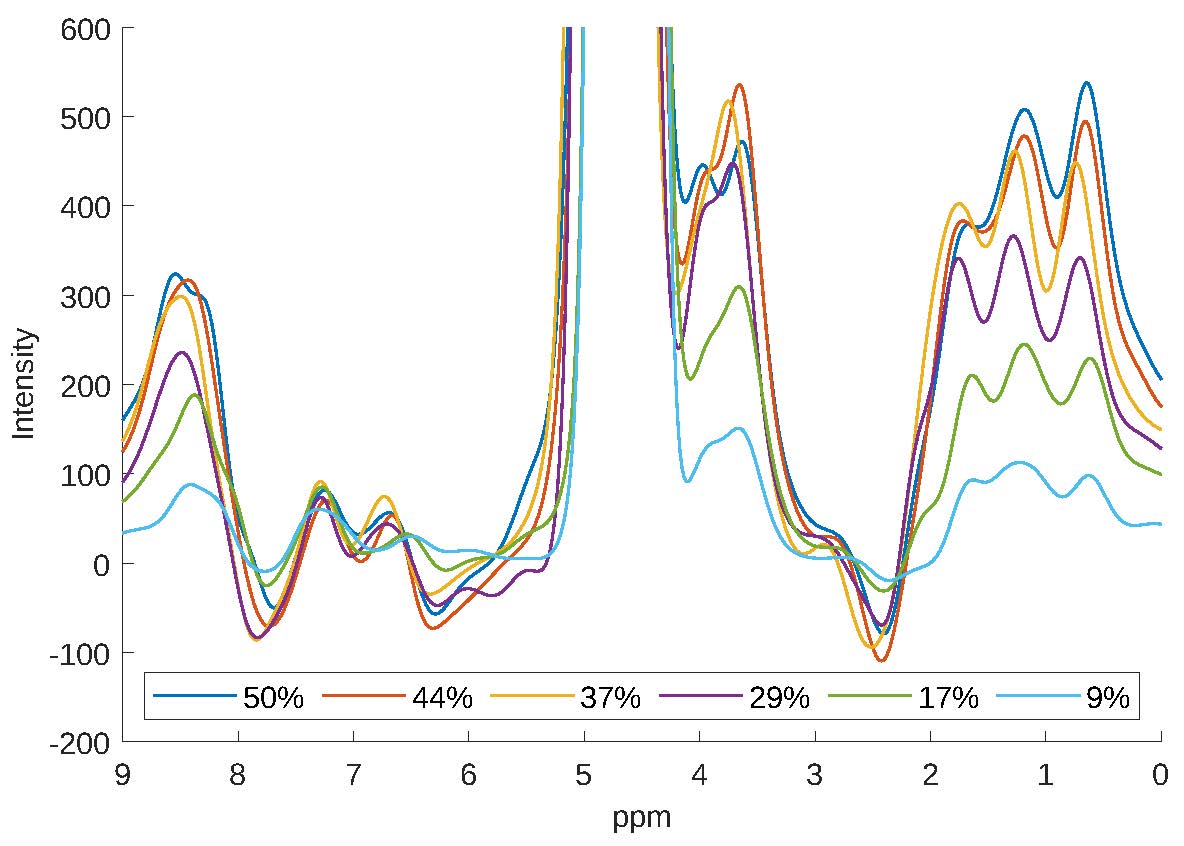
The collagen signal pattern correlates positively with the collagen concentration as visible in Figure 3 and is detectable for all concentrations (9-50%). Therefore, collagen content estimation is feasible based on the present approach.
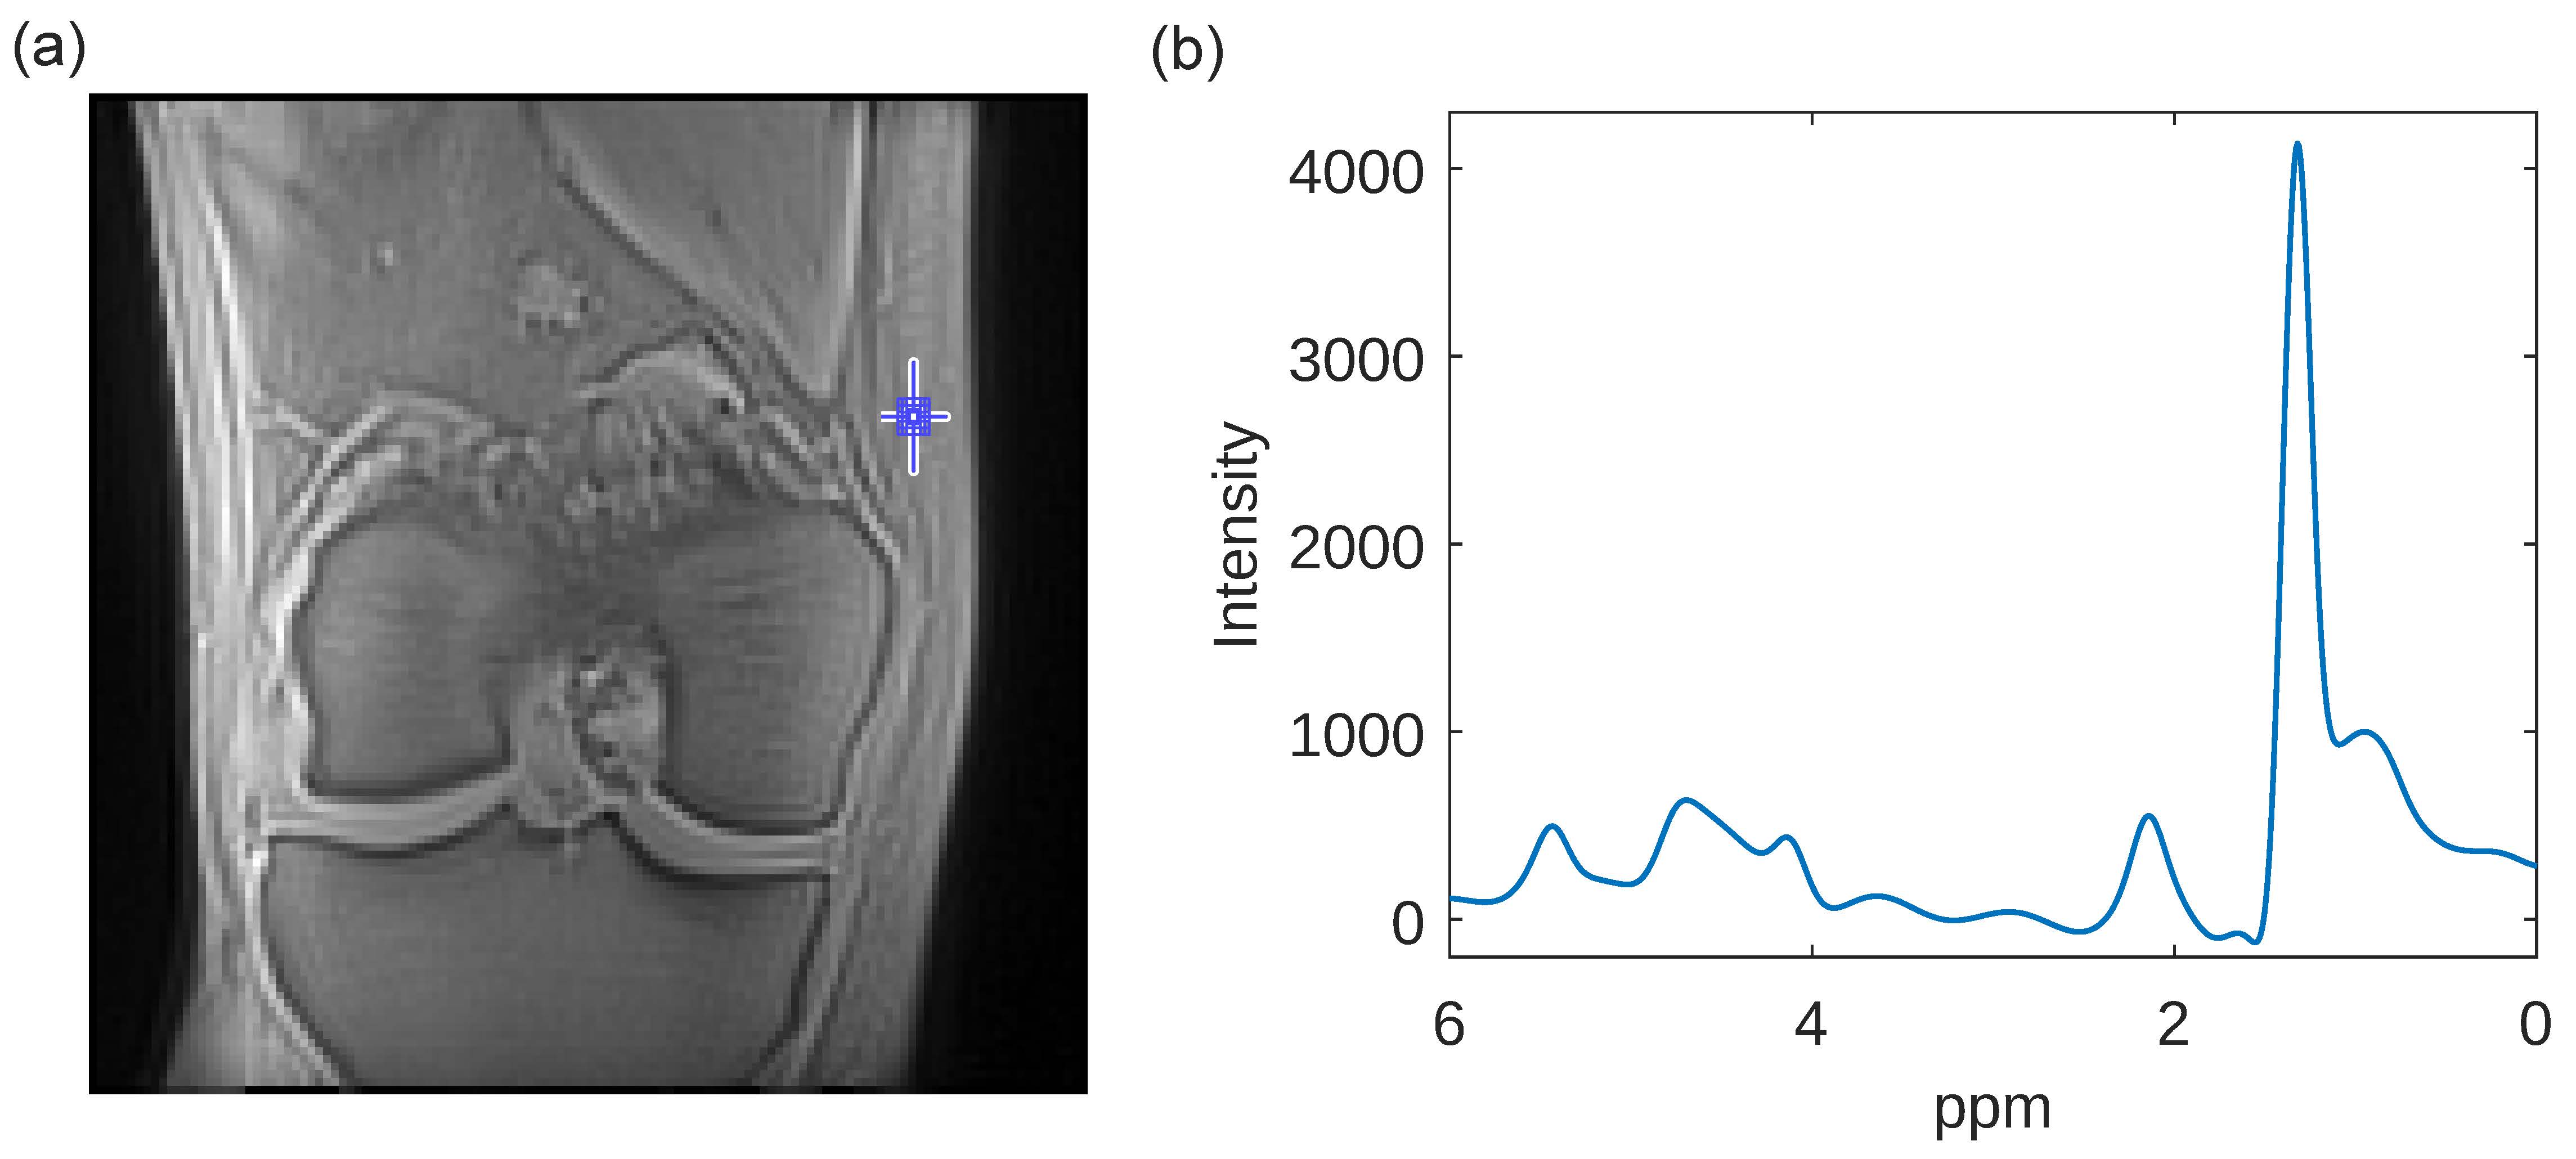
Figure 4a shows a UTE image of a healthy knee (TE=0.05ms) with a blue square indicating the ROI selected for calculation of a localized UTE-FID spectrum of the subcutaneous adipose tissue (Figure 4b). The resulting spectrum is comparable to known fat spectra and exhibits a dominant CH2 resonance at approximately 1.3ppm. Furthermore, the fat resonances of CH3 (~0.9ppm), glycerine (~4.1ppm) and vinyl (~5.4ppm) are visible. The allylic and α-methylene resonance merge to one line at 2.1ppm. Additionally, spectral lines at 4.7ppm and 2.9ppm are attributable to water and the diallylic fat resonance.
Discussion
The proposed UTE-FID spectroscopy represents a new approach to localized spectroscopy that is particularly sensitive to rapidly relaxing signals. However, one disadvantage is the significantly higher stress on the gradient system, requiring B0 field drift correction. The spatial encoding of fast relaxing signals by UTE sequences is also not optimal, since a large part of the spatial information is only read out with a longer delay after the RF excitation. Furthermore, with the UTE-FID approach, only a relatively short time range can be read out directly after the RF excitation when short TR are desired. Therefore, the time signals must be extrapolated for longer TD.Conclusion
The presented UTE-FID approach allows pixel-wise raw data acquisition similar to non-spatially selective pulse-acquire spectroscopy. Spatially resolved applications for assessment of spectra of rapidly decaying signals seem feasible.Acknowledgements
No acknowledgement found.References
1. Filho, Guinel H, et al. Quantitative characterization of the achilles tendon in cadaveric specimens: T1 and T2* measurements using ultrashort-TE MRI at 3T. American Journal of Roentgenology. Mar 2009, Vol. 192, 3, pp. W117-W124.
2. Bogner, W, et al. High-resolution mapping of human brain metabolites by free induction decay 1H MRSI at 7T. Journal of Magnetic Resonance. Jun 2012, Vol. 25, 6, pp. 873-882.
3. Nassirpour, Sahar, et al. Compressed sensing for high-resolution nonlipid suppressed 1H FID MRSI of the human brain at 9.4T. Magnetic Resonance in Medicine. Dec 2018, Vol. 80, 6, pp. 2311-2325.
4. Burg, John Parker. A new analysis technique for time series data. NATO advanced study Institute on Signal Processing with Emphasis on Underwater Acoustics. Enschede, Netherlands : s.n., Aug 12-23, 1968.
5. Wishart, D S, et al. HMDB 4.0 - The Human Metabolome Database for 2018. [Online] Nucleic Acids Res, Jan 2018. http://www.hmdb.ca/.
6. Behavior of the signal components of collagen solutions in vitro using UTE-MRI and MRS sequences. Winkler, Tobias, et al. Montreal : s.n., 2019. ISMRM 27th annual meeting and exhibition. #2258.
Figures