3537
Is tissue composition driving regional variation in neurometabolite levels?
Julie M Joyce1,2,3,4, Marilena DeMayo1,2,3,5,6, Chantel T Debert2,3,4,7, and Ashley D Harris1,2,3,4
1Department of Radiology, University of Calgary, Calgary, AB, Canada, 2Hotchkiss Brain Institute, University of Calgary, Calgary, AB, Canada, 3Alberta Children's Hospital Research Institute, University of Calgary, Calgary, AB, Canada, 4Integrated Concussion Research Program, University of Calgary, Calgary, AB, Canada, 5Department of Psychiatry, University of Calgary, Calgary, AB, Canada, 6Mathison Centre for Mental Health Research and Education, University of Calgary, Calgary, AB, Canada, 7Department of Clinical Neurosciences, University of Calgary, Calgary, AB, Canada
1Department of Radiology, University of Calgary, Calgary, AB, Canada, 2Hotchkiss Brain Institute, University of Calgary, Calgary, AB, Canada, 3Alberta Children's Hospital Research Institute, University of Calgary, Calgary, AB, Canada, 4Integrated Concussion Research Program, University of Calgary, Calgary, AB, Canada, 5Department of Psychiatry, University of Calgary, Calgary, AB, Canada, 6Mathison Centre for Mental Health Research and Education, University of Calgary, Calgary, AB, Canada, 7Department of Clinical Neurosciences, University of Calgary, Calgary, AB, Canada
Synopsis
Metabolite concentrations vary across brain regions. What remains unclear is the degree to which this variation is due to inherent regional differences or if it is driven by the composition of the underlying tissue. Using magnetic resonance spectroscopy, we show that apparent ‘regional differences’ in metabolite concentrations are driven by tissue composition for glutamate and glutathione. Furthermore, we provide evidence to suggest a need for a tissue correction for glutamate, glutathione and N-acetyl-aspartate that appropriately addresses differences in voxel gray matter and white matter content.
Introduction
Metabolite concentrations have been found to vary across different regions of the brain.1-3 However, for a majority of metabolites, it is not clear the degree to which this variation is due to inherent regional differences or if it is driven by tissue composition of the region studied. If metabolite levels differ across tissues, this can impact group comparisons of metabolites, as natural variation in tissue composition exists across individuals. To illustrate, it has been previously shown that levels of GABA (γ-aminobutyric acid) are approximately twice as high in gray matter (GM) than white matter (WM).4 To address this, Harris et al. introduced a GABA tissue correction factor known as the ‘alpha’ (α) correction to account for GABA concentration variation due to differing GM and WM content4, which can significantly impact results.5While an α correction factor has been published for GABA4, currently there are no equivalent correction factors for other commonly studied metabolites such as Glx (glutamate + glutamine), Glu (glutamate), tNAA (N-acetyl-aspartate + N-acetyl-aspartyl-glutamate), tCho (choline + glycerophosphocholine + phosphocholine), mIns (myo-inositol), tCr (creatine + phosphocreatine) and GSH (glutathione). There is evidence for GM/WM differences in some of these metabolites, for example glutamate is higher in GM6, 7 whereas N-acetyl-aspartyl-glutamate (NAAG) is higher in WM8, though correction factors have yet to be proposed. Here, we use conventional and edited magnetic resonance spectroscopy (MRS) to explore regional differences in metabolite levels, associations between metabolite levels and tissue content and how these factors interact.
Methods
Twenty-five participants (6M/19F) aged 24-62 years (mean = 44 ± 11) with no previous neurological history completed an MRS scan at 3T (MR750w, General Electric). As part of the imaging protocol, T1-weighted anatomical images were acquired for voxel placement and tissue segmentation (BRAVO; TR/TE = 7.30/2.66 ms, 1 mm3 isotropic voxels). For the MRS acquisitions, 3x3x3 cm3 voxels were placed in the anterior cingulate and right sensorimotor cortices (Figure 1).Glx, Glu, tNAA, tCho, mIns and tCr were measured using a short echo Point Resolved Spectroscopy (PRESS) sequence (TR/TE = 2000/35 ms, 64 averages). PRESS data was preprocessed in FID-A9 and quantified using LCModel10 with custom basis sets.
GABA and GSH data were acquired using a Hadamard Encoding and Reconstruction of MEGA-Edited Spectroscopy (HERMES) spectral editing scheme: TR/TE = 2000/80 ms, 320 averages. Twenty millisecond editing pulses were applied at 4.56 ppm and 1.9 ppm. HERMES data were preprocessed and analyzed using Gannet3.1.11
Voxel tissue segmentation was performed using the Gannet3.1 toolbox.11 PRESS and HERMES data were tissue-corrected using the Gasparovic method accounting for cerebrospinal fluid (CSF) content, tissue- and metabolite-specific T1, T2 relaxation and water visibility.12 Additionally, GABA was α-corrected using methods previously established by Harris et al.4
Paired sample t-tests compared metabolite concentrations between brain regions. For all metabolites with no established α factor (GSH, Glx, Glu, tNAA, tCho, mIns and tCr):
- Pearson’s correlation was used to examine the relationship between GM tissue fraction (fGM/(fGM + fWM)) and metabolite concentration.
- Multiple linear regression was conducted using region and GM tissue fraction as factors to predict metabolite concentration.
Results
Paired samples t-tests revealed higher concentrations of Glx, Glu, tCho, mIns and GSH and lower α-corrected GABA in the ACC relative to the RSM. tNAA and tCr concentrations did not differ between regions (Figure 3).Pearson’s correlations revealed significant positive associations between GM tissue fraction and concentrations of GSH, Glx and Glu. tNAA, tCho, mIns and tCr were not significantly associated with GM tissue fraction, although tNAA approached statistical significance (p = 0.074) (Figure 4).
Multiple linear regression analyses revealed that brain region was a significant predictor of tCho and mIns concentrations, while GM tissue fraction significantly predicted Glu, tNAA and GSH concentrations. Neither brain region nor GM tissue fraction significantly predicted Glx and Cr levels (Table 1).
Discussion
Our analysis suggests that voxel tissue composition should be considered when measuring concentrations of Glu, GSH and tNAA which all showed a strong dependency on GM content. Currently, there are conflicting reports as to whether GSH levels differ in GM and WM.1, 13, 14 Our data suggests that GSH content is higher in GM and is negligeable in voxels composed of <10-20% GM.Regional differences in concentrations of tCho, mIns and GABA were found independent of tissue content suggesting that not all regional differences can be attributed to variation in voxel tissue composition.
The relationship between Glu and GM fraction, but not region, is consistent with previous work by Zhang et al.7 A lack of significant association between Glx and GM content was surprising given the dependency of Glu concentration on GM content. However, as Glx is a combined signal (glutamate + glutamine) this may reflect that glutamine concentrations do not vary greatly with GM content.
Conclusion
We conclude that higher tCho and mIns are present in the anterior cingulate relative to the sensorimotor cortex and this disparity is not driven by GM content. In contrast, apparent regional differences in Glu and GSH concentrations were driven by GM content. Our findings suggest the need for an α correction to be applied to Glu, GSH and tNAA concentrations to account for differences in tissue composition.Acknowledgements
We would like to acknowledge the efforts of Leah Mercier, Mehak Stokoe, Amanda Ip and Julia Batycky in data collection for this project. Additionally, we thank the Harris Imaging Lab team for their ongoing support and feedback. Research was supported by the New Frontiers in Research Fund, Foundations of Physical Medicine and Rehabilitation Grant, Hotchkiss Brain Institute PFUND Grant and Alberta Graduate Excellence Scholarship.References
- Ganji SK, et al. Measurement of regional variation of GABA in the human brain by optimized point-resolved spectroscopy at 7 Tin vivo. NMR Biomed. 2014;27(10): p. 1167-1175.
- Bracken BK, et al. Brain metabolite concentrations across cortical regions in healthy adults. Brain Res. 2011. 1369: p. 89-94.
- Baker EH, et al. Regional apparent metabolite concentrations in young adult brain measured by1H MR spectroscopy at 3 Tesla. J Magn Reson Imaging. 2008;27(3): p. 489-499.
- Harris AD, Puts NA, and RA Edden. Tissue correction for GABA-edited MRS: Considerations of voxel composition, tissue segmentation, and tissue relaxations. J Magn Reson Imaging. 2015;42(5): p. 1431-1440.
- Porges EC, et al. Impact of tissue correction strategy on GABA-edited MRS findings. Neuroimage. 2017;162: p. 249-256.
- Goryawala MZ, Sheriff S and AA Maudsley. Regional distributions of brain glutamate and glutamine in normal subjects. NMR Biomed. 2016;29(8): p. 1108-1116.
- Zhang Y and J Shen. Regional and tissue-specific differences in brain glutamate concentration measured by in vivo single voxel MRS. J Neurosci Methods. 2015;239: p. 94-99.
- Choi C, et al. Measurement of N -acetylaspartylglutamate in the human frontal brain by 1 H-MRS at 7 T. Magn Reson Med. 2010;64(5): p. 1247-1251.
- Simpson R, et al. Advanced processing and simulation of MRS data using the FID appliance (FID-A)—An open source, MATLAB-based toolkit. Magn Reson Med, 2017;77(1): p. 23-33.
- Provencher SW. Estimation of Metabolite Concentrations from Localized in Vivo Proton NMR Spectra. Magn Reson Med. 1993;30: p. 672-679.
- Edden RA, et al., Gannet: A batch-processing tool for the quantitative analysis of gamma-aminobutyric acid-edited MR spectroscopy spectra. J Magn Reson Imaging. 2014;40(6): p. 1445-1452.
- Gasparovic C, et al. Use of tissue water as a concentration reference for proton spectroscopic imaging. Magnetic Resonance in Medicine. 2006;55(6): p. 1219-1226.
- Srinivasan R, et al. MR spectroscopic imaging of glutathione in the white and gray matter at 7 T with an application to multiple sclerosis. Magn Reson Imaging. 2010;28(2): p. 163-170.
- An L, et al. Detection of glutamate, glutamine, and glutathione by radiofrequency suppression and echo time optimization at 7 tesla. Magn Reson Med. 2015;73(2): p. 451-458.
Figures
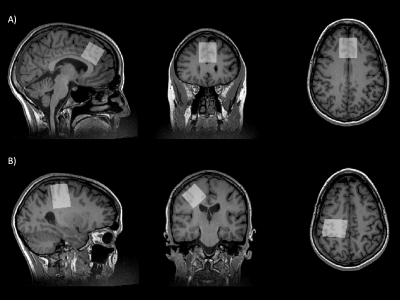
Figure 1. Example voxel placement in the (A) anterior cingulate cortex and (B) right sensorimotor cortex. All voxels were placed manually using the motor hand knob as a landmark for the sensorimotor cortex and the corpus callosum to position the voxel in the anterior cingulate cortex.
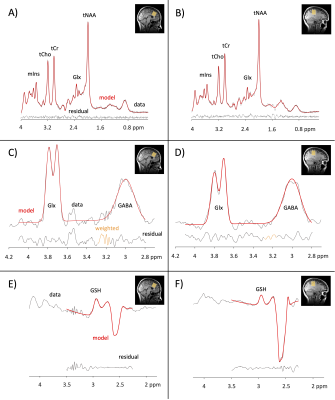
Figure 2. Example PRESS spectra and HERMES subspectra in the anterior cingulate (left column) and right sensorimotor cortex (right column). PRESS – A,B; HERMES (GABA) – C,D; HERMES (GSH) – E,F. PRESS = point resolved spectroscopy; HERMES = Hadamard Encoding and Reconstruction of MEGA-edited spectroscopy.
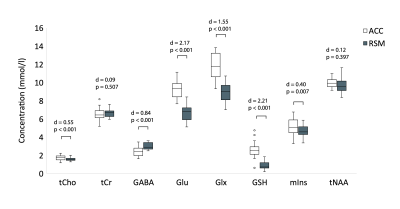
Figure 3. Paired t-test results examining regional differences in metabolite levels. Effect sizes (Cohen’s d) and p-values are reported. All metabolite concentrations presented were corrected for CSF content, tissue- and metabolite-specific T1, T2 relaxation and water visibility. Additionally, GABA concentrations were further corrected for tissue composition using the α correction described by Harris et al.4 ACC = anterior cingulate; RSM = right sensorimotor.
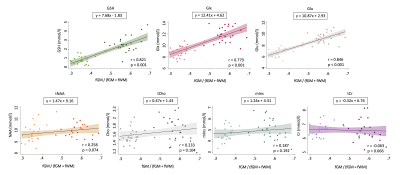
Figure 4. Pearson’s correlation analysis results examining the association between metabolite concentration and GM tissue content. GM tissue content was defined as fGM/(fGM + fWM). fGM = Gray matter fraction; fWM = White matter fraction. Anterior cingulate (dark dots) and right sensorimotor motor (light dots) data were pooled for this analysis.
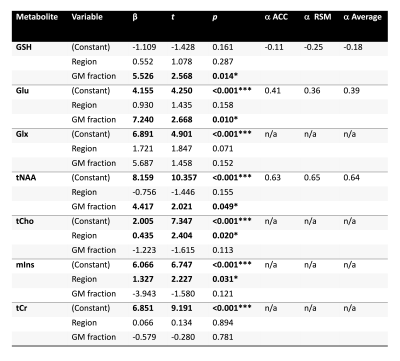
Table 1. Multiple linear regression results examining region and GM content as predictors of metabolite concentration. GM tissue content was defined as fGM/(fGM + fWM). fGM = Gray matter fraction; fWM = White matter fraction. Proposed α correction factors were calculated for metabolites that were significantly predicted by GM fraction using methods described in Harris et al.4 α corrections were calculated independently for the anterior cingulate (ACC) and right sensorimotor (RSM) and pooled for the proposed ‘average’ α.
DOI: https://doi.org/10.58530/2022/3537