3536
Using Strong Coupling Effect to Increase Signal Strength of Glutamate, Glutamine, and Glutathione at 7 T1National Institute of Mental Health, National Institutes of Health, Bethesda, MD, United States
Synopsis
Unlike weakly coupled spin systems, the signal strength of Glu H4, Gln H4, and GSH glutamyl H4 is affected by the timing of refocusing pulses for a fixed total TE. Using full density matrix simulations, it was found that glutamate H4, glutamine H4, and glutathione glutamyl H4 peak amplitudes can be significantly increased by shortening the echo time of the first spin echo (TE1) in PRESS from a previously reported 69 ms to 16 ms. The improved sequence was tested in vivo and validated using Monte Carlo simulations.
INTRODUCTION
Glutamate (Glu) and glutamine (Gln) play important roles in glutamatergic neurotransmission. Glutathione (GSH) is a marker of oxidative stress. In vivo measurement of Glu, Gln, and GSH using MRS is often hampered by overlapping resonance signals. At 7 T, the Glu, Gln, and GSH glutamyl H4 protons were observed to form intense pseudo singlets at TE of 100 - 110 ms 1. At such TE values, macromolecule signals are also dramatically reduced compared to short TE, which is important for reliable quantification of metabolite concentrations. A PRESS sequence with TE = 106 ms (TE1 = 69 ms) and an always-on J-suppression RF pulse inserted between the two 180° refocusing RF pulses has been used to measure Glu, Gln, and GSH at 7 T 2. Since Glu, Gln and GSH signals are still strongly coupled at 7 T, their spectral pattern depends on the timing of the 180° refocusing pulses even when total TE is fixed. In this work, we demonstrate that Glu, Gln, and GSH glutamyl H4 peak amplitudes can be significantly increased by shortening TE1 such that higher precisions or reduced scan time can be achieved for measuring these metabolites.METHODS
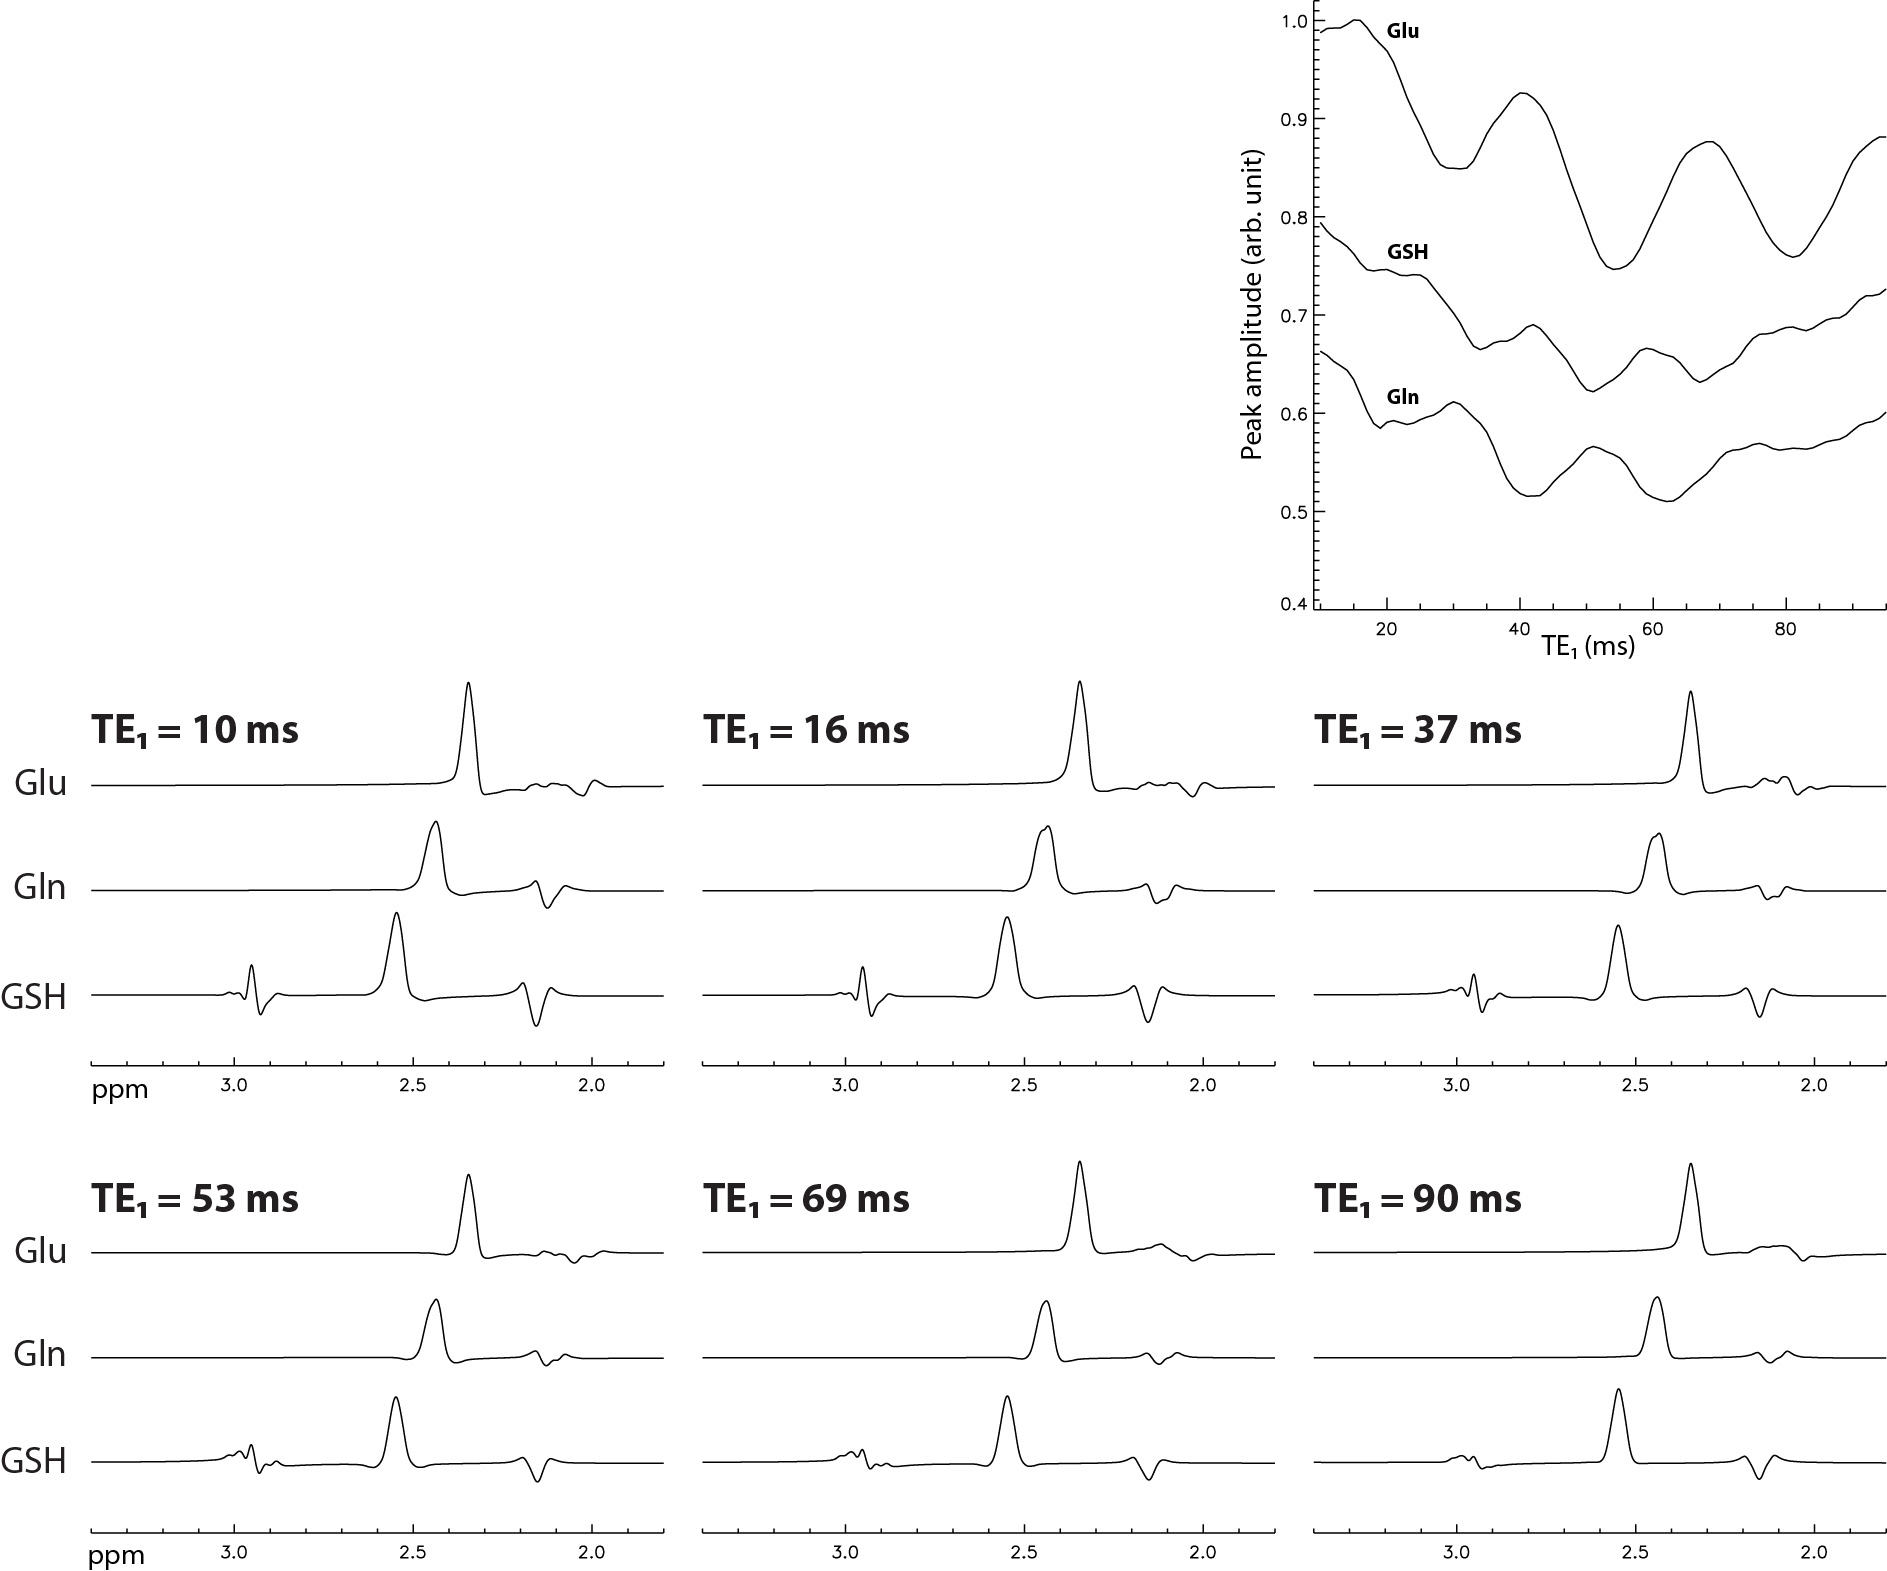
Density matrix simulations were used to compute the basis spectra of Glu, Gln, and GSH using a fixed TE of 106 ms 2 and 86 different TE1 values in the range of 10 – 95 ms with 1 ms increment to evaluate the effect of TE1 on Glu, Gln, and GSH peak amplitudes. The J-suppression RF pulse did not affect the Glu, Gln, and GSH resonance signals since it was applied at 4.38 ppm. After the optimal TE1 was found based on the peak amplitudes of Glu, Gln, and GSH, the flip angle and location of the J-suppression pulse were adjusted to minimize the NAA aspartyl resonance signals at ~ 2.48 ppm.The numerically optimized pulse sequence was tested using a Siemens Magnetom 7 T scanner. The reconstructed in vivo spectrum was fitted in the range of 1.8 – 3.4 ppm by a linear combination of numerically computed basis functions of 13 metabolites and a cubic spline baseline. Monte Carlo simulations were performed to evaluate the precision of measured Glu, Gln, and GSH. The in vivo concentrations, linewidth, and lineshape of the 13 metabolites were used to combine the basis functions of the 13 metabolites to generate noise-free FIDs. Random Gaussian noise with the same noise level as in vivo data was added to ground truth spectra. Numerically simulated spectra were analyzed using the same fitting routine. The process of generating the noise-added spectra and subsequent quantification were repeated 1000 times with each repetition using a different realization of the random noise.
RESULTS
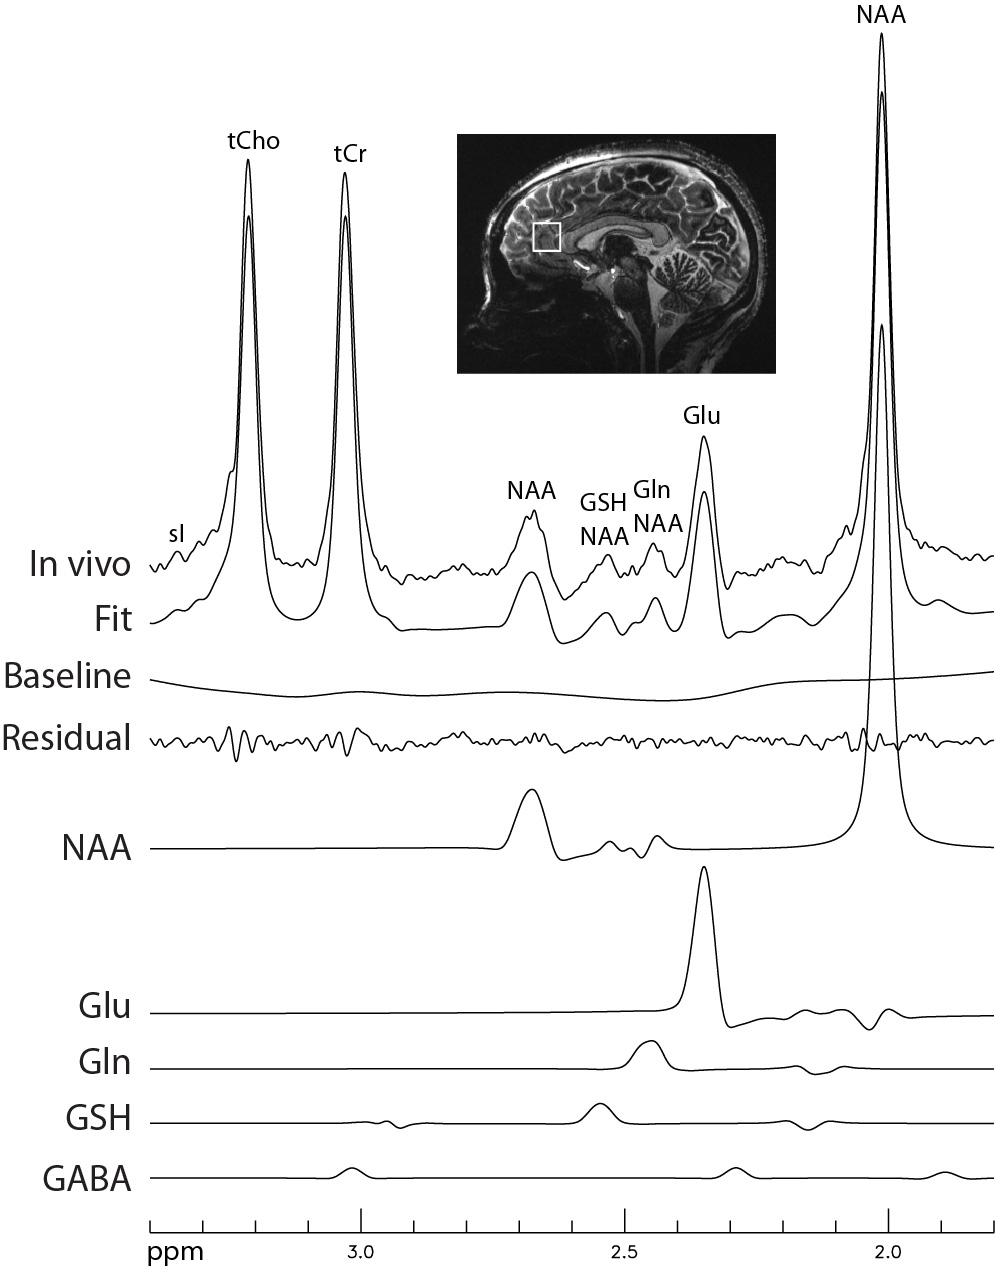
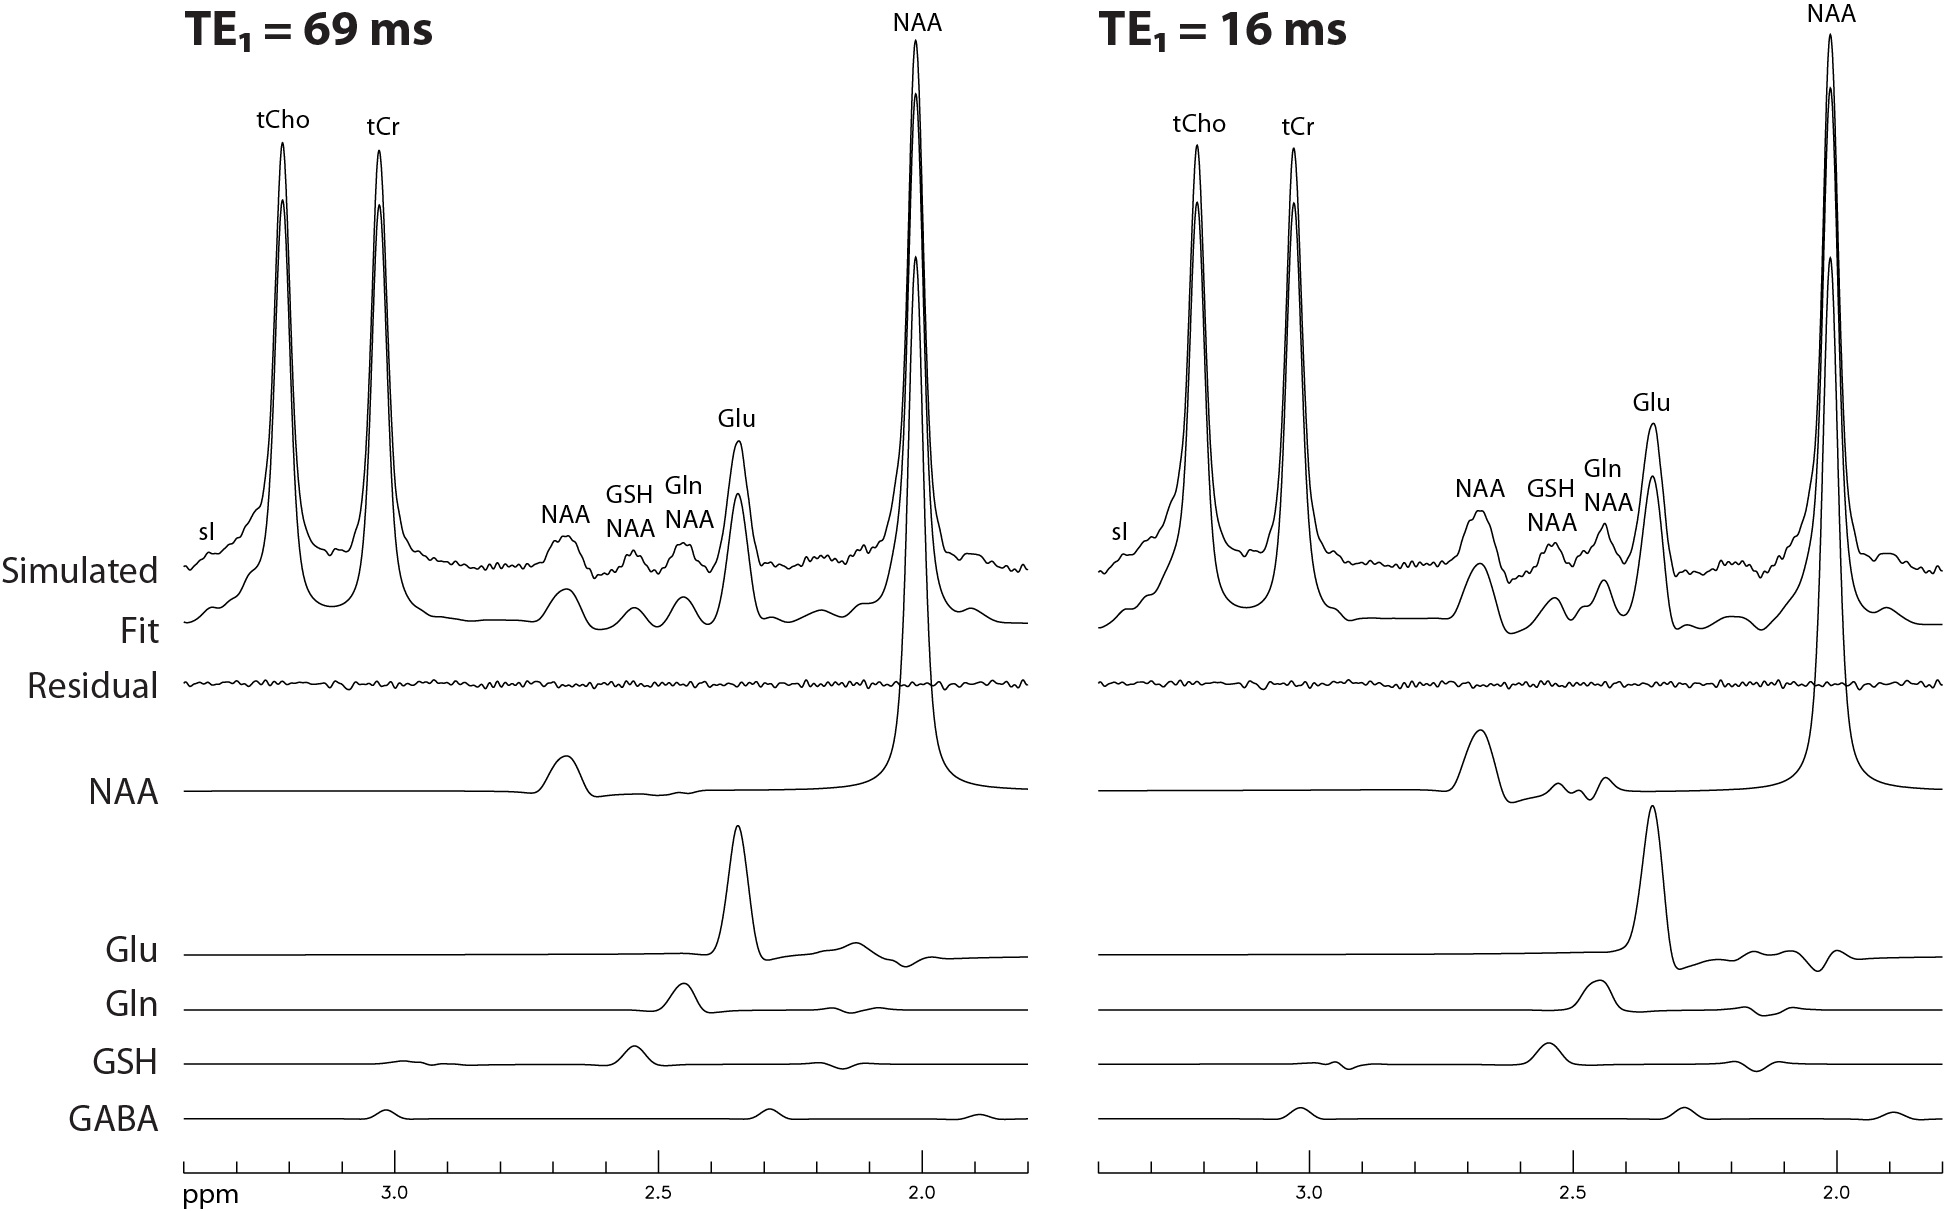
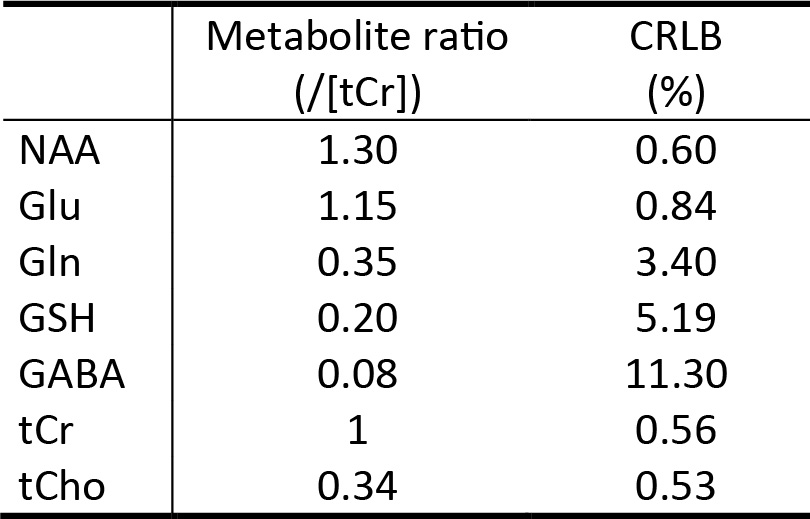
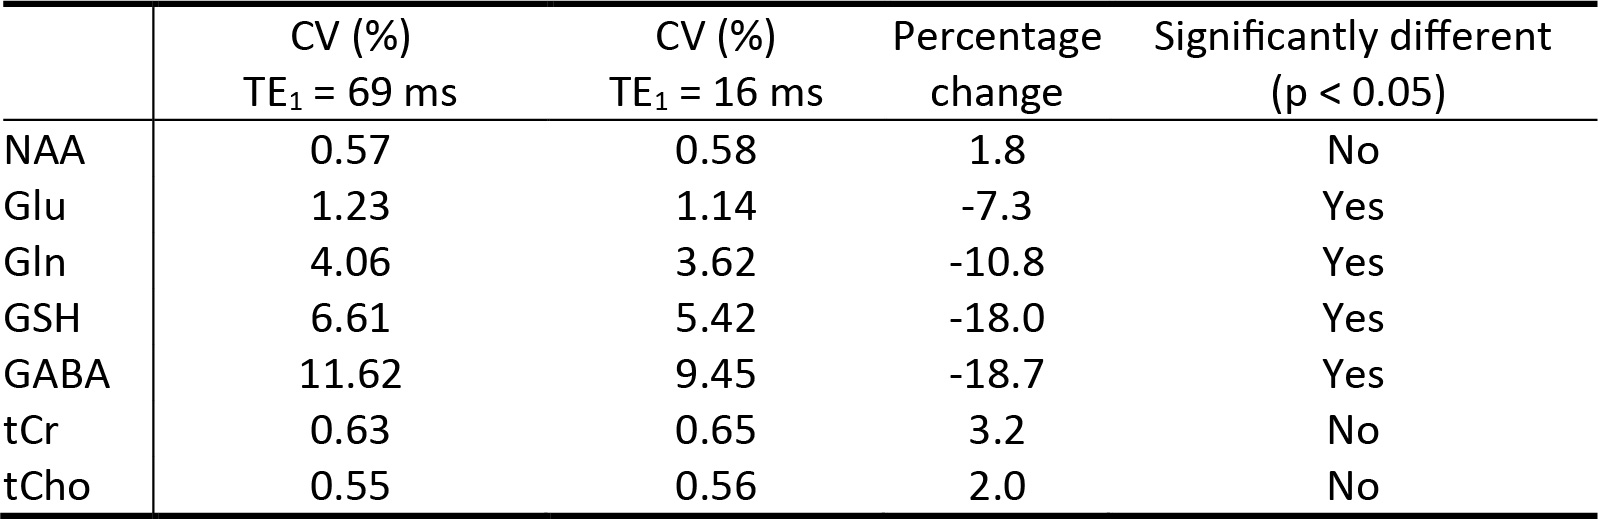
Figure 1 displays the numerically computed spectra of Glu, Gln, and GSH at six selected TE1s. Figure 1 also displays a plot of Glu, Gln, and GSH peak amplitudes vs TE1, which shows that the Glu peak reaches maximum at TE1 = 16 ms and the Gln and GSH peaks keep increasing when TE1 becomes shorter than 16 ms. However, the shortest allowable TE1 using a 4.5-ms excitation pulse, 8-ms slice-refocusing pulses, and 2.6-ms crusher gradients 2 was 16 ms. Therefore, TE1 = 16 ms was used for in vivo validation. Figure 2 displays the in vivo spectrum acquired from the medial prefrontal cortex of a patient with major depression using TE1 = 16 ms. Figure 3 displays the simulated spectra and corresponding fits for one of the 1000 repetitions in the Monte Carlo simulations. From the fitted NAA spectra in Figure 3, a larger NAA aspartyl signal at ~2.48 ppm was observed than the spectrum acquired with TE1 = 69 ms 2. Table 1 lists the in vivo metabolite ratios (/[tCr]). Table 2 lists coefficient of variation (CV) values of metabolite concentrations obtained from Monte Carlo simulations. Compared to TE1 = 69 ms, CV values for TE1 = 16 ms was reduced by 7.3% for Glu, 10.8% for Gln, and 18.0% for GSH.DISCUSSION AND CONCLUSION
The timing of spectrally nonselective refocusing pulses in PRESS affects the outcome of strongly coupled spins because the 180° pulse operators do not commute with strong coupling terms in the nuclear spin Hamiltonian. At 7T, the scalar coupling constant/chemical shift difference (J/Δν) between the two methylene protons of Glu H4, Gln H4, and GSH glutamyl H4 is 3.8, 2.4, and 2.4, respectively. Significant strong coupling effect also exists between their H3 and H4 protons. The peak amplitude vs. TE1 curves show that significantly higher signal amplitude for all three metabolites can be achieved by shortening TE1 from 69 ms 2 to 16 ms. Monte Carlo simulations showed that CV values were reduced with TE1 = 16 ms compared to TE1 = 69 ms, which translates to scan time reduction of 14% for Glu, 22% for Gln, and 33% for GSH to achieve the same signal-to-noise ratio (SNR). In conclusion, the strong coupling effect of Glu, Gln, and GSH at 7T can be utilized to increase their MRS detectability by shortening TE1 in PRESS while maintaining their singlet-like narrow lineshape and minimizing the aspartyl signal of NAA by J-suppression.Acknowledgements
This study was supported by the Intramural Research Program of the National Institute of Mental Health, National Institutes of Health (IRP-NIMH-NIH).References
1. Choi CH, Dimitrov IE, Douglas D, Patel A, Kaiser LG, Amezcua CA, Maher EA. Improvement of resolution for brain coupled metabolites by optimized H-1 MRS at 7 T. Nmr in Biomedicine 2010;23(9):1044-1052.
2. An L, Li S, Murdoch JB, Araneta MF, Johnson C, Shen J. Detection of glutamate, glutamine, and glutathione by radiofrequency suppression and echo time optimization at 7 tesla. Magnetic resonance in medicine 2015;73:451-458.
Figures