3535
Rapid Whole Brain High-Resolution MR Spectroscopic Imaging at 7T1Department of Electrical and Computer Engineering, University of Illinois at Urbana-Champaign, Urbana, IL, United States, 2Beckman Institute for Advanced Science and Technology, University of Illinois at Urbana-Champaign, Urbana, IL, United States, 3Siemens Medical Solutions, Inc., Urbana, IL, United States, 4Department of Bioengineering, University of Illinois at Urbana-Champaign, Urbana, IL, United States
Synopsis
Metabolic imaging of the whole brain is desirable in many neuroscience studies and some clinical applications. This work demonstrates whole-brain MRSI (FOV = 240×240×160 mm3) at 7T using a special SPICE-based data acquisition and processing scheme. Experimental results showed that whole brain metabolic imaging at 3.0×3.0×3.2 mm3 resolution could be obtained in an 8-minute scan at 7T.
Introduction
The ability to detect metabolic alterations over the whole brain has many potential applications1,2. After decades of development, several MRSI methods have emerged for metabolic imaging of the whole brain, but these methods still require long scan time (more than 15 minutes) or offer relatively low spatial resolution3-5. Recently, rapid high-resolution MRSI has been demonstrated using SPICE, but with a limited brain coverage (60 mm thickness excitation slab)6-8.Implementing whole brain MRSI at 7T has several practical challenges: (1) increased spectral bandwidth at 7T limits the achievable readout resolution of fast spatiotemporal trajectories; (2) whole brain coverage requires a larger number of spatial encodings, leading to longer scan time; (3) more challenging B0 and B1 inhomogeneity issue; and (4) increased SAR limits the number of pulses to be used. In this work, we demonstrated that these issues can be well addressed using a special SPICE-based data acquisition and processing scheme. Experimental results demonstrated that the proposed method could achieve whole brain (FOV = 240×240×160 mm3) metabolic imaging at 3.0×3.0×3.2 mm3 nominal resolution in an 8-minute scan at 7T.
Methods
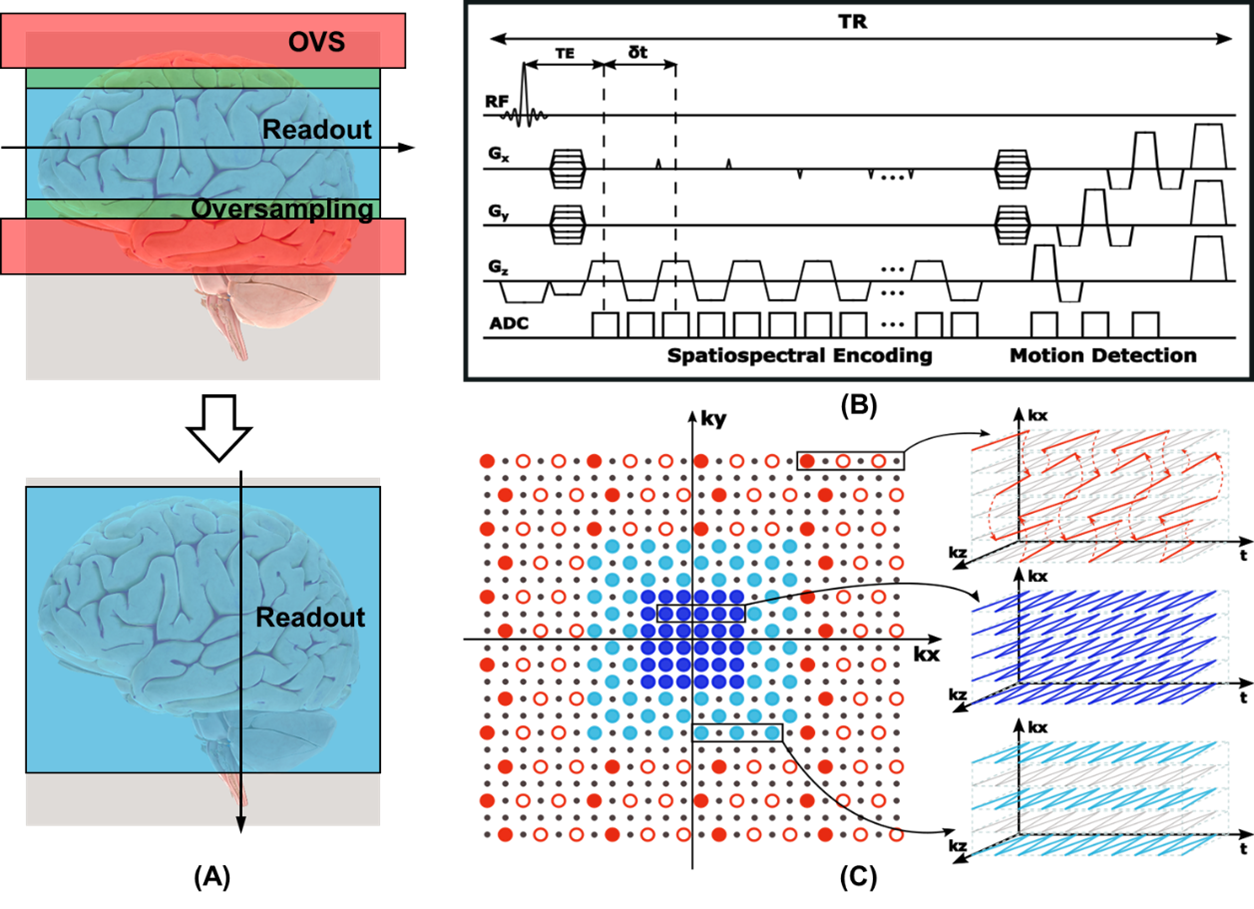
The proposed data acquisition scheme has several unique features to enable whole-brain high-resolution MRSI, as illustrated in Fig. 1. First, the EPSI readout is placed in the slice direction to provide better bandwidth-resolution tradeoff given the fewer encodings in the slice direction. Compared with in-plane readout, readout in the slice direction can avoid signal aliasing in the slice direction given the default readout oversampling. Therefore, OVS bands and additional oversampling required in existing MRSI data acquisition schemes can be removed (as shown in Fig. 1(a)), resulting in reduced SAR, shorter TR, and higher efficiency. Besides, given the relatively large spatial variations along the x and y directions of phased array coils, both phase encoding directions (kx, ky) can now benefit from parallel imaging. Second, (k, t)-space is sparsely sampled with variable density for acceleration, as shown in Fig. 1(c). More specifically, the central region of (k, t)-space is fully sampled both spatially and temporally; the middle region of (k, t)-space is fully sampled temporally but under-sampled by a factor of 2 in both the kx and ky directions; the outer region of (k, t)-space (for water/lipid signals) is sampled more sparsely with an acceleration factor of 2 in each spatial direction and a factor of 20 sub-sampling temporally. Both spatially and temporally sparse sampling follow CAIPIRINHA pattern to reduce aliasing and noise amplification9. Third, conventional water suppression pulses are eliminated thus enabling B0 and B1 correction using the unsuppressed water signals. In our implementation, whole brain (FOV = 240×240×160 mm3) metabolite signals at 3.0×3.0×3.2 mm3 and water signals at 2.0×2.0×3.2 mm3 resolution were acquired in an 8-minute scan. Other parameters included: TR = 150 ms, TE = 1.6 ms, echo-space = 0.9 ms, echo number = 140×2, flip angle = 26˚ (Ernst angle). To demonstrate the feasibility of the proposed method, both phantom and in vivo experiments were performed on a 7T system (Siemens Healthcare, Erlangen, Germany).In data processing, GRAPPA reconstruction was first performed on the first a few echoes; then sensitivity maps were estimated from the GRAPPA results and used for SENSE reconstruction10,11. The remaining processing procedure followed the SPICE processing pipeline for reconstruction and removal of the water and lipid signals, reconstruction of metabolite signals, and spectral quantification12-14. The B0 and B1 effects were corrected using B0 field map and B1 weighting map estimated from the unsuppressed water signals using HSVD fitting and spatial polynomial fitting, respectively.
Results
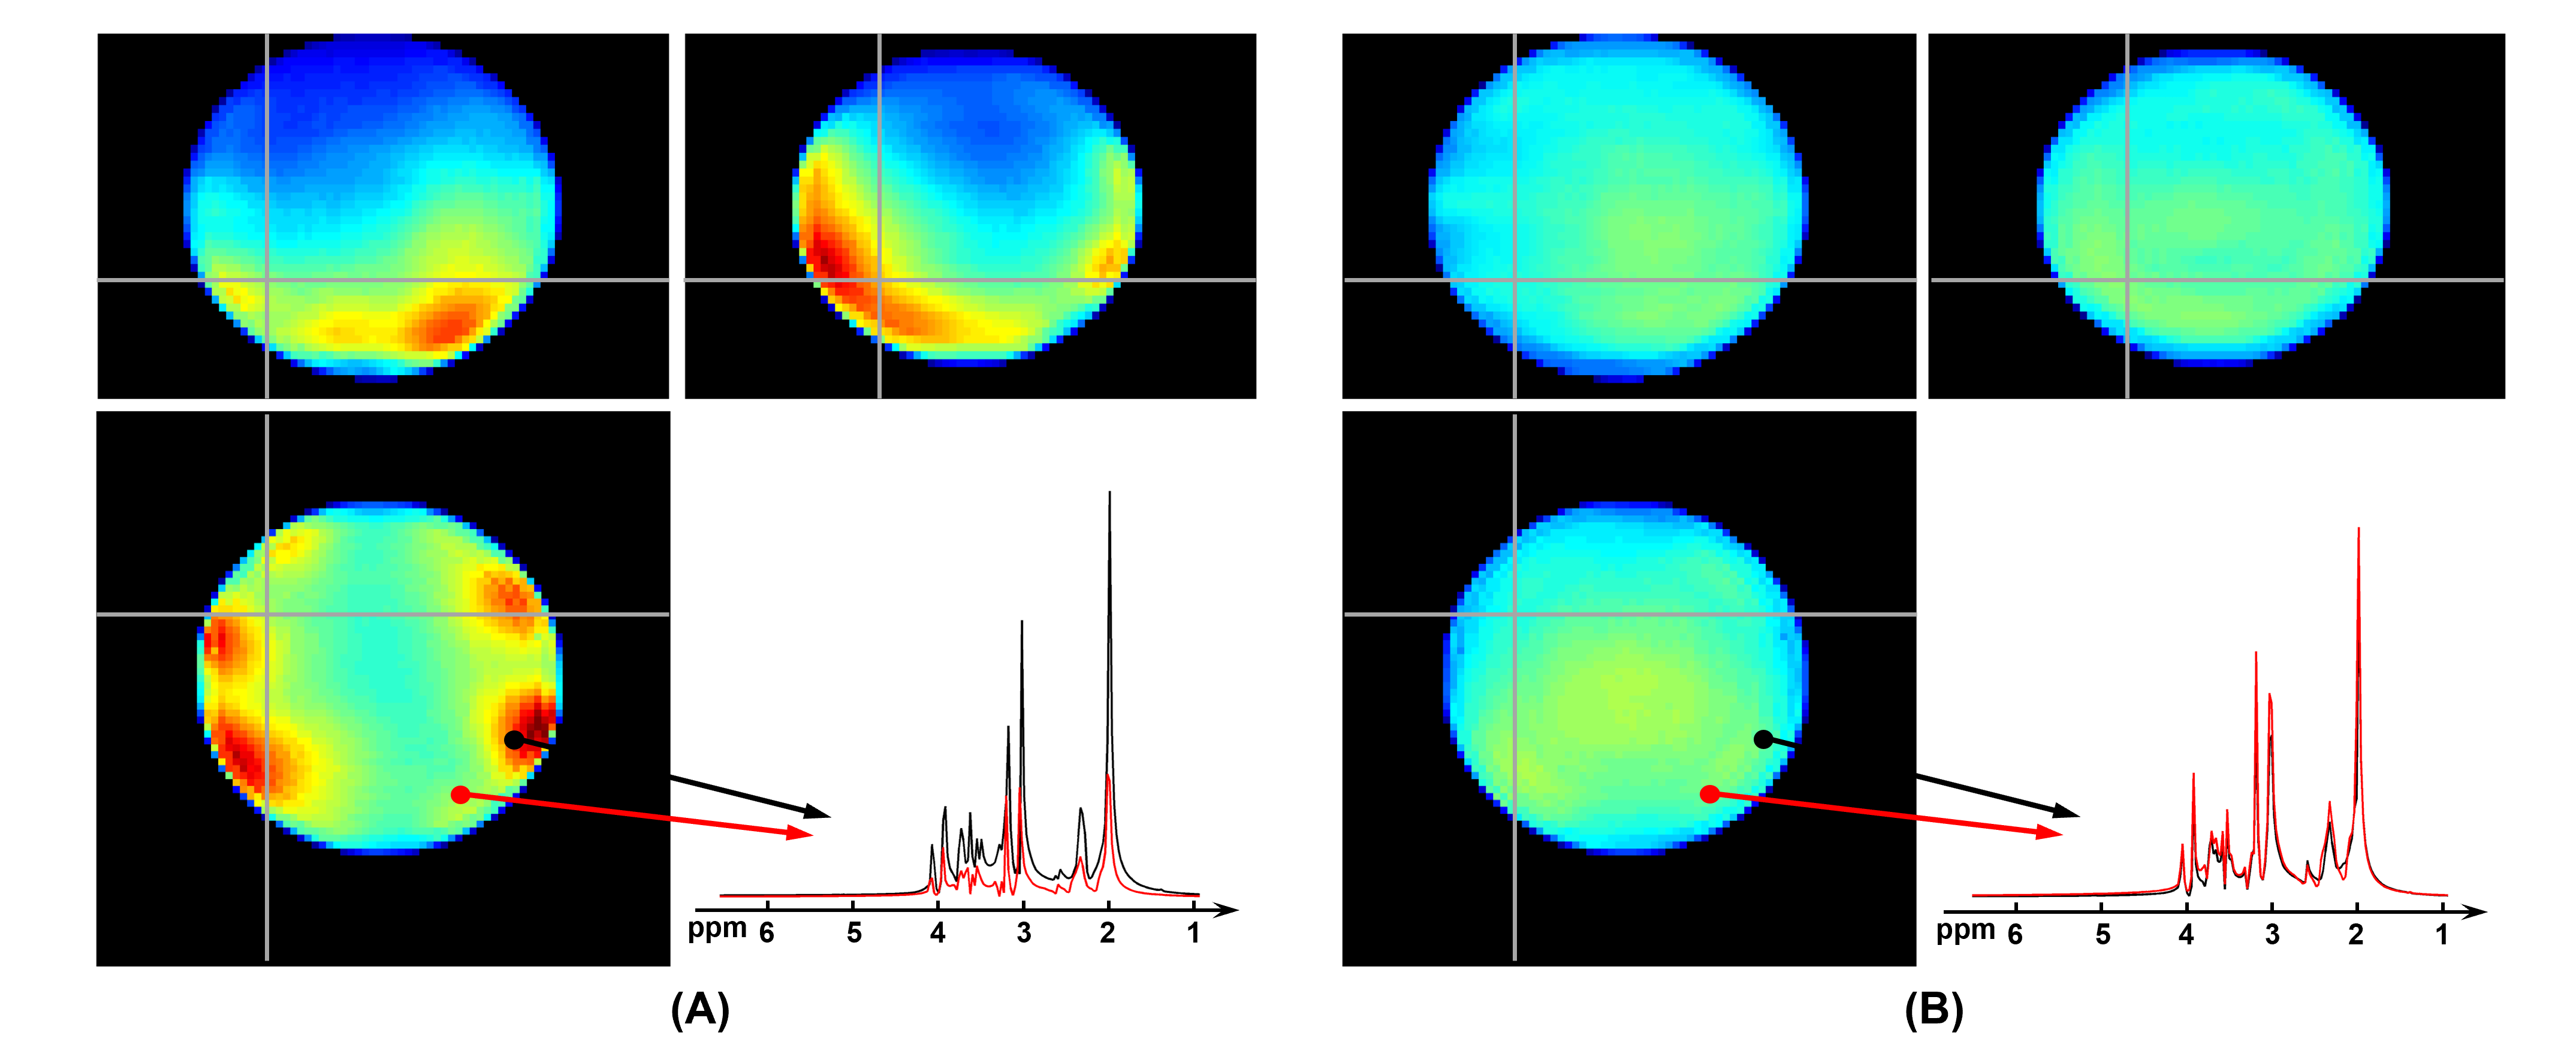
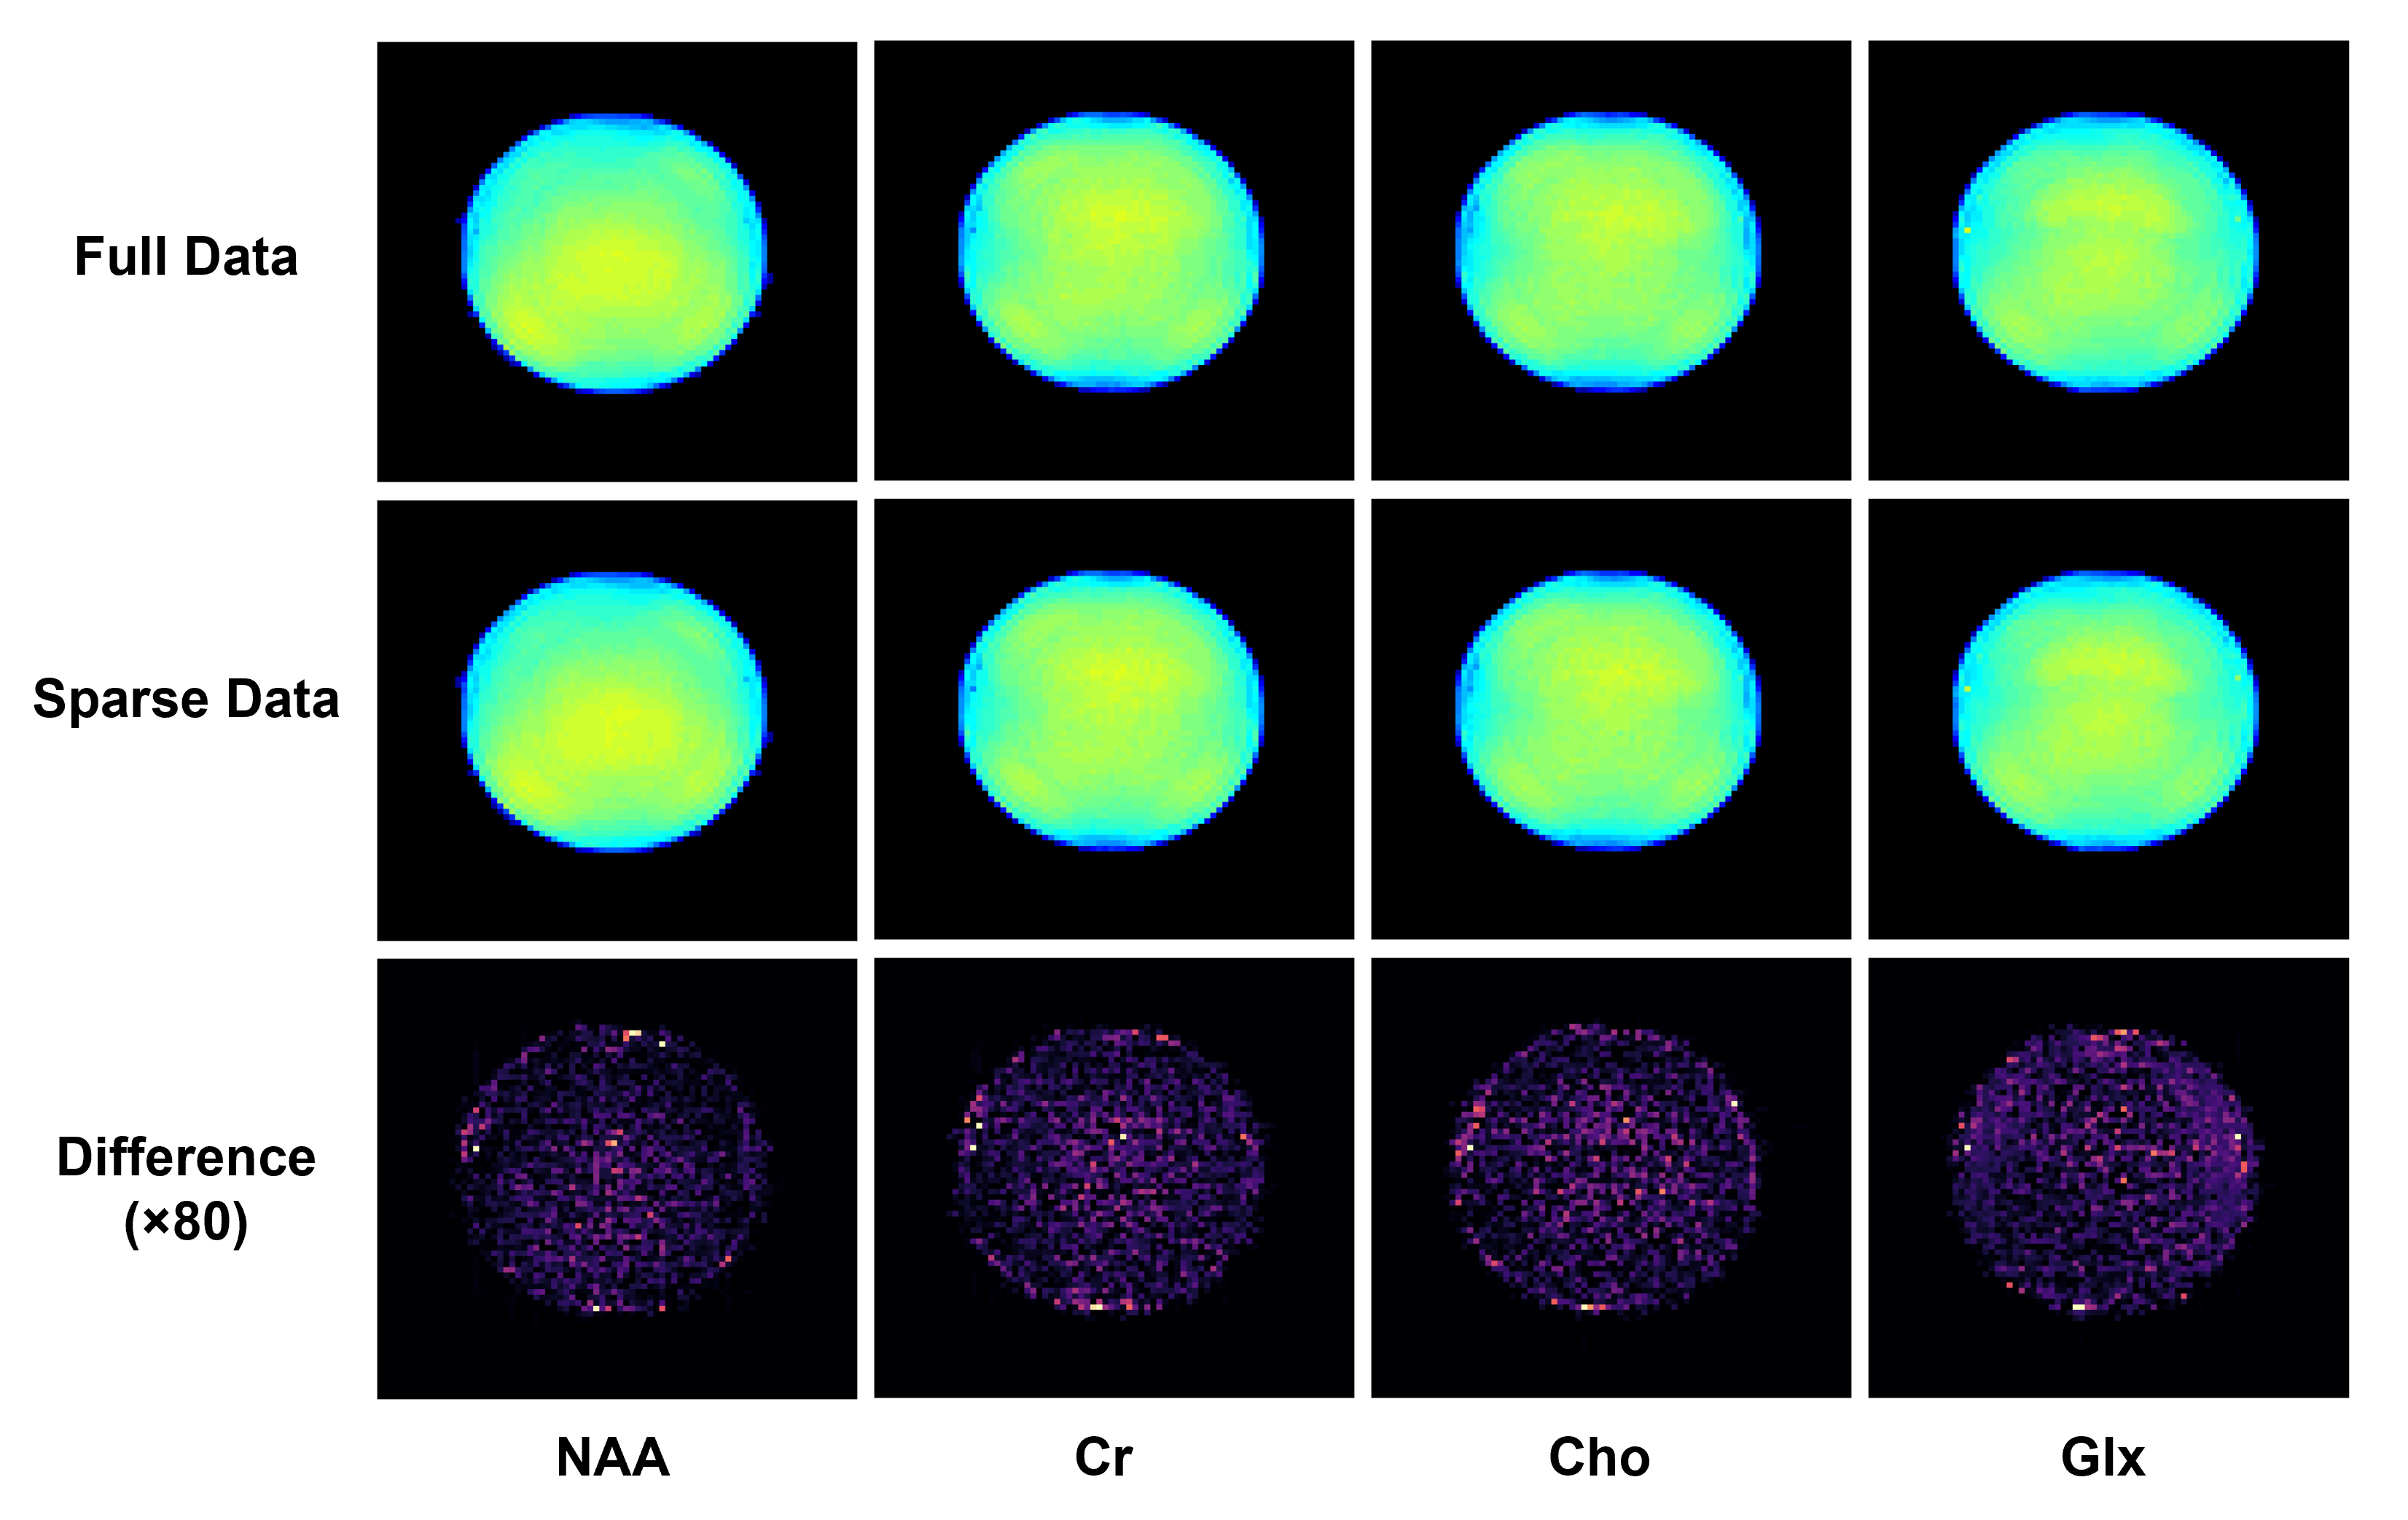
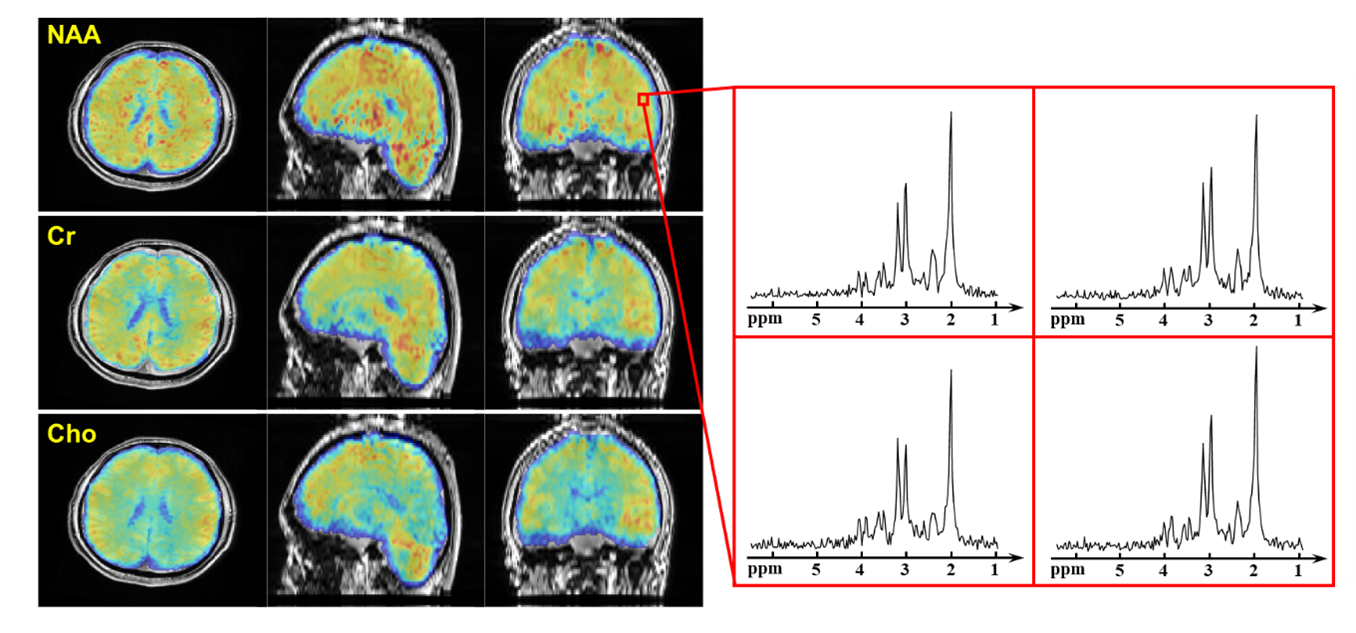
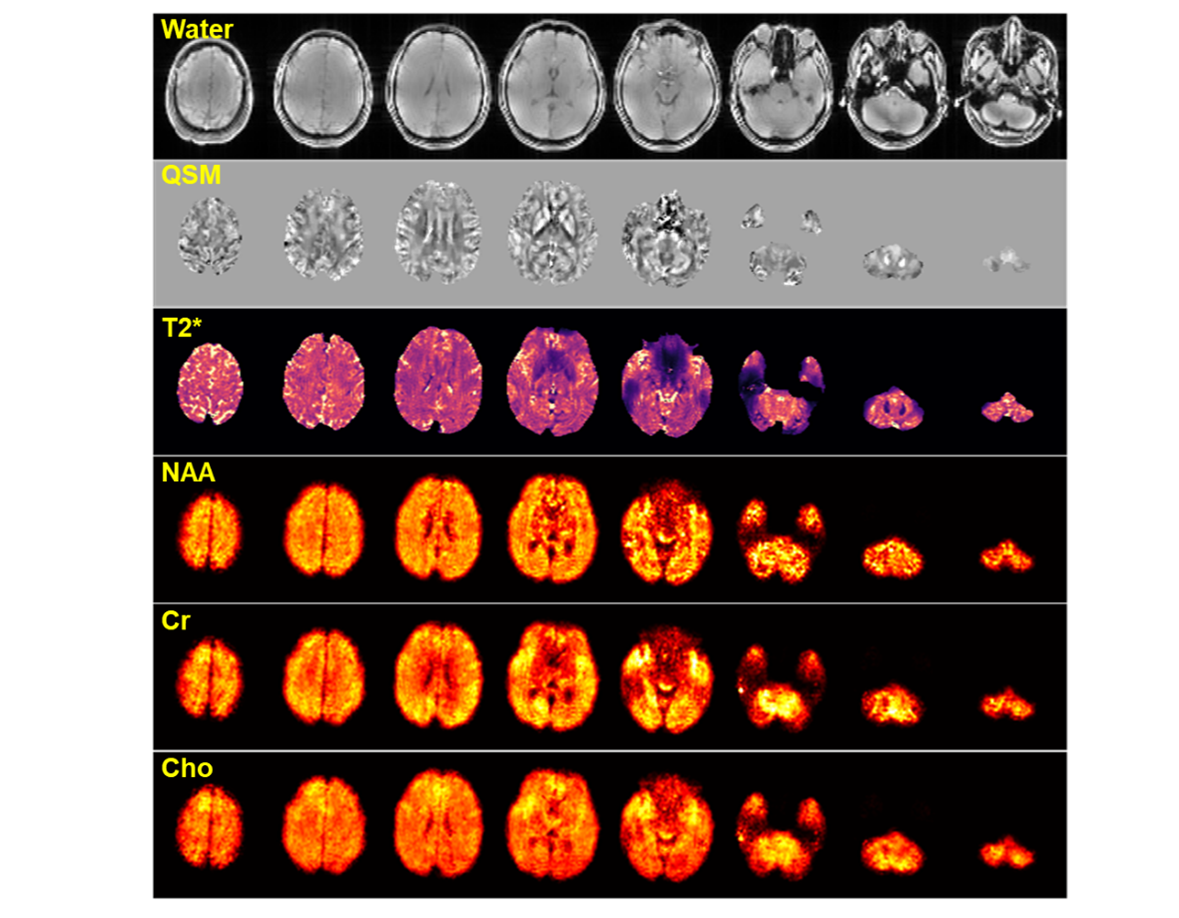
Figure 2 shows a comparison of NAA maps from the metabolite phantom before and after B0/B1 field correction. With 160 mm spatial coverage, the proposed method was able to cover the whole phantom. Before correction, there were obvious shading effects in the NAA map and inconsistency in the spectra from different locations due to B0 and B1 inhomogeneity. After correction, the spatial distribution was much more homogeneous, and the localized spectra showed significantly improved agreement. Figure 3 compares the phantom metabolite maps (NAA, Cr, Cho and Glx) reconstructed from the fully sampled data and sparse data as the proposed sparse sampling. The difference between the reconstructed metabolite maps from full data and sparse data was less than 1%, which is acceptable in most practical applications.Figure 4 displays the tri-planar views of whole brain metabolite maps (NAA, Cr and Cho) obtained from a healthy subject. Representative spectra from a region-of-interest are also shown. High-quality spatiospectral distributions of metabolites in the whole brain range were successfully obtained using the proposed method. Since the proposed MRSI method did not suppress the water signals, water imaging with various contrast can also be obtained, as shown in Fig. 5. Anatomical image, QSM, T2* (at 2.0×2.0×3.2 mm3 resolution), NAA, Cr, and Cho maps (at 3.0×3.0×3.2 mm3 resolution) were simultaneously obtained from the single 8-min scan.
Conclusion
Fast whole brain (FOV = 240×240×160 mm3) metabolic imaging at 3.0×3.0×3.2 mm3 nominal resolution can be achieved at 7T using SPICE with an extended SPICE data acquisition and processing scheme. The proposed method may provide a powerful tool for ultrahigh-field metabolic imaging of the brain in various applications.Acknowledgements
No acknowledgement found.References
1. Posse S, Otazo R, Dager S, et al. MR spectroscopic imaging: principles and recent advances. J Magn Reson Imaging. 2013;37(6):1301-1325.
2. Su L, Blamire M, Watson R, et al. Whole-brain patterns of 1H-magnetic resonance spectroscopy imaging in Alzheimer’s disease and dementia with Lewy bodies. Transl Psychiatry. 2016;6(8):e877-e877.
3. Maudsley A, Domenig C, Govind V, et al. Mapping of brain metabolite distributions by volumetric proton MR spectroscopic imaging (MRSI). Magn Reson Med. 2009;61(3):548–559.
4. Hingerl L, Strasser B, Moser P, et al. Clinical high-resolution 3D-MR spectroscopic imaging of the human brain at 7 T. Invest Radiol. 2020;55(4):239-248.
5. Klauser A, Klauser P, Grouiller F, et al. (2020). Whole-brain high-resolution metabolite mapping with 3D compressed-sensing SENSE low-rank 1H FID-MRSI. NMR Biomed. 2021:e4615.
6. Lam F, Liang ZP. A subspace approach to high‐resolution spectroscopic imaging. Magn Reson Med. 2014;71(4):1349-1357.
7. Lam F, Li Y, Guo R, et al. Ultrafast magnetic resonance spectroscopic imaging using SPICE with learned subspaces. Magn Reson Med. 2020;83(2):377-390.
8. Guo R, Zhao Y, Li Y, et al. Simultaneous QSM and metabolic imaging of the brain using SPICE: Further improvements in data acquisition and processing. Magn Reson Med. 2020;85: 970-977.
9. Breuer FA, Blaimer M, Mueller MF, et al. Controlled aliasing in volumetric parallel imaging (2D CAIPIRINHA). Magn Reson Med. 2006;55(3):549-556.
10. Griswold MA, Jakob PM, Heidemann RM, et al. Generalized autocalibrating partially parallel acquisitions (GRAPPA). Magn Reson Med. 2002;47(6):1202-1210.
11. Pruessmann KP, Weiger M, Scheidegger MB, Boesiger P. SENSE: Sensitivity encoding for fast MRI. Magn Reson Med. 1999;42(5):952-962.
12. Liang ZP. Spatiotemporal imaging with partially separable functions. Proc IEEE Int Symp Biomed Imaging. 2007:988–991.
13. Ma C, Lam F, Johnson CL, et al. Removal of nuisance signals from limited and sparse 1H MRSI data using a union‐of‐subspaces model. Magn Reson Med. 2016;75(2):488-497.
14. Li Y, Lam F, Cliiford B, et al. A subspace approach to spectral quantification for MR spectroscopic imaging. IEEE Trans Biomed Eng. 2017;64(10):2486-2489.
Figures