3534
Skeletal Muscle Metabolism in Obesity Measured by Hyperpolarized [1-13C]pyruvate1AIRC, UT Southwestern Medical Center at Dallas, Dallas, TX, United States, 2Center for Human Nutrition, UT Southwestern Medical Center at Dallas, Dallas, TX, United States, 3Pharmacology, UT Southwestern Medical Center at Dallas, Dallas, TX, United States, 4Radiology, UT Southwestern Medical Center at Dallas, Dallas, TX, United States, 5Internal Medicine, UT Southwestern Medical Center at Dallas, Dallas, TX, United States, 6Electrical and Computer Engineering, University of Texas at Dallas, Richardson, TX, United States
Synopsis
Obesity is associated with insulin resistance and chronic inflammation, both of which are known to affect skeletal muscle metabolism. However, studies in the impact of obesity on metabolism mainly focus on adipose tissue, instead of skeletal muscle. This study analyzes the in vivo pyruvate metabolism in the skeletal muscle of obese volunteers with hyperpolarized [1-13C]pyruvate. The results indicate increased lactate production and decreased pyruvate dehydrogenase activity in the skeletal muscle of obesity.
Introduction
Obesity is closely linked with developing insulin resistance, a characteristic feature of type 2 diabetes mellitus (T2DM) 1. Skeletal muscle is the primary site of insulin-stimulated glucose disposal, and therefore, plays a key role in developing insulin resistance 2. Intramyocellular lipids (IMCLs) – lipids stored in myocytes, are high in T2DM patients. The metabolic outcome of IMCLs is associated with glucose intolerance and decreased muscle density, but its impact on skeletal muscle metabolism is incompletely understood 3, 4. During obesity, insulin-mediated glucose uptake by skeletal muscle is decreased, lactate production through lactate dehydrogenase (LDH) is increased and glucose oxidation is decreased. These effects are potentially mediated by pyruvate dehydrogenase (PDH) inhibition 5-7. In addition, obesity leads to chronic inflammation in the skeletal muscle, which further complicates the pathophysiology 8. The development of hyperpolarized (HP) MRI agents provides new noninvasive imaging tools for probing these metabolic pathways in normal and disease conditions 9. HP [1-13C]pyruvate was shown to be able to assess skeletal muscle metabolism in human and animal models 10, 11. The product peak [1-13C]lactate is linked to LDH activity and inflammation 10-12, while [13C]bicarbonate is linked to PDH activity which is sensitive to exercise 10, 11. In this study, we investigated how obesity alters skeletal muscle pyruvate metabolism.Methods
Metabolic profiles of skeletal muscle in seven subjects were retrospectively analyzed to investigate the metabolic impact of obesity on pyruvate metabolism (5 males, 2 female, age = 19 – 65 y.o.). The participants’ demographics, body mass index (BMI), and acquisition methods are summarized in Table 1. All MRI studies were performed using a 3T 750w MRI scanner (GE Healthcare), a SPINlab polarizer (GE Healthcare), and a cylindrical RF coil that consisted of quadrature 1H transmit/receive, 13C quadrature transmit, and 8-channel 13C receive array coils (Clinical MR Solutions, LLC). Up to two injections of 250-mM HP [1-13C]pyruvate were performed for each participant. For participants #1-4, a time-resolved free-induction-decay (FID) data were acquired using a slice-selective pulse-and-acquire sequence (slice thickness = 10 cm, flip angle = 11.25°, TR = 3 s, spectral width = 10,000 Hz, #spectral point = 2048, scan time = 4 m) after at least 60-min of resting of their calf muscle. Participant #5 was imaged at rest and with plantar flexion exercise as previously reported 11 using a metabolite-selective multi-echo spiral imaging sequence (slice thickness = 8 cm, flip angle = 20° for pyruvate and 90° for products, #echoes = 6/metabolite, total scan time = 468 ms) that acquires images of [13C]bicarbonate, [1-13C]lactate, [1-13C]pyruvate, and [1-13C]alanine in an interleaved manner 13. From participants #6 and 7, dynamic 13C MRS that exploits a spectral-spatial RF pulse (90o for bicarbonate, 10o for lactate, 5o for pyruvate) were acquired at rest and during exercise. The interval between the HP injections were 30 min. During the interval, the participants underwent a series of 1H MRI that includes axial T2-weighted dual-echo fast spin echo for structural imaging and IDEAL-IQ sequence for fat-fraction ratios.Results and Discussion
In the time-averaged 13C spectra acquired from resting calf muscle, two obese (BMI>30) and two overweight participants (30>BMI>25) showed larger lactate-to-pyruvate ratios than the participants with normal BMI. The lactate-to-pyruvate ratio was largely proportional to BMI (Figure 1A-C). All obese or overweight participants showed a thick subcutaneous fat layer around the calf. In particular, the highest fat-fraction ratio (>20% ICML, Figure 1D) and lactate-to-pyruvate ratio were detected in the participant with T2DM (#1). The increasing trend of HP lactate production in relation to the BMI suggests that the lactate-to-pyruvate ratio from skeletal muscle might be an indicator of inherent metabolic changes (e.g., inflammation, mitochondrial dysfunction, altered substrate supply) associated with obesity.While not detectable at rest, bicarbonate immediately appeared from exercising skeletal muscle in a healthy participant (#6, Figure 2A), which is consistent with our previous results 11. Conversely, bicarbonate production in skeletal muscle of obese participants was either non-responsive to the exercise (#6, Figure 2B) or activated by a small amount (#5, Figure 2C). In particular, non-diabetic young adults with large subcutaneous fat in the calf muscle (participants #5 (19 y.o.), #7 (21 y.o.)) showed minimal activation of PDH during the exercise although they were insulin-responsive.
Conclusion
The study showed that lactate production in resting skeletal muscle from HP [1-13C]pyruvate is higher in obese people than healthy controls. PDH activation in skeletal muscle in response to plantar flexion exercise was smaller than healthy controls. These observations in agreement with chronic, low-grade skeletal muscle inflammation as well as impaired skeletal muscle mitochondrial function.Acknowledgements
The Paul D. Wellstone Muscular Dystrophy Cooperative Research Center; National Institutes of Health of the United States (R01 NS107409, P41 EB015908, S10 RR029119, S10 OD018468); The Welch Foundation (I-2009-20190330).References
1. Wondmkun, Y.T. Obesity, Insulin Resistance, and Type 2 Diabetes: Associations and Therapeutic Implications. Diabetes Metab Syndr Obes 13, 3611-3616 (2020).
2. DeFronzo, R.A. & Tripathy, D. Skeletal muscle insulin resistance is the primary defect in type 2 diabetes. Diabetes Care 32 Suppl 2, S157-163 (2009).
3. Saukkonen, T. et al. Association of intramyocellular, intraperitoneal and liver fat with glucose tolerance in severely obese adolescents. Eur J Endocrinol 163, 413-419 (2010).
4. Brennan, N.A., Fishbein, K.W., Reiter, D.A., Ferrucci, L. & Spencer, R.G. Contribution of Intramyocellular Lipids to Decreased Computed Tomography Muscle Density With Age. Front Physiol 12, 632642 (2021).
5. Dohm, G.L. et al. An in vitro human muscle preparation suitable for metabolic studies. Decreased insulin stimulation of glucose transport in muscle from morbidly obese and diabetic subjects. J Clin Invest 82, 486-494 (1988).
6. Friedman, J.E., Caro, J.F., Pories, W.J., Azevedo, J.L., Jr. & Dohm, G.L. Glucose metabolism in incubated human muscle: effect of obesity and non-insulin-dependent diabetes mellitus. Metabolism 43, 1047-1054 (1994).
7. Jeong, J.Y., Jeoung, N.H., Park, K.G. & Lee, I.K. Transcriptional regulation of pyruvate dehydrogenase kinase. Diabetes Metab J 36, 328-335 (2012).
8. Kristiansen, O.P. & Mandrup-Poulsen, T. Interleukin-6 and diabetes: the good, the bad, or the indifferent? Diabetes 54 Suppl 2, S114-124 (2005).
9. Ardenkjaer-Larsen, J.H. et al. Increase in signal-to-noise ratio of > 10,000 times in liquid-state NMR. Proc Natl Acad Sci U S A 100, 10158-10163 (2003).
10. Park, J.M. et al. Hyperpolarized NMR study of the impact of pyruvate dehydrogenase kinase inhibition on the pyruvate dehydrogenase and TCA flux in type 2 diabetic rat muscle. Pflugers Arch (2021).
11. Park, J.M. et al. Hyperpolarized (13)C MR Spectroscopy Depicts in Vivo Effect of Exercise on Pyruvate Metabolism in Human Skeletal Muscle. Radiology, 204500 (2021).
12. MacKenzie, J.D. et al. Detection of inflammatory arthritis by using hyperpolarized 13C-pyruvate with MR imaging and spectroscopy. Radiology 259, 414-420 (2011).
13. Ma, J. et al. Cardiac T2∗ measurement of hyperpolarized (13) C metabolites using metabolite-selective multi-echo spiral imaging. Magn Reson Med 86, 1494-1504 (2021).
Figures
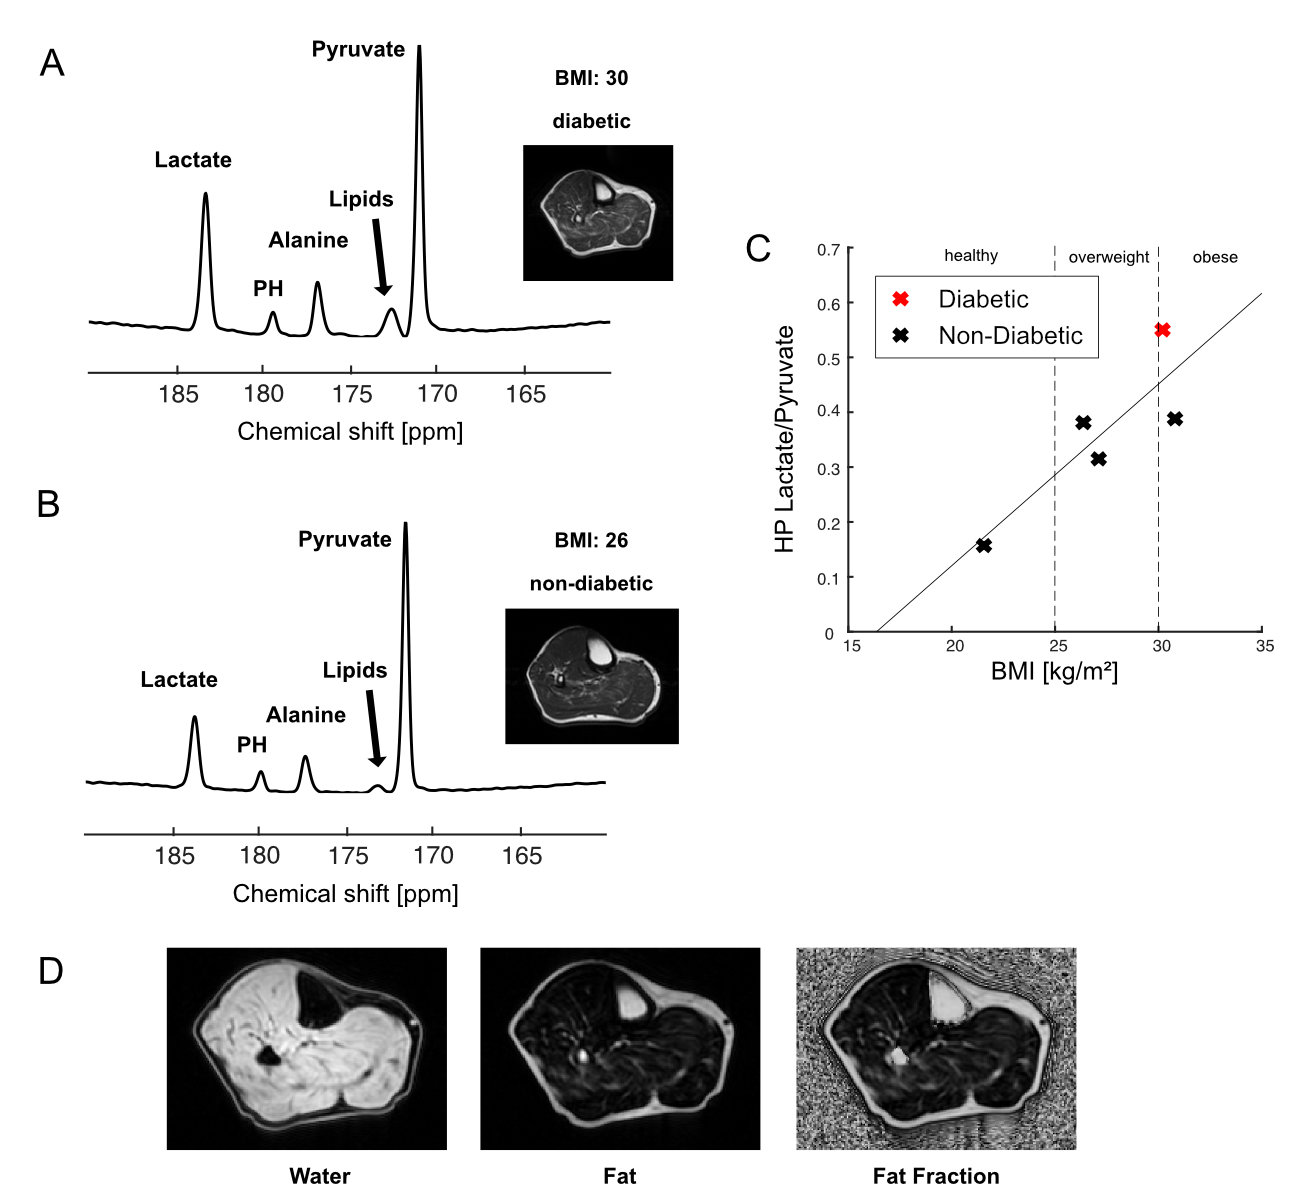
HP [1-13C]pyruvate MRS of skeletal muscle in obesity. Time-averaged HP [1-13C]pyruvate spectra from (A) diabetic subject #1 and (B) control subject. (C) Graph of lactate-to-pyruvate ratios against BMI (kg/m2) of subjects # 1-5 (Table 1). Subject #1 with T2DM is shown in red. (D) Fat fraction from subject #1 with T2DM, mapped by IDEAL-IQ.

Metabolic imaging of calf muscle during exercise in obesity. HP 13C imaging was acquired from exercising muscle. (A) The 13C metabolite maps of metabolites [1-13C]pyruvate, [1-13C]lactate, [1-13C]alanine, [13C]bicarbonate, normalized by the peak [1-13C]pyruvate signal and overlaid on top of the corresponding 1H fast spin echo image of the slice from healthy subject #6. Time-average HP [1-13C]pyruvate spectra from(B) healthy subject #6 and (C) obese subject #5 at rest or with exercise.