3532
Feasibility of Simultaneous Measurements of GABA, Glx and GSH in the Thalamus Using HERMES1Department of Diagnostic Radiology and Nuclear Medicine, University of Maryland School of Medicine, Baltimore, MD, United States
Synopsis
It is desirable to measure GABA, glutamate, and GSH in the thalamus for understanding pathological and pharmacokinetic changes. In this study, we study the feasibility of simultaneous measurements of these metabolites in the thalamus using HERMES. HERMES data were acquired on 20 healthy adult volunteers with and without saturation bands. HERMES data were processed in Gannet with and without spectral alignment. The results demonstrated the feasibility of using HERMES for simultaneous measurements of GABA, Glx and GSH in the thalamus. HERMES combined with saturation bands and retrospective spectral alignment yields high SNR spectra and reproducible measurements in the thalamus.
INTRODUCTION
In vivo measurements of γ-aminobutyric acid (GABA), a primary inhibitory neurotransmitter, and glutamate, the principal excitatory neurotransmitter, are important to the understanding of neuronal activity1, 2. Glutathione (GSH), a primary antioxidant, helps in preventing the damage to the brain cells caused by reactive oxygen species3, 4. It is desirable to measure these metabolites in the thalamus for understanding pathological and potential pharmacokinetic changes5-7. However, acquisition in the thalamus is more challenging than in cortical structures due to higher main magnetic field (B0) inhomogeneity within the thalamus region and reduced SNR as the thalamus is situated deep in the brain away from the receiver coils. MEGA-PRESS8, an edited magnetic resonance spectroscopy (MRS) method, is widely used to measure GABA in the thalamus9, 10. However, it provides information only on a single metabolite at a time and hence multiple scans are needed to measure GABA and GSH. The newly introduced HERMES11, 12 simultaneously edits multiple metabolites in a single scan and thus reduce the scan time by a half the time it would take to measure these metabolites individually. In this study, we demonstrate the feasibility of simultaneous measurements of GABA, Glx (glutamate+glutamine, co-edited with GABA) and GSH in the thalamus on healthy volunteers using HERMES. We also investigate optimal strategies for HERMES acquisition and processing in the thalamus and provide a preliminary result on the reproducibility of the measured metabolite levels.METHODS
All HERMES experiments were performed on a Siemens PrismaFIT 3T scanner with a 64-channel head coil. The HERMES sequence11 contains four sub-experiments: Experiment 1, a dual-lobe editing pulse to target GABA at 1.9 ppm (ONGABA) and GSH at 4.56 ppm (ONGSH) simultaneously; Experiment 2, GABA-only (ONGABA); Experiment 3, GSH-only (ONGSH); and Experiment 4, editing pulse applied at 7.5 ppm (OFF7.5) in an interleaved fashion. The scan parameters were: TE/TR=80/2000ms; 320 averages; 3x3x2.5 cm3 voxel in the bilateral thalamus as shown in Figure 1.Experiment
HERMES data in the thalamus were acquired on 20 healthy adult volunteers (12 females, age: 35.1±14.6 years, range: 21-65 years) with approval of University of Maryland School of Medicine Institutional Review Board. In nine subjects, additional slice-selective saturation bands were set up to minimize out-of-voxel signals (spurious signals). Among these nine subjects, five subjects were scanned both with and without saturation bands to assess the impact of saturation bands on the robustness of the measurements. To test the reproducibility of the HERMES scan, a total of five subjects returned for a second visit, during which the HERMES acquisition was repeated twice using the same parameters as those used during the first visit.
Post-processing and analysis
HERMES data were post-processed in Gannet13 with frequency-and-phase alignment using the spectral registration method14 (‘With-SpecReg’) and without the alignment (‘No-SpecReg’). All the metabolite levels reported in this abstract are the CSF-corrected absolute metabolite concentrations in institutional unites (i.u.). For the five subjects whose HERMES data acquired both with (‘With-Sat’) and without (‘No-Sat’) saturations bands, variability of four combinations (A: No-Sat, No-SpecReg, B: No-Sat, With-SpecReg, C: With-Sat, No-SpecReg, D: With-Sat, With-SpecReg) were compared. The mean, standard deviation (SD) and coefficient of variation (CV) of the measured metabolite levels were also compared for the No-Sat (N=11) and With-Sat (N=9) subjects.
RESULTS
Good shimming was achieved in all the HERMES acquisitions with FWHM ranging from 7.1-13.8 Hz (mean±SD: 10.6±1.9 Hz).Figure 2 shows a comparison of the difference spectra and fitting results between No-Sat and With-Sat datasets acquired from the same subject. The No-Sat spectra in Figure 2a-c appear more noisy than the With-Sat spectra in Figure 2d-f. The fitting errors for No-Sat data are considerably higher than the With-Sat condition: GABA (No-Sat vs With-Sat), 23.87% vs7.70%, Glx, 6.05% vs 4.92%, GSH, 20.08% vs 8.40%.
Figure 3 shows the comparison of different acquisition (No-Sat vs With-Sat) and processing (No-SpecReg vs With-SpecReg) strategies on five subjects. CVs for the With-Sat datasets (C&D) are consistently lower for all the three metabolites. For GABA, CVs are comparable between No-SpecReg (C) and With-SpecReg (D). For Glx and GSH, CVs are smaller for With-SpecReg (D). The finding supports the use of frequency-and-phase alignment of With-Sat HERMES data. In the subsequent analysis, With-Sat, With-SpecReg results are reported unless otherwise noted.
Figure 4 shows the comparison between the two groups of subjects with No-Sat and With-Sat HERMES data. The average measured metabolite levels are stable between the two groups with the percentage differences of the average metabolite levels less than 20% for the three metabolites. However, the With-Sat group results have considerably lower CV.
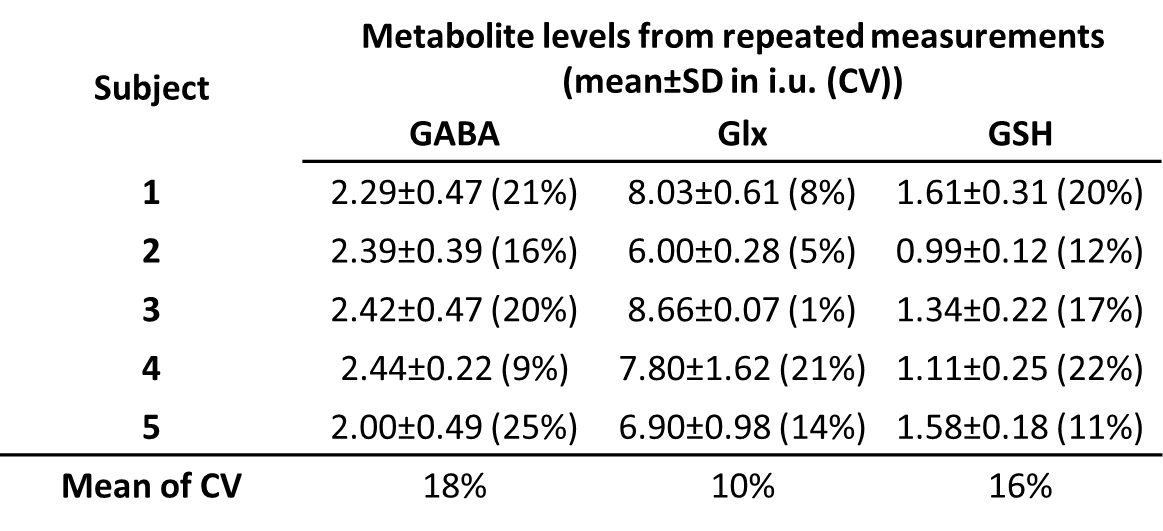
Figure 5 reports the reproducibility from the repeated HERMES measurements on five subjects. The average CVs were below 20% for the three metabolites.
DISCUSSION & CONCLUSION
We have demonstrated the feasibility of using HERMES for simultaneous measurements of GABA, Glx and GSH in the thalamus. The HERMES scan halves the time required to acquire these metabolites individually, which can benefit subjects who cannot stay still for a longer scan. GSH and Glx benefit from the alignment more than GABA probably because of a low level frequency drift. Overall, HERMES combined with saturation bands and retrospective spectral alignment minimizes out-of-voxel signals, yielding high SNR spectra and reproducible measurements in the thalamus.Acknowledgements
The study was conducted at University of Maryland School of Medicine Center for Innovative Biomedical Resources, Translational Research in Imaging @ Maryland (CTRIM) – Baltimore, Maryland. The study is supported by NIH under grant 5R01NS105503 and grant K99DA051315.
References
1. Foerster, B. R., Pomper, M. G., Callaghan, B. C., Petrou, M., Edden, R. A. E., Mohamed, M. A., et al. (2013). An imbalance between excitatory and inhibitory neurotransmitters in amyotrophic lateral sclerosis revealed by use of 3-T proton magnetic resonance spectroscopy. JAMA Neurol. 70, 1009–1016.
2. Younis S, Hougaard A, Christensen CE, et al. Effects of sildenafil and calcitonin gene-related peptide on brainstem glutamate levels: a pharmacological proton magnetic resonance spectroscopy study at 3.0 T. J Headache Pain. 2018;19(1):44. Published 2018 Jun 18.
3. Chi L, Ke Y, Luo C, Gozal D, Liu R. Depletion of reduced glutathione enhances motor neuron degeneration in vitro and in vivo. Neuroscience. Feb; 2007 144(3):991–1003.
4. Olanow CW. An introduction to the free radical hypothesis in Parkinson’s disease. Ann Neurol. 1992; 32(Suppl):S2–9
5. Neill, J. O., Lai, T. M., Sheen, C., Salgari, G. C., Ly, R., Armstrong, C., et al. (2016). Cingulate and thalamic metabolites in obsessive-compulsive disorder. Psychiatry Res. Neuroimaging 254, 34–40.
6. Bathel, A., Schweizer, L., Stude, P., Glaubitz, B., Wulms, N., Delice, S., et al. (2018). Increased thalamic glutamate/glutamine levels in migraineurs. J. Headache Pain 19:55.
7. Younis S, Hougaard A, Christensen CE, et al. Feasibility of Glutamate and GABA Detection in Pons and Thalamus at 3T and 7T by Proton Magnetic Resonance Spectroscopy. Front Neurosci. 2020;14:559314. Published 2020 Oct 23.
8. Mescher M, Merkle H, Kirsch J, Garwood M, Gruetter R. Simultaneous in vivo spectral editing and water suppression. NMR Biomed. 1998;11(6):266-272.
9. Bathel A, Schweizer L, Stude P, et al. Increased thalamic glutamate/glutamine levels in migraineurs. J Headache Pain. 2018;19(1):55.
10. Tapper S, Göransson N, Lundberg P, Tisell A, Zsigmond P. A pilot study of essential tremor: cerebellar GABA+/Glx ratio is correlated with tremor severity. Cerebellum Ataxias. 2020;7:8.
11. Saleh MG, Oeltzschner G, Chan KL, Puts N, Mikkelsen M, Schär M, Harris AD, Edden R. Simultaneous edited MRS of GABA and glutathione. NeuroImage 2016;142:576–582.
12. Chan KL, Puts NA, Schär M, Barker PB, Edden RA. HERMES: Hadamard encoding and reconstruction of MEGA-edited spectroscopy. Magn Reson Med. 2016;76(1):11-19.
13. Edden RAE, Puts NAJ, Harris AD, Barker PB, Evans CJ. Gannet: A batch-processing tool for the quantitative analysis of gamma-aminobutyric acid– edited MR spectroscopy spectra. J Magn Reson Imaging JMRI. Dec; 2014 40(6):1445–52.
14. Mikkelsen M, Saleh MG, Near J, et al. Frequency and phase correction for multiplexed edited MRS of GABA and glutathione. Magn Reson Med. 2018;80(1):21-28.
Figures
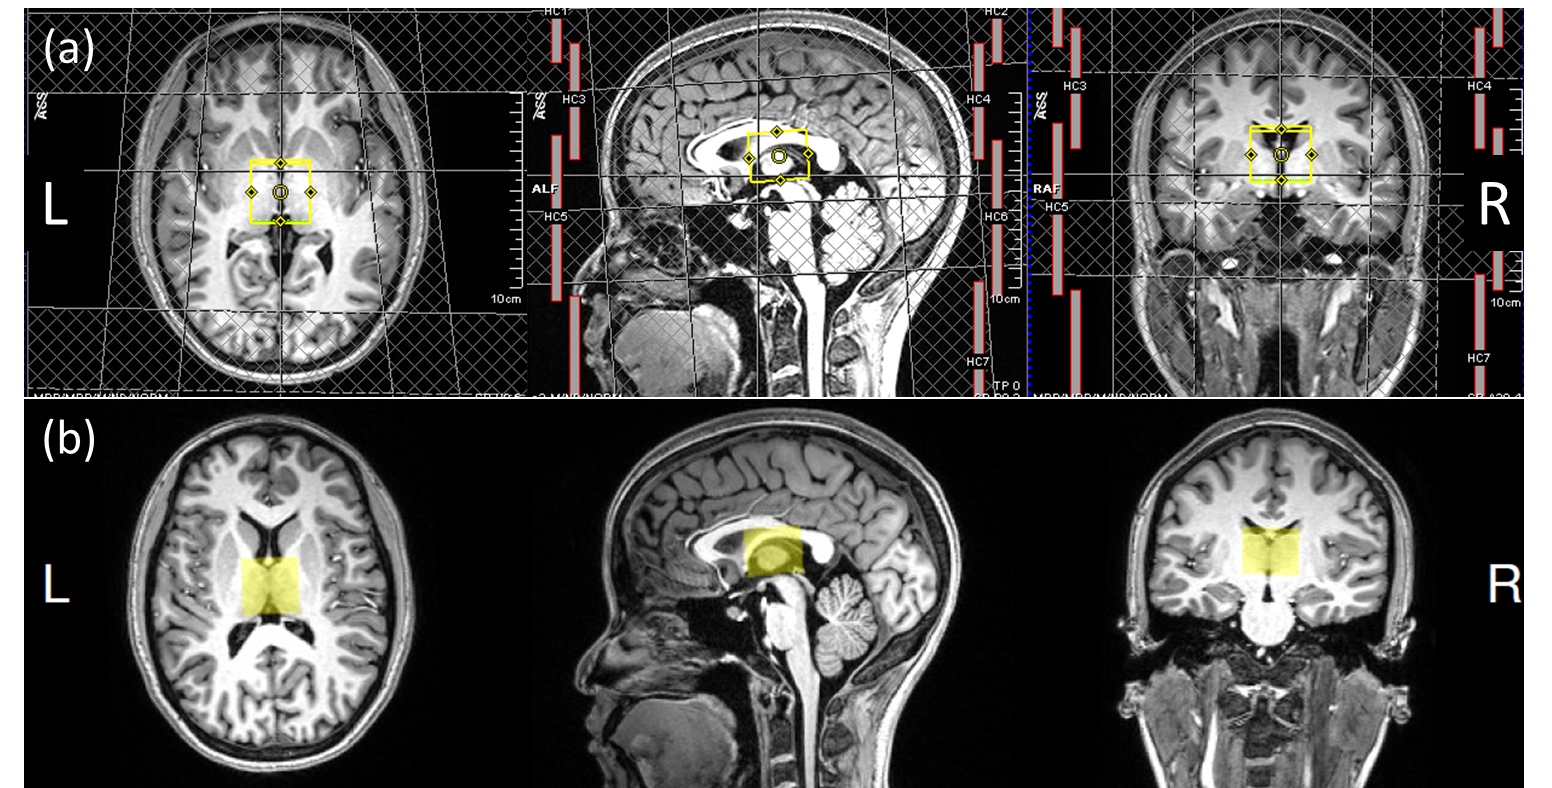
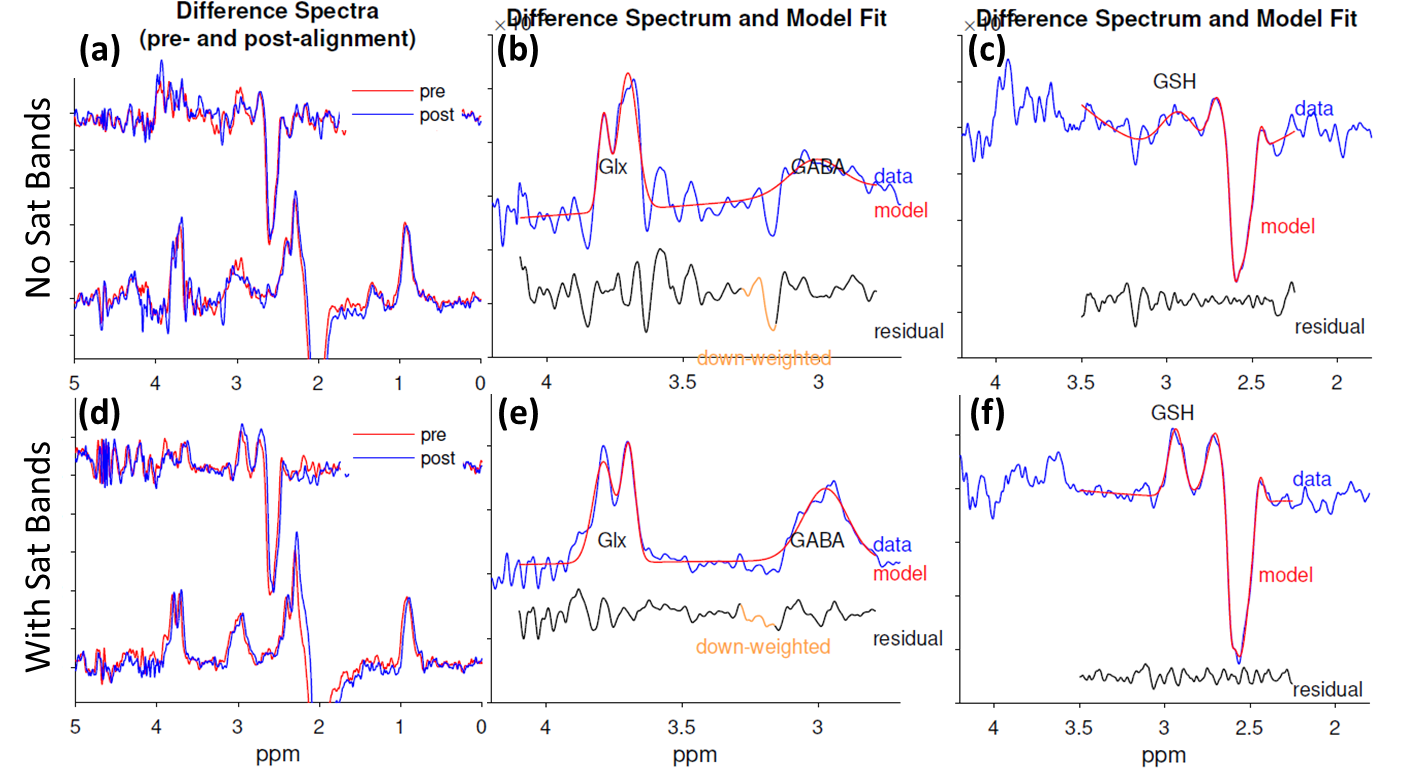
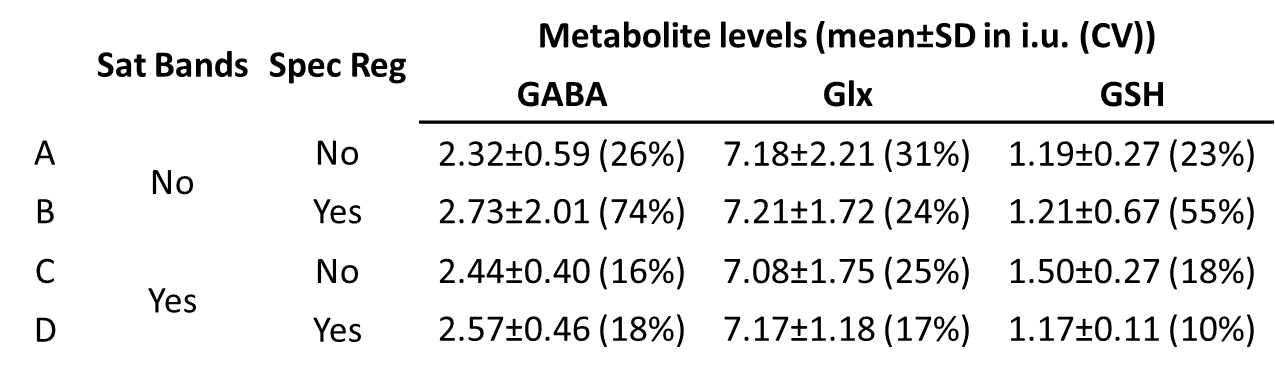
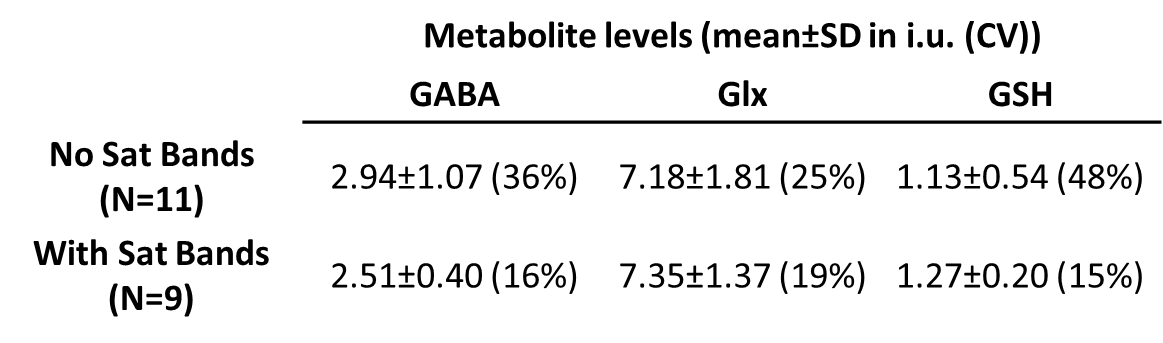
Figure 4. The metabolite levels for the subjects whose HERMES data were acquired without saturation bands (‘No Sat Bands’) vs the metabolite levels for the subjects whose HERMES data acquired with saturation bands (‘With Sat Bands’). SD: standard deviation, CV: coefficient of variation.