3528
B1-inhomogeneity Correction of Hyperpolarized 129Xe Lung Ventilation Imaging Using Spiral1Center for Pulmonary Imaging Research, Cincinnati Children’s Hospital Medical Center, Cincinnati, OH, United States, 2Department of Biomedical Engineering, University of Cincinnati, Cincinnati, OH, United States, 3Department of Radiology, Cincinnati Children’s Hospital Medical Center, Cincinnati, OH, United States, 4Department of Pediatrics, University of Cincinnati, Cincinnati, OH, United States
Synopsis
Hyperpolarized 129Xe MRI can non-invasively measure regional ventilation by mapping the spin-density of inhaled gas, thus providing insights into regional disease pathophysiology. However, the quantitative accuracy of 129Xe ventilation imaging is reduced by B1-inhomogeneity causing spatial variations in both coil sensitivity and nonequilibrium magnetization decay. These can cause lung function impairment to be either over or underestimated. We demonstrate these artifacts can be mitigated by generating flip angle maps from paired 2D-spiral images acquired in the same held breath. This yields quantitatively comparable results to those obtained with a conventional, 2D gradient recalled echo sequence in substantially reduced acquisition times.
Introduction
The highly non-equilibrium magnetization afforded by hyperpolarized (HP) 129Xe MRI enables non-invasive strategies to quantify lung function and structure1-5. In particular, mapping the spin-density of the inhaled gas enabled regional ventilation to be imaged, thus providing insights into regional disease pathophysiology. However, each RF pulse used to acquire the image (n,…,N) consumes longitudinal magnetization. Therefore, selecting an optimal flip angle (FA) is crucial to obtaining high image quality. However, even when the global FA is optimal, B1-inhomogeneity causes the local FA to deviate from proscribed value across the imaged volume. Moreover, these artifacts vary between patients, due to differences in coil fit and loading, and can mimic disease, compromising image interpretation. Fortunately, these systematic deviations can be corrected if the local FA is known. Previously, FA maps were obtained by acquiring two consecutive images at the same constant FA (θC) during a breath-hold using a 2D GRE sequence6. This method requires long breath holds (~10-15 s), which can be challenging for pediatric and severely ill patients, or limited lung coverage. However, spiral acquisitions acquire k-space data more efficiently, reducing overall scan duration (<5s)7-10. In this study, we describe and test a method to acquire sensitivity maps and ventilation images during a single breath-hold scan and compare the resulting correction maps to those obtained using 2D-GRE. These maps can be used to detect and compensate for intensity variation artifacts caused by B1-inhomogeneity.Theory and Methods
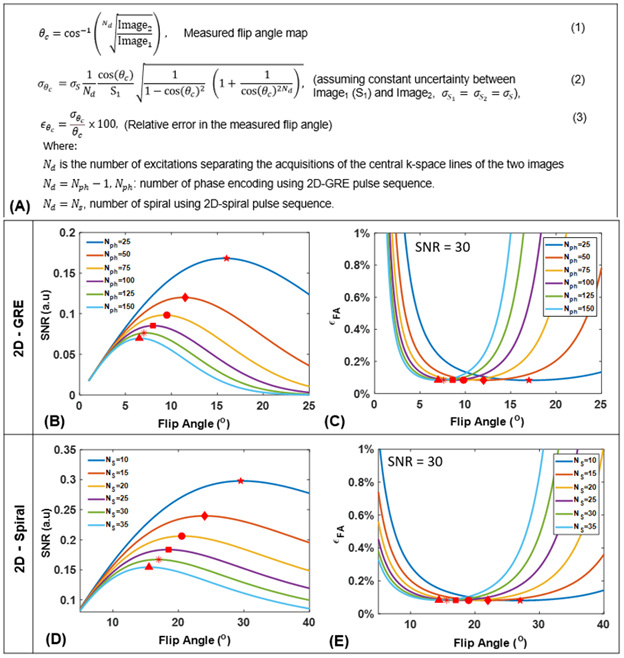
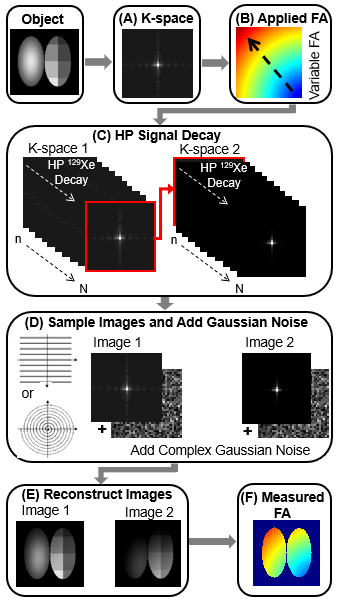
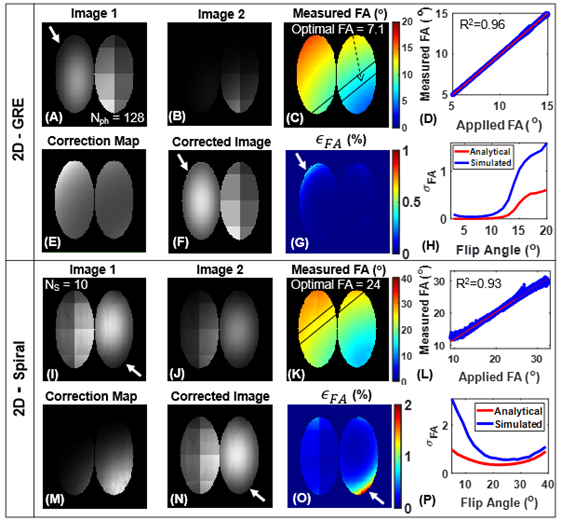
An analytical model for FA uncertainty (relative error, ϵθc) was derived using error propagation (Figure 1A) and evaluated using MATLAB (MathWorks, Natick, MA) across a range of parameters for 2D-GRE and 2D-spiral (number of phase encoding, Nph=25−150, number of spirals, NS=10−35 and θc=1o−40o). To validate this model, 2D simulations for GRE and spiral were performed by modeling signal decay according to (Figure 2). For HP 129Xe imaging, both 2D-GRE and 2D-spiral sequences were designed such that two consecutive images (fully sampled) were acquired with fixed and slice position during a breath-hold and T1 could be assumed to be long relative to slice acquisition. To validate this approach, structured and non-structured phantoms containing 1L of HP-129Xe were imaged at 3T (Philips Ingenia, Best, Netherlands). Finally, HP-129Xe ventilation imaging was performed in a healthy volunteer (male, 30 years) and a patient with Cystic Fibrosis (CF, female, 21 years). Xenon was polarized to ~30% (Polarean 9820, Inc, Durham, NC). MRI parameters included: resolution 3x3x15mm2, 12 slices, TR/TE [GRE=6.16/1.7; spiral=14/0.92ms], FOV [GRE=340×240; spiral=340×340mm2], scan time [GRE~15; spiral~5s] and acquisitions window [GRE=0.3; spiral=10ms]. Images were reconstructed using Graphical Programming Interface (GPI)11 with further analysis performed in MATLAB. The two consecutive images were used to generate FA maps and according to the equations in Figure 1A. FA maps were used to correct first image according toImage1(GRE)×(1/(θc·cosNph/2(θc)·sin(θc))) and Image1(Spiral)×(NS/(θc·sin(θc)))×(1-cos(θc))/(1-cosNS(θc))
Results
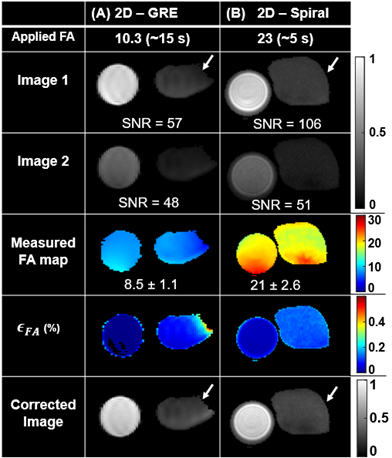
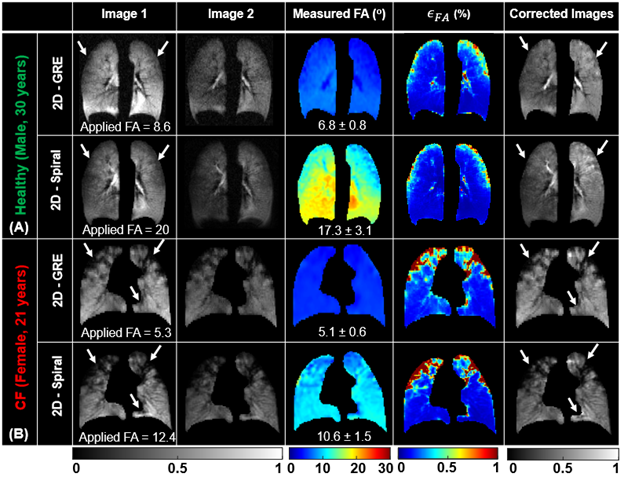
The analytical solution for FA uncertainty showed that there exists a FA that maximizes SNR and minimizes ϵθc for a given Nph for GRE (Figure 1B-C). A similar trend was observed for spiral imaging, where SNR is maximized and ϵθc is minimized at optimal FA for given NS (Figure 1D-E). Mean measured FA agreed well with applied FA in simulations (R2> 0.95; Figure 3), phantoms (Figure 4) and in vivo imaging (Figure 5) (underestimated by <15%). Furthermore, regions with increased signal decay (white arrows) showed an increase in ϵθc, relative to the regions with proscribed FA values. The reconstructed images were corrected using the measured FA maps, showing more accurate distribution of xenon signal relative to uncorrected images.Discussion and Conclusion
An analytical model was derived to examine the impact of acquisition parameters (e.g., N, FA) on the uncertainty in the measured FA. The analytical model accounts for HP-specific effects but does not account for the uncertainty resulting from image acquisition and reconstruction. To address this limitation, we simulated HP 129Xe ventilation imaging for GRE and spiral. These simulations produced broadly similar results to those predicted by the model with only modestly elevated errors (Figure 3H and P). HP gas phantoms further validated the approach for measuring RF-coil sensitivity maps. The measured FA maps correlated well with the applied FA for both GRE and spiral sequences. Ventilation images and a voxel‐level FA map were successfully obtained during the same breath hold using spiral (~5s) from both healthy and CF subjects. Mean measured FA maps agreed well with the applied FAs. Generated FA maps were then used to correct images for signal decay. The corrected images provide a superior estimate of regional 129Xe content. Notable improvements were observed in the appearance of the corrected images from both healthy and CF subjects. More importantly, spiral FA and correction maps produced nearly identical maps to those obtained using conventional GRE. However, spiral provided higher SNRs and three-fold faster acquisition times compared to GRE for the same resolution and number of slices. This rapid acquisition makes spiral more practical for 129Xe ventilation imaging, especially for pediatric subjects or patients with highly compromised respiratory function.Acknowledgements
The authors acknowledge the following sources for research funding and support: Cincinnati Children’s Research Foundation and NIH (R01HL131012, R01HL143011, and R00HL138255).References
1. Walkup LL, Woods JC. Translational Applications of Hyperpolarized 3he and 129Xe. NMR in Biomedicine 2014;27:1429-1438.
2. Goodson BM. Nuclear Magnetic Resonance of Laser-Polarized Noble Gases in Molecules, Materials, and Organisms. Journal of Magnetic Resonance Imaging: An Official Journal of the International Society for Magnetic Resonance in Medicine 2002;155:157-216.
3. Ruppert K. Biomedical Imaging with Hyperpolarized Noble Gases. Reports on Progress in Physics 2014;77:116701.
4. Mugler III JP, Altes TA. Hyperpolarized 129Xe MRI of the Human Lung. Journal of Magnetic Resonance Imaging 2013;37:313-331.
5. Bdaiwi AS, Niedbalski PJ, Hossain MM, et al. Improving Hyperpolarized 129Xe ADC Mapping in Pediatric and Adult Lungs with Uncertainty Propagation. NMR Biomed 2021:e4639.
6. Miller G, Altes T, Brookeman J, De Lange E, Mugler Iii J. Hyperpolarized 3He Lung Ventilation Imaging with B1-Inhomogeneity Correction in a Single Breath-Hold Scan. Magnetic Resonance Materials in Physics, Biology Medicine 2004;16:218-226.
7. Salerno M, Altes TA, Brookeman JR, De Lange EE, Mugler III JP. Rapid Hyperpolarized 3He Diffusion MRI of Healthy and Emphysematous Human Lungs Using an Optimized Interleaved‐Spiral Pulse Sequence. Journal of Magnetic Resonance Imaging: An Official Journal of the International Society for Magnetic Resonance in Medicine 2003;17:581-588.
8. Willmering MM, Niedbalski PJ, Wang H, Walkup LL, Robison RK, Pipe JG, Cleveland ZI, Woods JC. Improved Pulmonary (129) Xe Ventilation Imaging Via 3d-Spiral Ute Mri. Magn Reson Med 2020;84:312-320.
9. Brandon Zanette YF, Samal Munidasa , and Giles Santy Comparison of 3d Stack-of-Spirals and 2d Gradient Echo for Ventilation Mapping Using Hyperpolarized 129xe. ISMRM2020.
10. Doganay O, Matin TN, Mcintyre A, Burns B, Schulte RF, Gleeson FV, Bulte D. Fast Dynamic Ventilation MRI of Hyperpolarized 129xe Using Spiral Imaging. Magn Reson Med 2018;79:2597-2606.
11. Zwart NR, Pipe JG. Graphical Programming Interface: A Development Environment for MRI Methods. Magn Reson Med 2015;74:1449-1460.
Figures