3524
Fast Volumetric Diffusion-Weighted MRSI: Improved Acquisition and Data Processing1Department of Bioengineering, University of Illinois at Urbana-Champaign, Urbana, IL, United States, 2Beckman Institute for Advanced Science and Technology, Urbana, IL, United States, 3Cancer Center at Illinois, University of Illinois at Urbana-Champaign, Urbana, IL, United States
Synopsis
Diffusion-weighted MRSI (DW-MRSI) is a unique quantitative molecular imaging modality that can potentially provide exclusive cell-type and compartment-specific microstructural information in vivo. However, DW-MRSI studies have been largely limited to single voxels or very low resolutions in basic science and clinical applications due to several fundamental technical challenges. Here, we further enhanced the performance and robustness of the recently proposed subspace imaging method by synergizing improved acquisition and data processing strategies. Higher b-value DE and 3D metabolite mean diffusivity mapping more immune to physiological motions at a 6.9x6.9x8 mm3 nominal resolution were achieved in less than 20-mins.
Introduction
Diffusion-weighted MRSI (DW-MRSI) is a quantitative molecular imaging modality that can potentially provide exclusive cell-type and compartment-specific microstructural information in vivo1-3. Measuring multimolecular diffusion properties has enabled investigations into brain tissue and cellular microstructures3-5 under physiological conditions and their alterations in neurological diseases6-8. However, in vivo DW-MRSI are highly challenging experiments due to (1) the intrinsic SNR limitation of MRSI as well as further signal loss due to diffusion encoding (DE), (2) long acquisition times due to the need to encode the high-dimensional spatial-spectral-diffusion space with multiple DE conditions for quantitative analysis; and (3) susceptibilities to macroscopic and microscopic physiological motions and system instabilities9-10. Recently, a new DW-MRSI method built on the SPICE subspace imaging framework13 has been developed to achieve fast, volumetric DW-MRSI of the brain at 3T with resolution much higher than the typical 1cm3 voxel size. In this work, we further enhanced the performance and robustness of this method by synergizing improved acquisition and data processing strategies. Higher b-value DE and 3D metabolite mean diffusivity (MD) mapping more immune to physiological motions at a 6.9x6.9x8 mm3 nominal resolution were achieved in less than 20-mins.Methods
Data acquisition:We introduced flow-compensated DE gradients14,15 into the fast DW-MRSI sequence. Specifically, a pair of flow-compensated gradients was designed and integrated into the double spin-echo DW-MRSI sequence (see Fig.1). Maximum b-value of 5000 s/mm2 can be achieved within the gradient limits for a 3T system (can be higher for higher field systems). Peripheral pulse triggering is used instead of ECG triggering for a more efficient acquisition with minimized dead times and better motion control. Combined with the interleaved water navigators for phase and magnitude correction across TRs, data artifacts can be substantially reduced (Fig.1).
Reconstruction with learned subspaces:
Reconstruction from data acquired at higher b-values is more challenging due to the reduced SNR. Straightforward application of spatial constrained and/or low-rank constrained reconstruction can fail to recover the multi-b-value spatiospectral function faithfully. We propose here to use learned subspaces16 for reconstruction from noisy data. Specifically, we learned a multi-b-value subspace for DW metabolite FIDs using the process shown in Fig. 2. Experimental training data (at low b-values) were acquired and fitted to extract voxel-wise experimental lineshape distortions (e.g., using FIR filters), which were used to adapt the learned subspace to account for additional experimental variations. This is an extension of the previously reported model learning methods with DW signal models included16,17. The learned and adapted subspace captures variations of metabolites signals across DW dimension and can be used to improve the reconstruction, especially from high b-value data. With the learned multi-b-value subspace, a similar subspace-constrained reconstruction with spatial regularization in [16] is used.
Spectral quantification and parameter estimation:
With the multi-dimensional spatial-temporal-diffusion reconstruction, metabolite diffusion coefficients can be estimated using concentrations quantified from individual DEs. However, this leads to an increased number of unknown parameters, which does not fully take advantage of the data dependencies (across DEs) and fitting of higher-b-value data is less reliable due to lower SNR. Inspired by the approach in [18], we proposed a spectral fitting strategy using metabolite-specific multi-b-value subspace models. Specifically, we model the reconstruction as:
$$ \hat{\rho}(\mathbf{r},t,\mathbf{b})=\sum_{l_{NAA}=1}^{L_{NAA}}c_{l_{NAA}}(\mathbf{r})v_{l_{NAA}}(t,\mathbf{b})+\sum_{l_{Cr}=1}^{l_{Cr}}c_{l_{Cr}}(\mathbf{r})v_{l_{Cr}}(t,\mathbf{b})+\sum_{l_{{Cho}}=1}^{L_{{Cho}}}c_{l_{Cho}}(\mathbf{r})v_{l_{Cho}}(t,\mathbf{b})+\sum_{l_{{other}}=1}^{L_{{other }}}c_{l_{other}}(\mathbf{r}) v_{l_{other}}(t,\mathbf{b}),(1) $$
where $$$t$$$ and $$$\mathbf{b}$$$ denote the chemical shift and DE dimensions. The metabolite-specific multi-b-value basis $$$\{v_{l_{x}}(t,\textbf{b})\}$$$ with model orders $$$l_x$$$ are learned subspaces incorporating lineshape adaptation to $$$\hat{\rho}\left(\mathbf{r},t,\mathbf{b}\right)$$$ (details omitted). The separated metabolite components were then subject to a multi-b-value joint parametric fitting to determine the metabolite ADCs, i.e.,
$$S_{m}(t,\mathbf{b})=e^{i \varphi_{\mathrm{b}}} e^{-t^{2}/g} e^{-\mathbf{b}\times ADC_{m}}c_{m} \phi_{m}(t)e^{\left(i2\pi\delta f_{m}t-t/T_{2}^{*}m\right)},(2)$$
where $$$S_{m}(t,\mathbf{b})$$$denotes the multi-b-value FIDs, $$$\phi_{m}(t), ADC_{m}, c_{m}, T_{2}^{*}m, $$$ and $$$\delta f_{m}$$$denote basis, ADC, concentrations, relaxation parameters and frequency shift for that specific metabolite. $$$g$$$ is a global Gaussian lineshape parameter and $$$\varphi_{\mathrm{b}}$$$ captures b-value dependent phases. Note that different diffusion models can also be used depending on acquisitions and specific applications.
Results
In vivo experiments were performed on healthy volunteers on a 3T Prisma with IRB approval. The key parameters were FOV = 220×220×64 mm3, TR/TE=700/110ms, pulse triggering delay = 10ms, echo spacing for the EPSI readouts = 0.8ms, matrix size =32×32×8 (6.9×6.9×8 mm3), b values = [0,1500,3000] s/mm2, and diffusion time 28.8ms. To measure metabolite MD, 3 orthogonal DE directions were acquired ([1,1,-0.5], [1,-0.5,1] and [-0.5,1,1]), with ~2.5mins each scan. Data with more and higher b-values ([0, 800, 1600, 3200, 4000] s/mm2) were also collected for evaluating the performance of our method at more challenging DE conditions. Improved high-resolution 3D MD maps can be observed with results from proposed method showing much less artifact and more reasonable ADC ranges. Spatially-resolved DW spectra at different DE directions are shown in Fig 4. ADC maps for a single DE direction and some representative spectra from the 5 b-value data were shown in Fig. 5 to further demonstrate the performance of our DW-MRSI method.Conclusion
We extended a subspace-based DW-MRSI method using enhanced data acquisition and processing strategies. High-resolution, improved metabolite diffusion parameter maps can be produced in clinically feasible times. The proposed method should benefit from translation to ultra-high-field systems (for even higher resolutions) and be useful for various brain microstructure studies.Acknowledgements
This work was supported in part by NSF-CBET-1944249 and NIH-NIBIB-1R21EB029076A.References
[1] Ronen I et al., Diffusion‐weighted magnetic resonance spectroscopy. EMagRes. 2007:733-50.
[2] Posse S et al., Human brain: proton diffusion MR spectroscopy. Radiology. 1993; 188:719-25.
[3] Palombo M et al., Insights into brain microstructure from in vivo DW-MRS. NeuroImage. 2018; 182:97-116.
[4] Palombo M et al., New paradigm to assess brain cell morphology by diffusion-weighted MR spectroscopy in vivo. PNAS. 2016; 113:6671-6.
[5] Shemesh N et al., Metabolic properties in stroked rats revealed by relaxation-enhanced magnetic resonance spectroscopy at ultrahigh fields. Nat. Commun. 2014; 5:1-8.
[6] Ligneul C et al., Diffusion-weighted magnetic resonance spectroscopy enables cell-specific monitoring of astrocyte reactivity in vivo. NeuroImage. 2019; 191:457-69.
[7] Harada M et al., Diffusion-weighted in vivo localized proton MR spectroscopy of human cerebral ischemia and tumor. NMR Biomed 2002;15:69–74.
[8] Ercan AE et al., Glial and axonal changes in systemic lupus erythematosus measured with diffusion of intracellular metabolites. Brain 2016; 139:1447‐1457.
[9] Ercan AE et al., Diffusion‐weighted chemical shift imaging of human brain metabolites at 7T. Magn Reson Med. 2015; 73:2053-61.
[10] Fotso K et al., Diffusion tensor spectroscopic imaging of the human brain in children and adults. Magn Reson Med. 2017; 78:1246-56.
[11] Boer VO et al., Metabolite diffusion weighted imaging with golden angle radial echo planar spectroscopic imaging. In Proc. of ISMRM, 2019.
[12] Sarma MK et al., Diffusion-weighted echo planar spectroscopic imaging using semi‐LASER localization at 3T: a pilot study, In Proc. of ISMRM, 2021, pp. 283.
[13] Wang Z et al., High resolution volumetric diffusion-weighted MRSI using a subspace approach, In Proc. of ISMRM, 2021, pp. 37.
[14] Wetscherek A et al., Flow‐compensated intravoxel incoherent motion diffusion imaging. Magn Reson Med. 2015; 74:410-9.
[15] Aliotta E et al., Convex optimized diffusion encoding (CODE) gradient waveforms for minimum echo time and bulk motion–compensated diffusion‐weighted MRI. Magn Reson Med. 2017; 77:717-29.
[16] Lam F et al., Ultrafast magnetic resonance spectroscopic imaging using SPICE with learned subspaces. Magn Reson Med. 2020; 83:377-390
[17] Y. Chen et al., “Improved low-rank filtering of MR spectroscopicimaging data with pre-learnt subspace and spatial constraints,” IEEETrans Biomed Eng, 2019; 67: 2381–2388
[18] Li Y et al., A subspace approach to spectral quantification for MR spectroscopic imaging. IEEE. Trans. Biomed. Eng. 2017; 64:2486-2489.
Figures
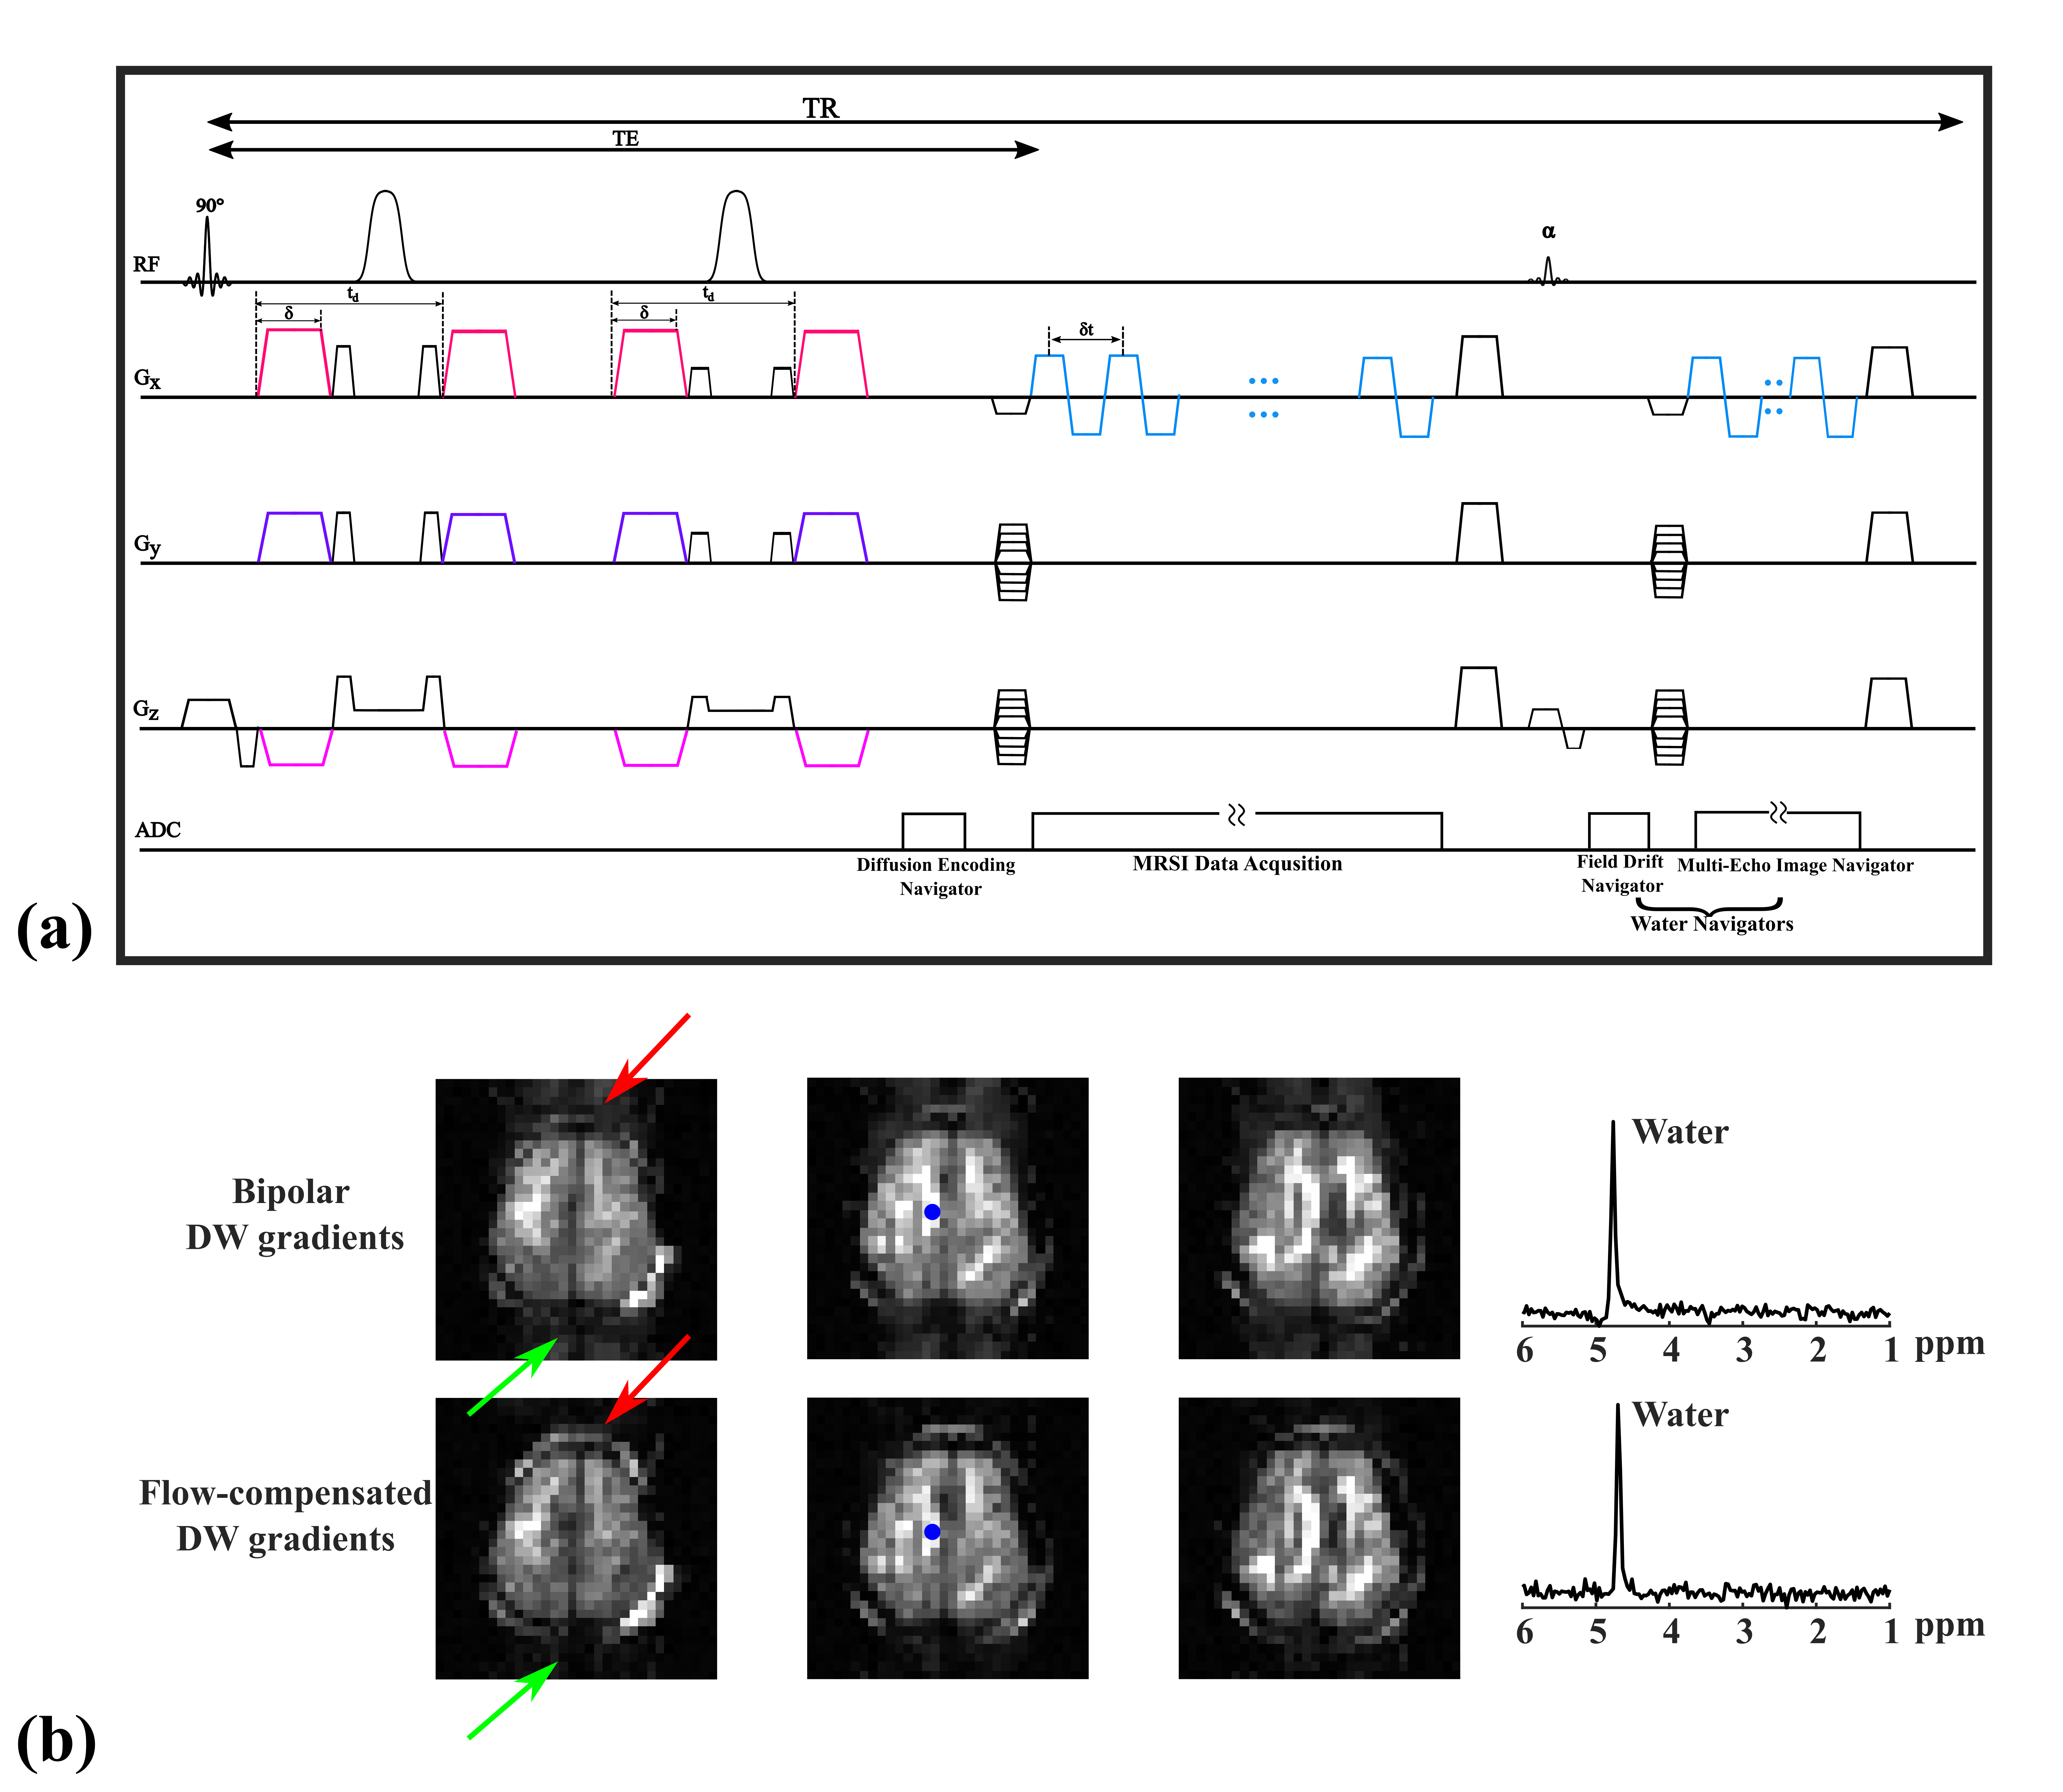
Figure1: Improved data acquisition with better data quality. (a) Flow-compensated (FC) DW gradient pairs were integrated into a double spin-echo DW-MRSI sequence. (b) Comparison of water images and spectra generated by DW-MRSI sequence using previously shown bipolar gradients13 (row 1) and FC gradients (row 2). Reduced ghosting artifacts (indicated by red and green arrows) and better water lineshapes can be observed, indicating better data quality.