3521
AUTOMATIC EVALUATION OF HIP ABDUCTOR MUSCLE QUALITY IN HIP OSTEOARTHRITIS
Alyssa Bird1, Francesco Caliva1, Sharmila Majumdar1, Valentina Pedoia1, and Richard B Souza1
1University of California, San Francisco, San Francisco, CA, United States
1University of California, San Francisco, San Francisco, CA, United States
Synopsis
The aim of this study was to reduce time-to-segmentation for analysis of muscle quality across a large volume of the hip abductors in individuals with hip osteoarthritis by developing an automatic segmentation network. The gluteus medius (GMED), gluteus minimus (GMIN), and tensor fasciae latae (TFL) were manually segmented on fat-water separated IDEAL MR images in 44 subjects. A 3D V-Net was trained, validated, and tested using these manually segmented image volumes and resulted in a mean Dice coefficient of 0.94, 0.87, and 0.91 for GMED, GMIN, and TFL. The automatic segmentation network demonstrated strong performance and provides drastically reduced time-to-segmentation.
Introduction
The aim of this study was to develop an automatic segmentation network to estimate hip abductor muscle quality of the gluteus medius (GMED), gluteus minimus (GMIN), and tensor fasciae latae (TFL) in individuals with mild-to-moderate hip osteoarthritis (OA). The motivation for this study lies in the time-consuming nature of manual muscle segmentation and the need for a tool which may more quickly estimate muscle quality throughout a large volume of the muscle while minimizing bias inherent to manual methods.Methods
Forty-four subjects (age 52.7±16.1 years, body mass index [BMI] 23.7±3.4 kg/m2, 14 males) with varying degrees of radiographic hip OA (Kellgren-Lawrence grade [KL] 0-3) provided informed consent as part of an ongoing study approved by the university’s Committee of Human Research. Hip MR images were obtained using a 3.0T MR scanner (GE Healthcare) with a 32-channel coil (GE Healthcare). MR sequences (Table 1) were acquired from iliac crest to greater trochanter and included 1) axial T1-weighted Fast Spin Echo (FSE) and 2) axial Iterative Decomposition of water and fat with Echo Asymmetry and Least-squares estimation spoiled gradient (IDEAL SPGR).1 Manual segmentation of GMED, GMIN, and TFL was performed on all slices of the T1-weighted image from iliac crest to greater trochanter, and the segmentation masks were transferred to the IDEAL image volumes. Time to segment a single image volume ranged from 2-3 hours. Manual segmentations were performed by a single researcher with intraclass correlation coefficient 0.94 – 0.99. The 44 manually segmented IDEAL image volumes and their corresponding muscle masks were divided into training (29 volumes), validation (8 volumes), and testing (7 volumes) sets, ensuring no significant differences in age, gender, BMI, or KL grade across the splits. The dataset was used to train and validate a 3D V-Net convolutional neural network (CNN).2 The test set was treated as a holdout dataset which was never used for network optimization and served only as a measure of final network performance. Image volumes and muscle masks were augmented to train the model to be invariant to anatomical heterogeneity in muscle shape and size. Augmentation transforms were randomly applied to images and their corresponding masks and included various combinations of 3D rotation, 3D affine deformation, and 3D B-spline deformations. To train the 5-level V-Net comprising 1, 2, 3, 3, and 3 consecutive convolutions per level, a combination of weighted cross-entropy (class weights = 0.85, 1, 2, 0.005 for tissue GMED, GMIN, TFL, and background, respectively) with Dice loss minimized, using Adam optimizer, learning rate = 1x10⁻⁴, 0.05 dropout probability and batch size = 1. Training to convergence required 92 epochs for 15 hours on an NVIDIA Titan X GPU. Labeled IDEAL image volumes were used as input to the V-Net and the network generated a corresponding 4-class prediction mask for GMED, GMIN, TFL, and background on each of the input image slices. All prediction masks generated by the model underwent post-processing, which involved removal of extra pixels from the mask by keeping only the largest connected component, extraction and dilation of the perimeter of the mask using a structuring disk element (radius = 1), and filling of holes within the mask. Overlap between manual and automatic masks was used as a performance metric and was evaluated using Dice similarity coefficient. A fat fraction (FF) map was calculated for each image volume whereby the FF of each voxel was computed using the equation FF = SFat/ SFat + SWater, where SFat is the signal from the fat only image and SWater is the signal from the water only image.3 The overall FF of each muscle was calculated by taking the average signal of the FF map in the segmented region. Agreement between the manual and automatic FF and volume of each muscle was evaluated using Pearson’s correlation coefficient and Bland-Altman plots. All statistical analyses were performed in R Studio v4.0.2 (R Core Team).Results
The automatic segmentation network resulted in a mean Dice coefficient of 0.94, 0.87, and 0.91 for GMED, GMIN, and TFL, respectively. An example of manual and automatic segmentation masks across the entire volume of each muscle can be seen in Figure 1. Agreement between FF and volume measures derived from manual and automatic segmentation methods are shown in Figure 2. Pearson’s correlation coefficient between manual and automatic methods was 0.959 for FF and 0.999 for volume.Discussion
The V-Net demonstrated good performance in automatic segmentation of the hip abductor muscles across all image slices. Performance was comparable to previously reported Dice coefficients of 0.90, 0.88, and 0.91 for GMED, GMIN, and TFL using a 3D V-Net which automatically segmented only 6 slices of each muscle.4 Strong agreement was observed between FF and volume metrics derived from manual and automatic segmentation methods for all muscles.Conclusion
These results demonstrate that hip abductor FF and volume can be quickly and accurately estimated across nearly the entire muscle length without the need for laborious manual segmentation. The ability to automatically estimate hip abductor muscle quality will allow future studies to further explore relationships between muscle quality and joint health in large cohorts of individuals with hip OA, as the time to complete the analysis is drastically reduced.Acknowledgements
The authors would like to gratefully acknowledge the work of Claudia Iriondo for her pivotal role in the development of the DioscoriDESS framework which enabled the development of the automatic segmentation network.References
- Gerdes CM, Kijowski R, Reeder SB. IDEAL imaging of the musculoskeletal system: robust water fat separation for uniform fat suppression, marrow evaluation, and cartilage imaging. AJR Am J Roentgenol. 2007; 189: W284-291.
- Milletari, F., Navab, N., & Ahmadi, S. A. (2016, October). V-net: Fully convolutional neural networks for volumetric medical image segmentation. In 2016 fourth international conference on 3D vision (3DV) (pp. 565-571). IEEE.
- Reeder SB, Sirlin CB. Quantification of liver fat with magnetic resonance imaging. Magn Reson Imaging Clin N Am. 2010; 18: 337-357, ix.
- Tibrewala R, Pedoia V, Lee J, Kinnunen C, Popovic T, Zhang AL, Link TM, Souza RB, Majumdar S. Automatic hip abductor muscle fat fraction estimation and association with early OA cartilage degeneration biomarkers. J Orthop Res. 2021; 39: 2376:2387.
Figures

Table 1. Magnetic resonance (MR) imaging sequence parameters. Abbreviations: IDEAL, Iterative Decomposition of water and fat with Echo Asymmetry and Least-squares estimation; SPGR, Spoiled Gradient; FSE, Fast Spin Echo; TR, Repetition time; ETL, Echo Train Length; FA, Flip Angle; FOV, Field of View; TE, Echo Time; TSL, Time of Spin Lock; ETL, Echo Train Length.
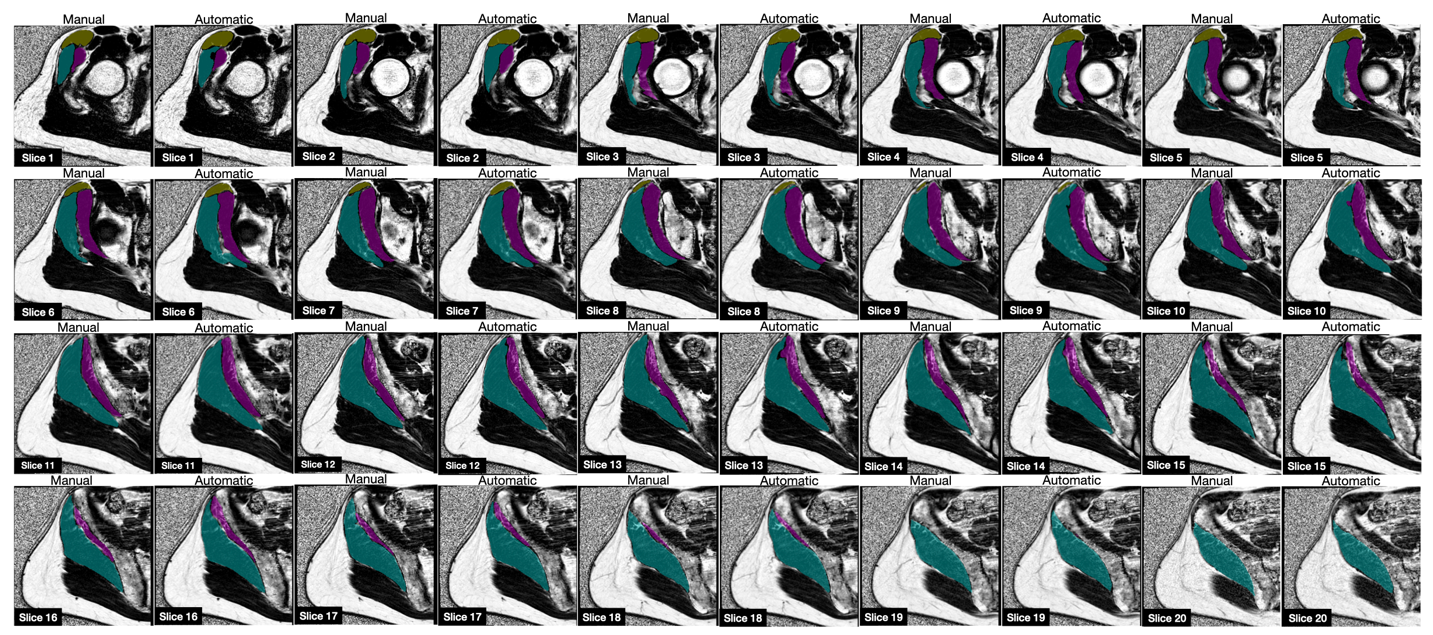
Figure 1. Manual and automatic segmentation masks generated by the 3D V-Net are shown overlaid on the IDEAL sequence fat fraction maps. Gluteus Medius (GMED) is shown in teal, gluteus minimus (GMIN) in magenta, and tensor fasciae latae (TFL) in yellow.
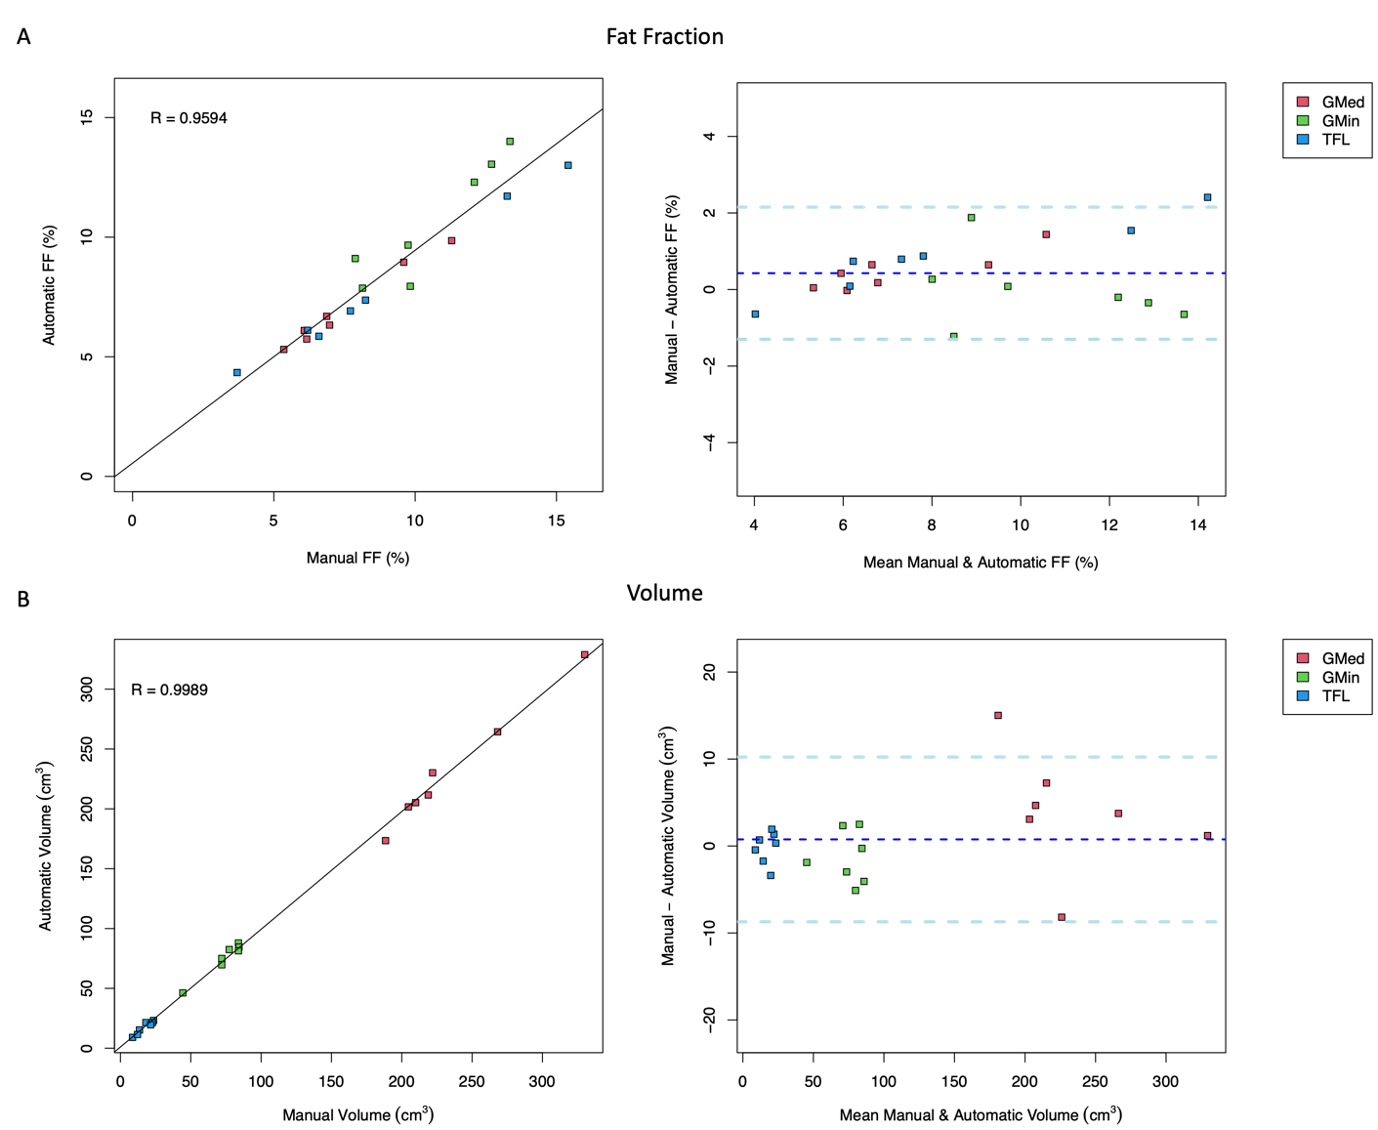
Figure 2. Agreement between muscle quality measures derived from manual and automatic segmentation methods is shown for A) fat fraction (FF) and B) volume using Pearson’s correlation (left) and Bland-Altman plots (right) for the gluteus medius (GMED), gluteus minimus (GMIN), and tensor fasciae latae (TFL).
DOI: https://doi.org/10.58530/2022/3521