3515
A k-space transformer network for undersampled radial MRI1Department of Radiological Sciences, University of California Los Angeles, Los Angeles, CA, United States, 2Department of Physics and Biology in Medicine, University of California Los Angeles, Los Angeles, CA, United States, 3Department of Bioengineering, University of California Los Angeles, Los Angeles, CA, United States, 4MR R&D Collaborations, Siemens Medical Solutions USA, Inc., Los Angeles, CA, United States
Synopsis
Deep learning-based undersampled MRI reconstruction generally requires the k-space data consistency term to constrain the output. However, this requires gridding onto a Cartesian basis for radial data, which slows down the training process profoundly and may even make it impractical. To avoid the repeated gridding process in training, we developed a transformer network to directly predict unacquired radial k-space spokes. The developed network was evaluated in vivo, accurately predicted the unacquired k-space spokes and generated better image intensity and less streaking artifacts compared to the undersampled images.
INTRODUCTION
In deep learning-based undersampled MR image reconstruction, enforcing k-space data consistency has been a common practice of constraints to generate better output.1,2 Non-Cartesian trajectories often need gridding to convert the non-Cartesian k-space basis into a Cartesian one. Gridding is a very time-consuming operation and when it is performed in each iteration of the deep learning network training, the process is slowed to the point where it may no longer be feasible.3,4 To avoid gridding and thereby improve the network training performance, we propose a transformer network5 to directly predict unacquired k-space spokes from the acquired ones.METHODS
Data acquisition and preparationThe study was HIPAA compliant and approved by the Institutional Review Board. With written informed consent from each subject, we acquired MRI data using a prototype golden-angle, gradient-echo stack-of-radial sequence from 17 healthy volunteers in the abdomen, pelvis, thigh and leg (16 on MAGNETOM 3.0T Prismafit and 1 on MAGNETOM 3.0T Skyra, Siemens Healthcare, Erlangen, Germany). The parameters were: reconstructed matrix size = 256x256, 3500 spokes per partition, 32 partitions.
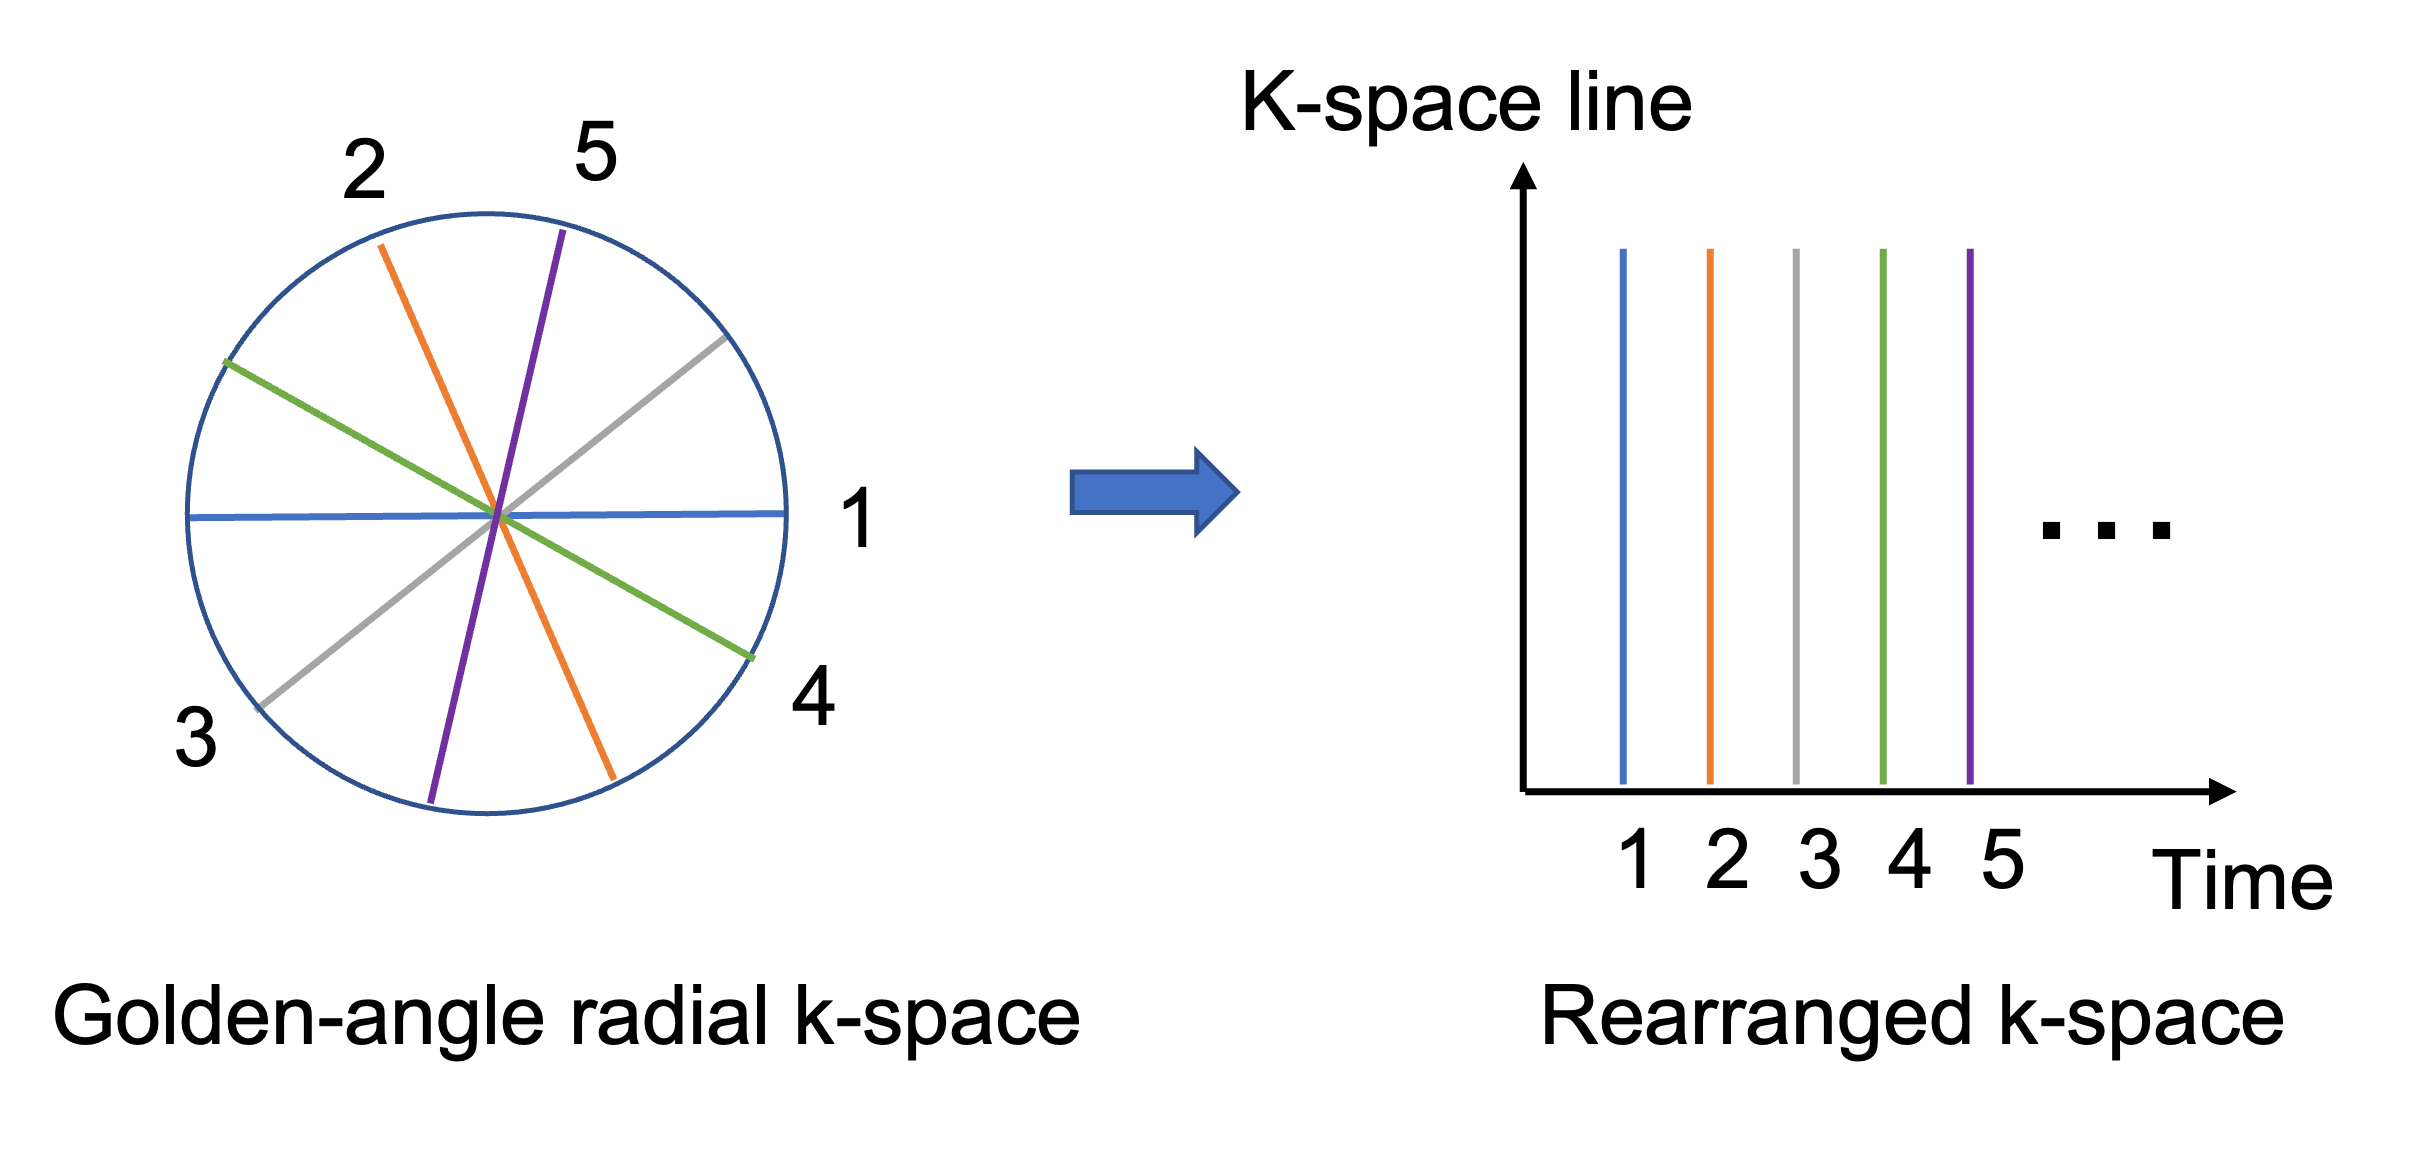
The 3D k-space data was first Fourier transformed to 2D multi-slice k-space. Each 2D golden-angle k-space line from each coil was rearranged based on the chronological order of the acquisition moment, as illustrated in Figure 1. We generated network training data by using the first 100 acquired radial spokes as input and the consecutively acquired 100 spokes as the ground truth for output. The real and imaginary parts of the complex k-space data were concatenated in the same single vector. The input and output were of size 1024x100.
We divided the data into training (8 subjects), validation (2 subjects) and testing (7 subjects) datasets. Because our approach dealt with radial spokes instead of images, although the number of subjects was relatively small in this study, the multi-coil data size was considerably large, comprising 257040 training data, 81600 validation data and 254320 testing data.
Network Architecture and Training
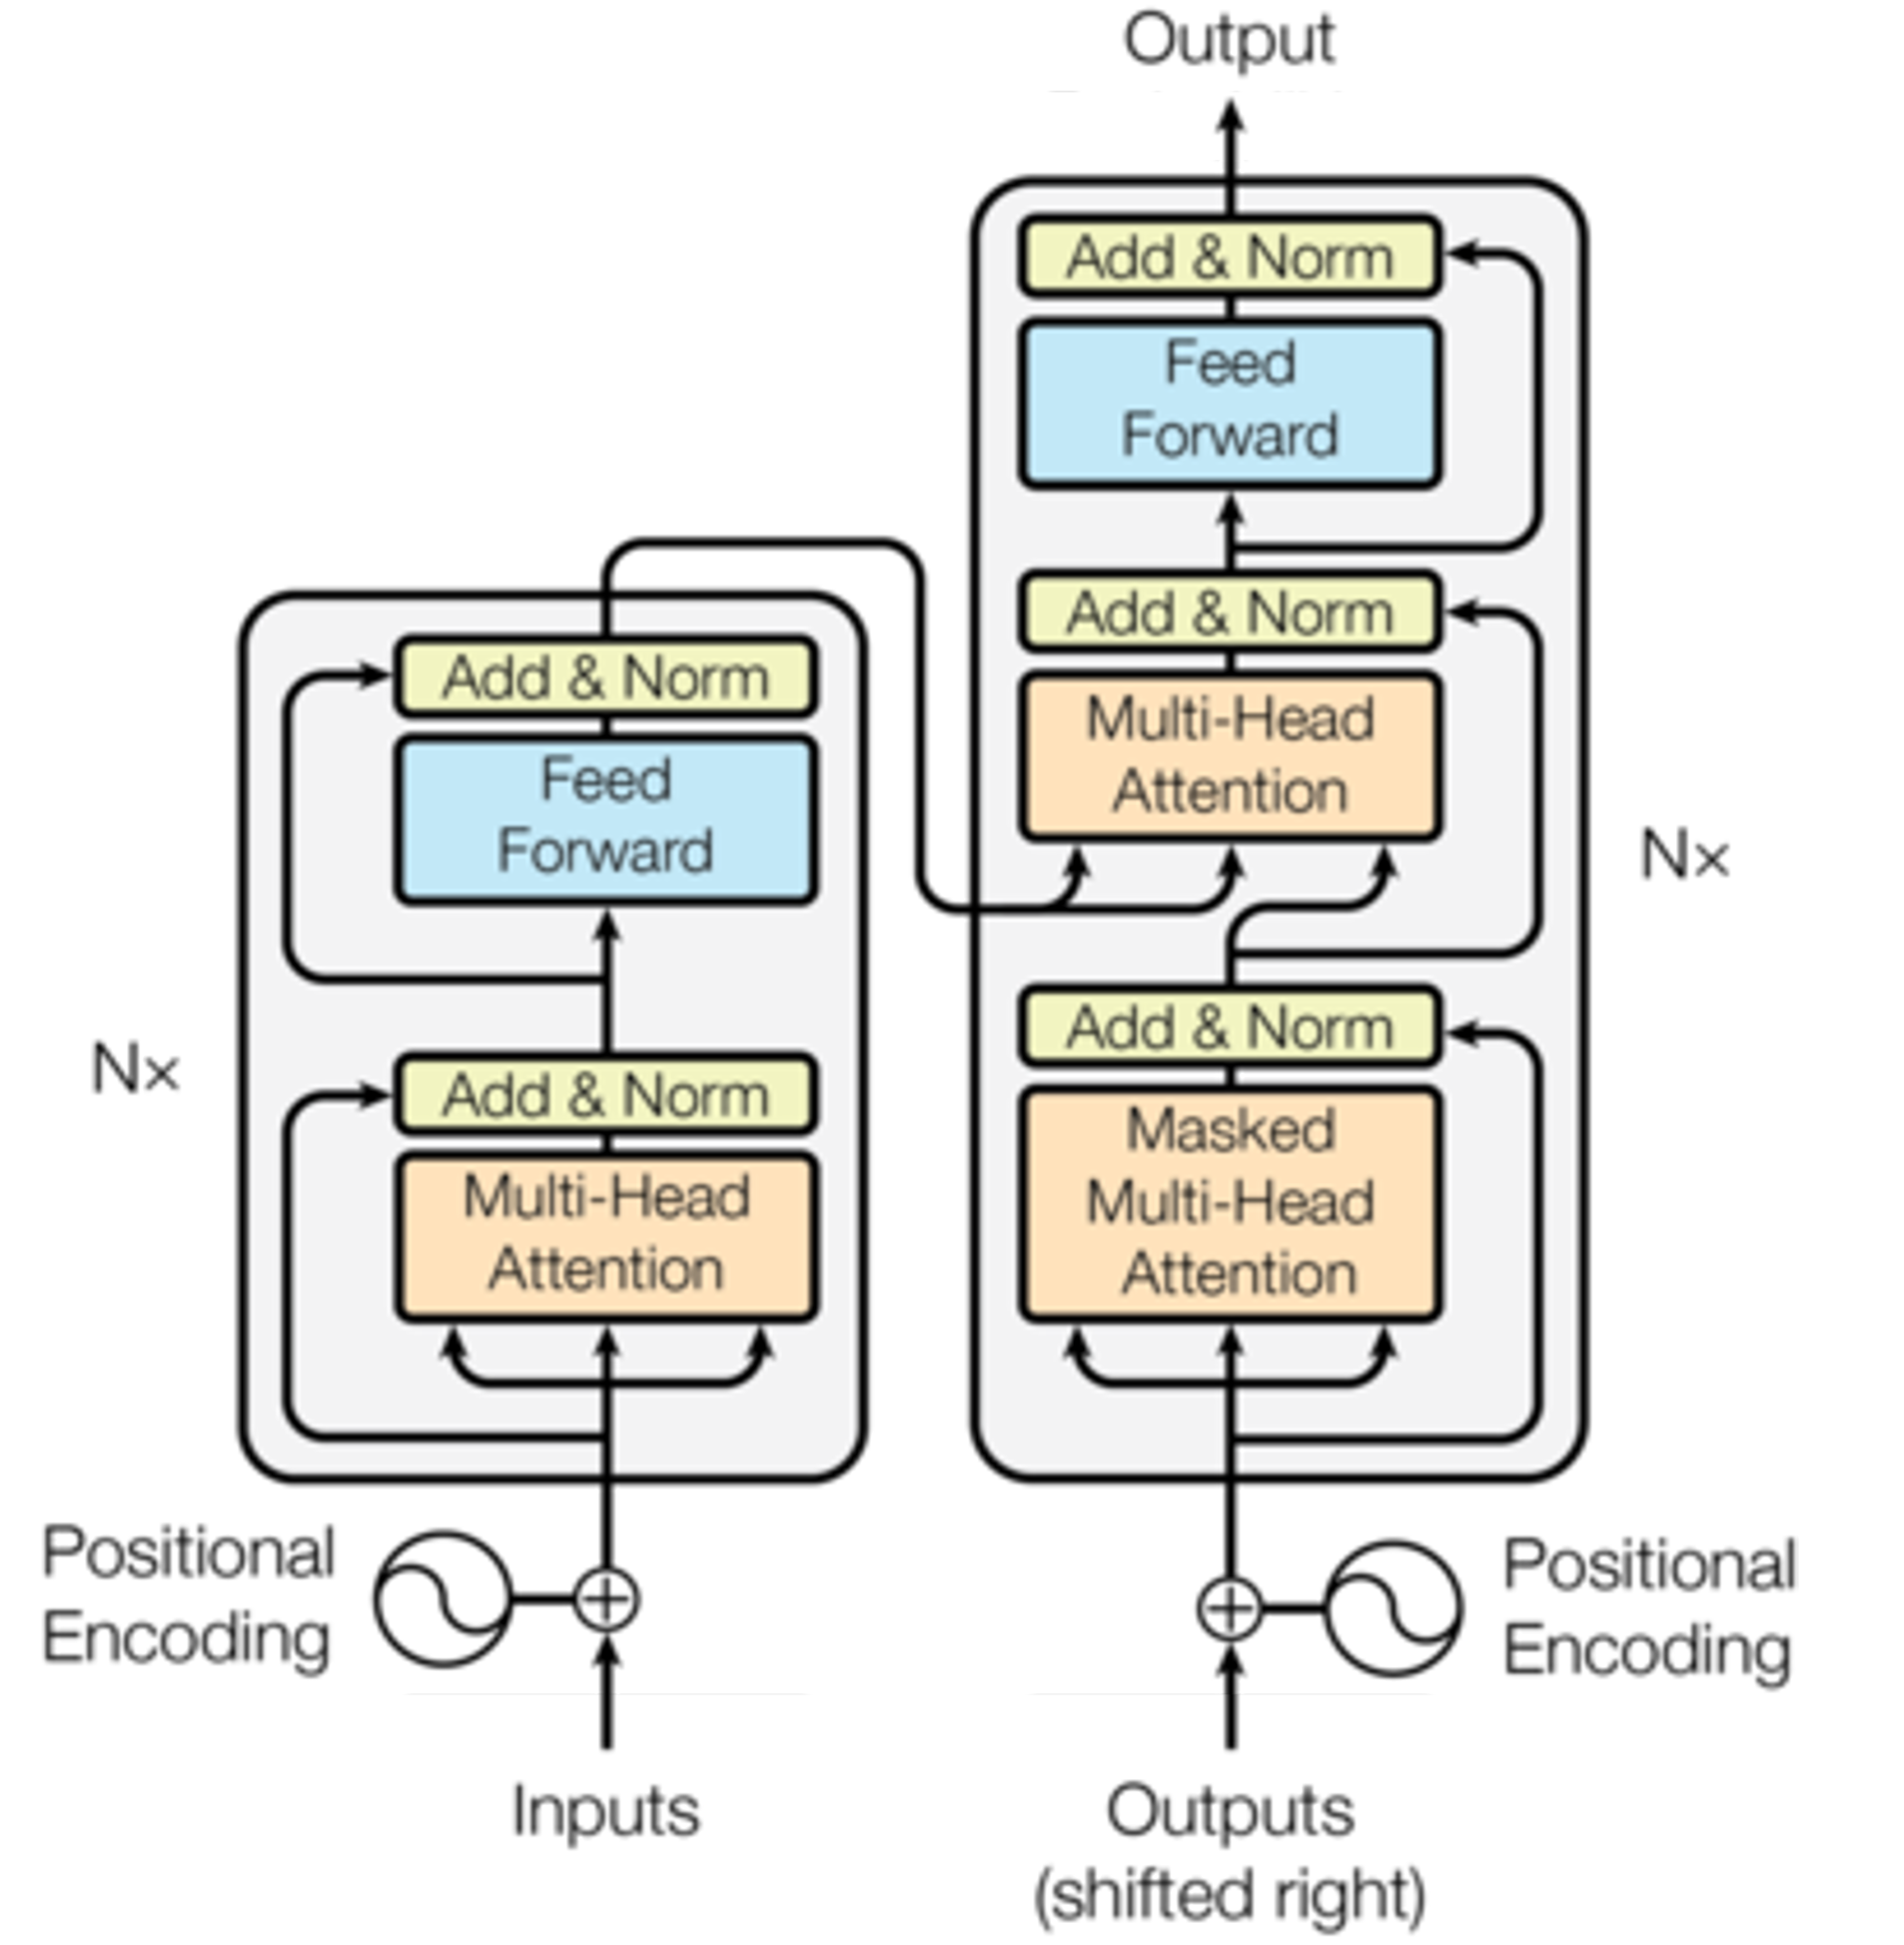
The proposed network was modified based on the transformer network.5 As shown in Figure 2, the transformer consisted of an encoder and a decoder, each consisting of multi-head attention and feed forward modules. The multi-head attention module used queries, keys and values to learn the correlation between each input k-space spoke. Positional encoding of the input and output represented the angle information of each radial spoke. Mean-squared-error (MSE) loss was used for training.
Implementation and training of the proposed network were completed in Python 3.7.7 using the Pytorch library 1.8.1 on a computer with two NVIDIA V100 GPUs. The network was trained for 100 epochs with a batch size of 400. The Adam optimizer6 with $$$\beta_1=0.9$$$, $$$\beta_2=0.98$$$, and $$$\epsilon=10^{-9}$$$ was used. The hyperparameters were $$$d_{model}=1024$$$, 16 heads of attention, keys and values had 64 dimensions. The total training time was 58 hours.
Image Quality Evaluation
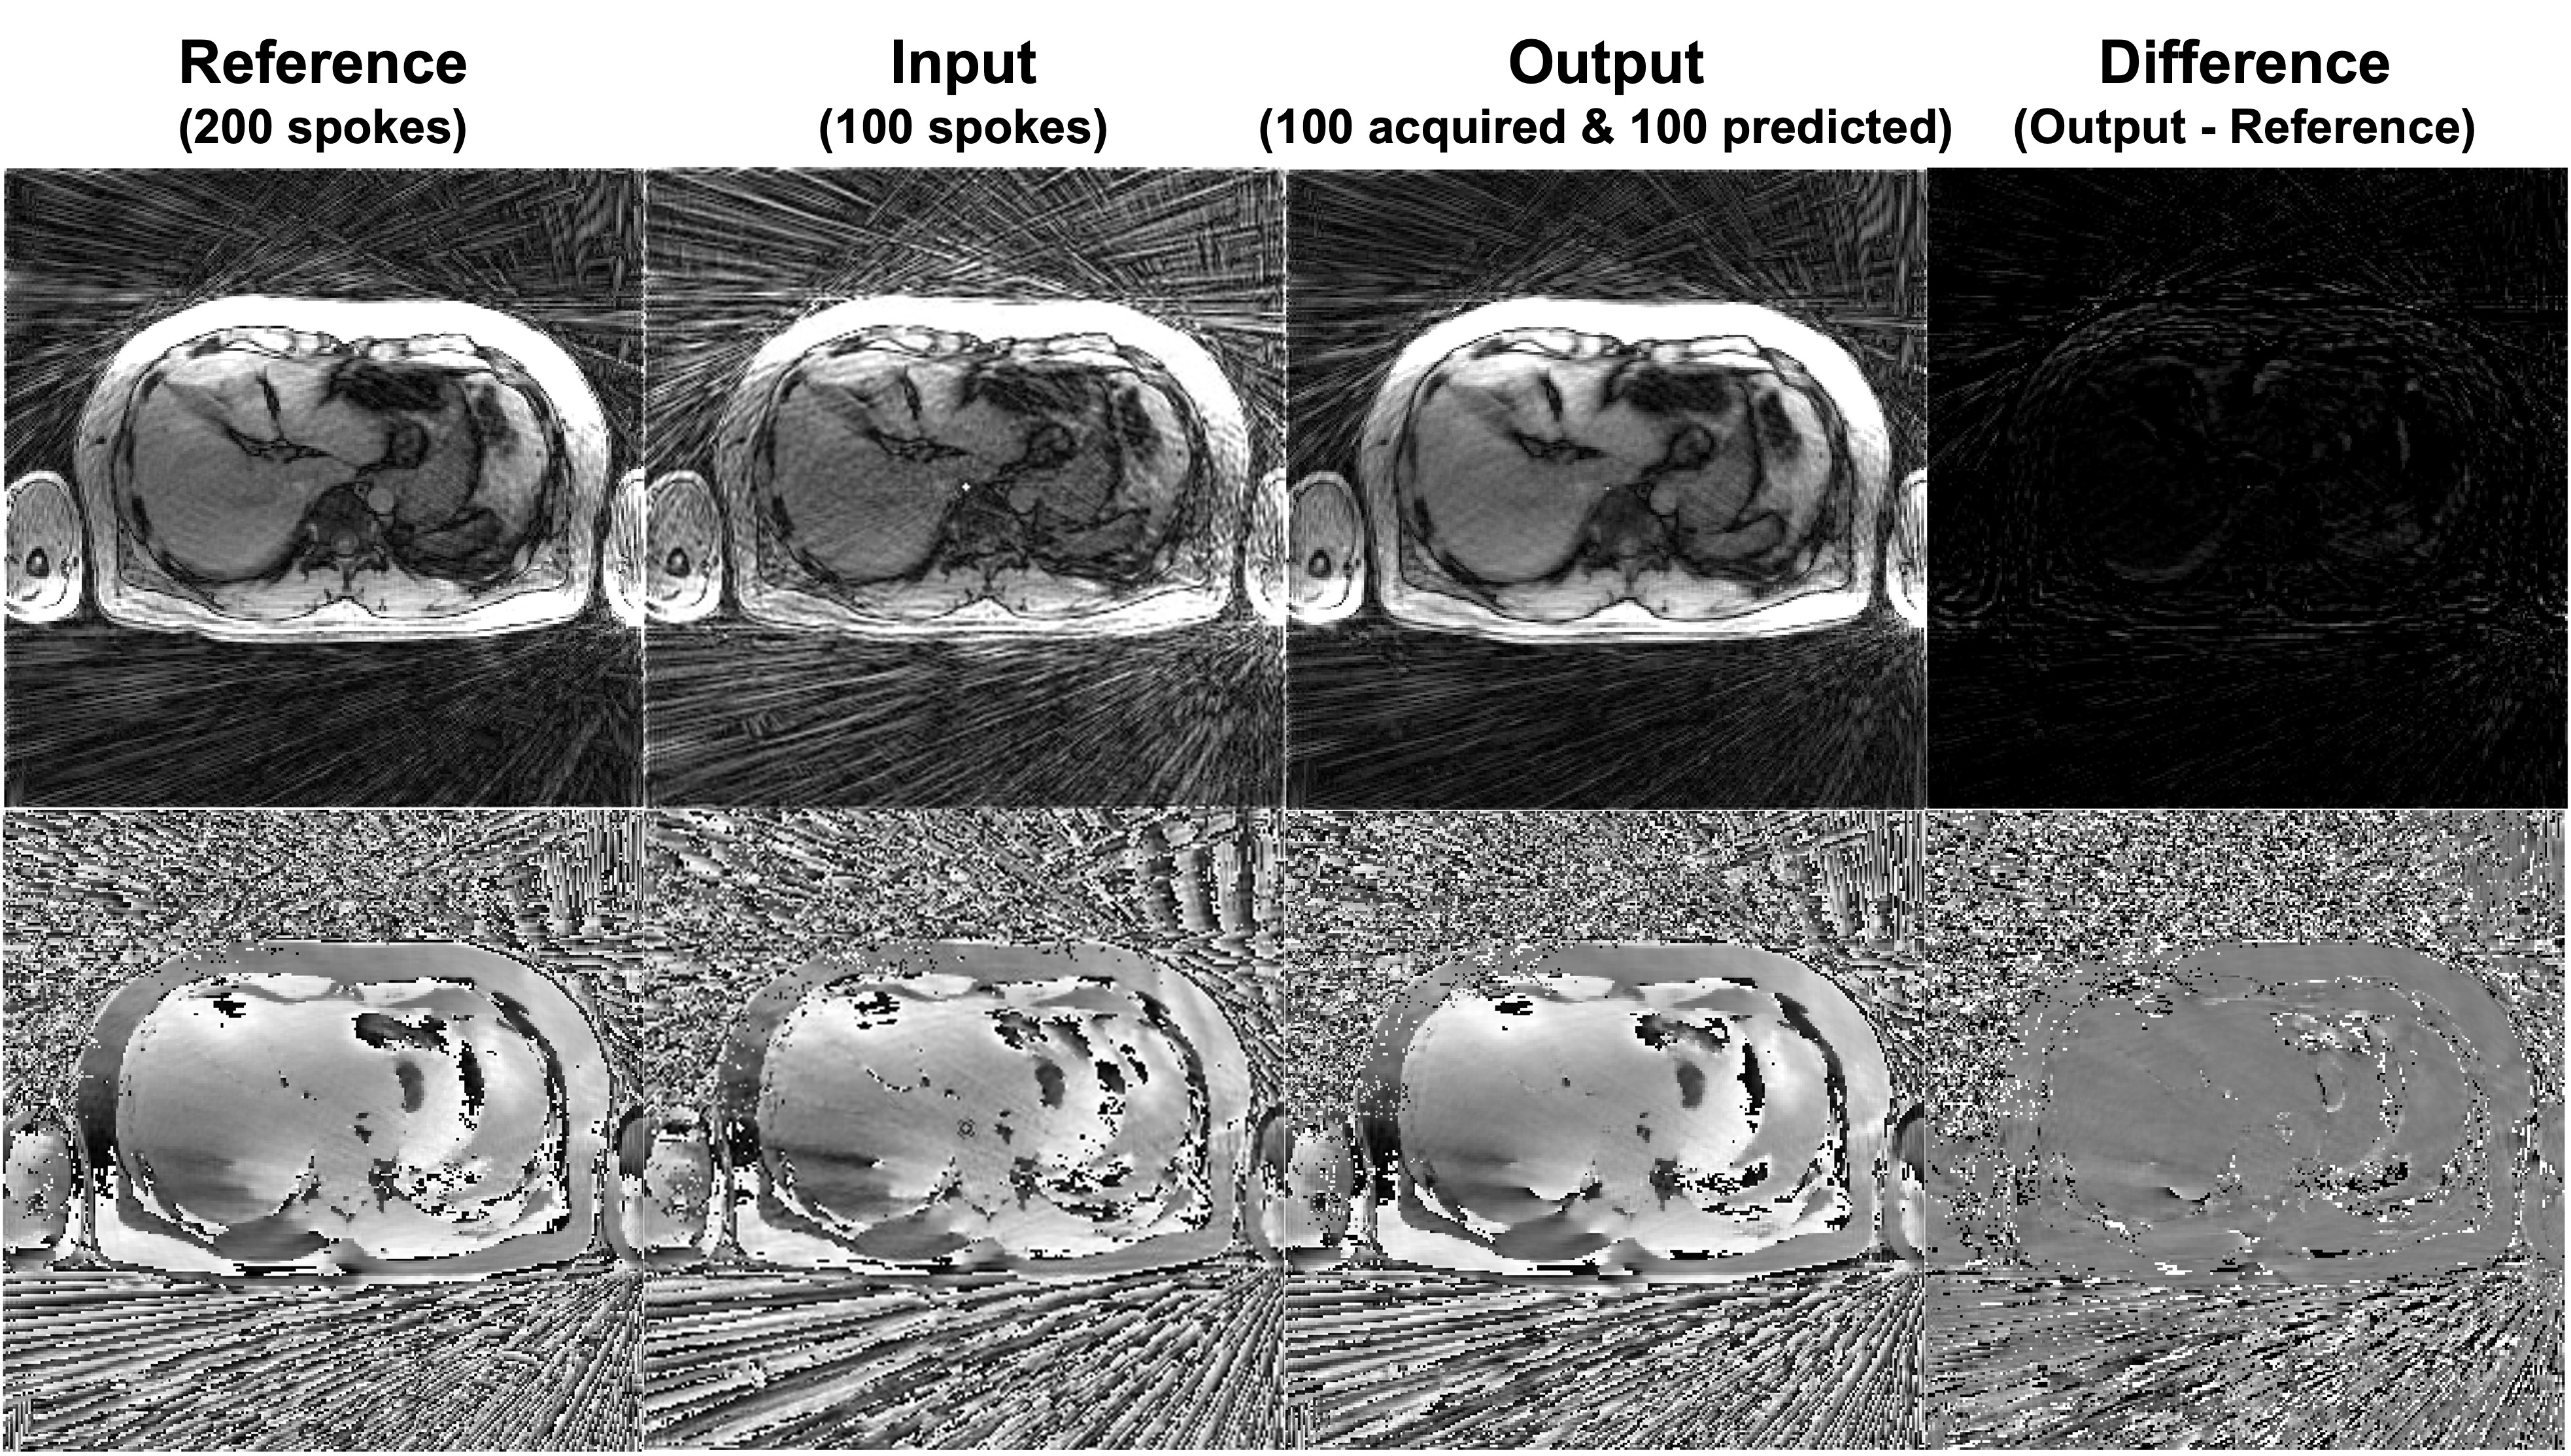
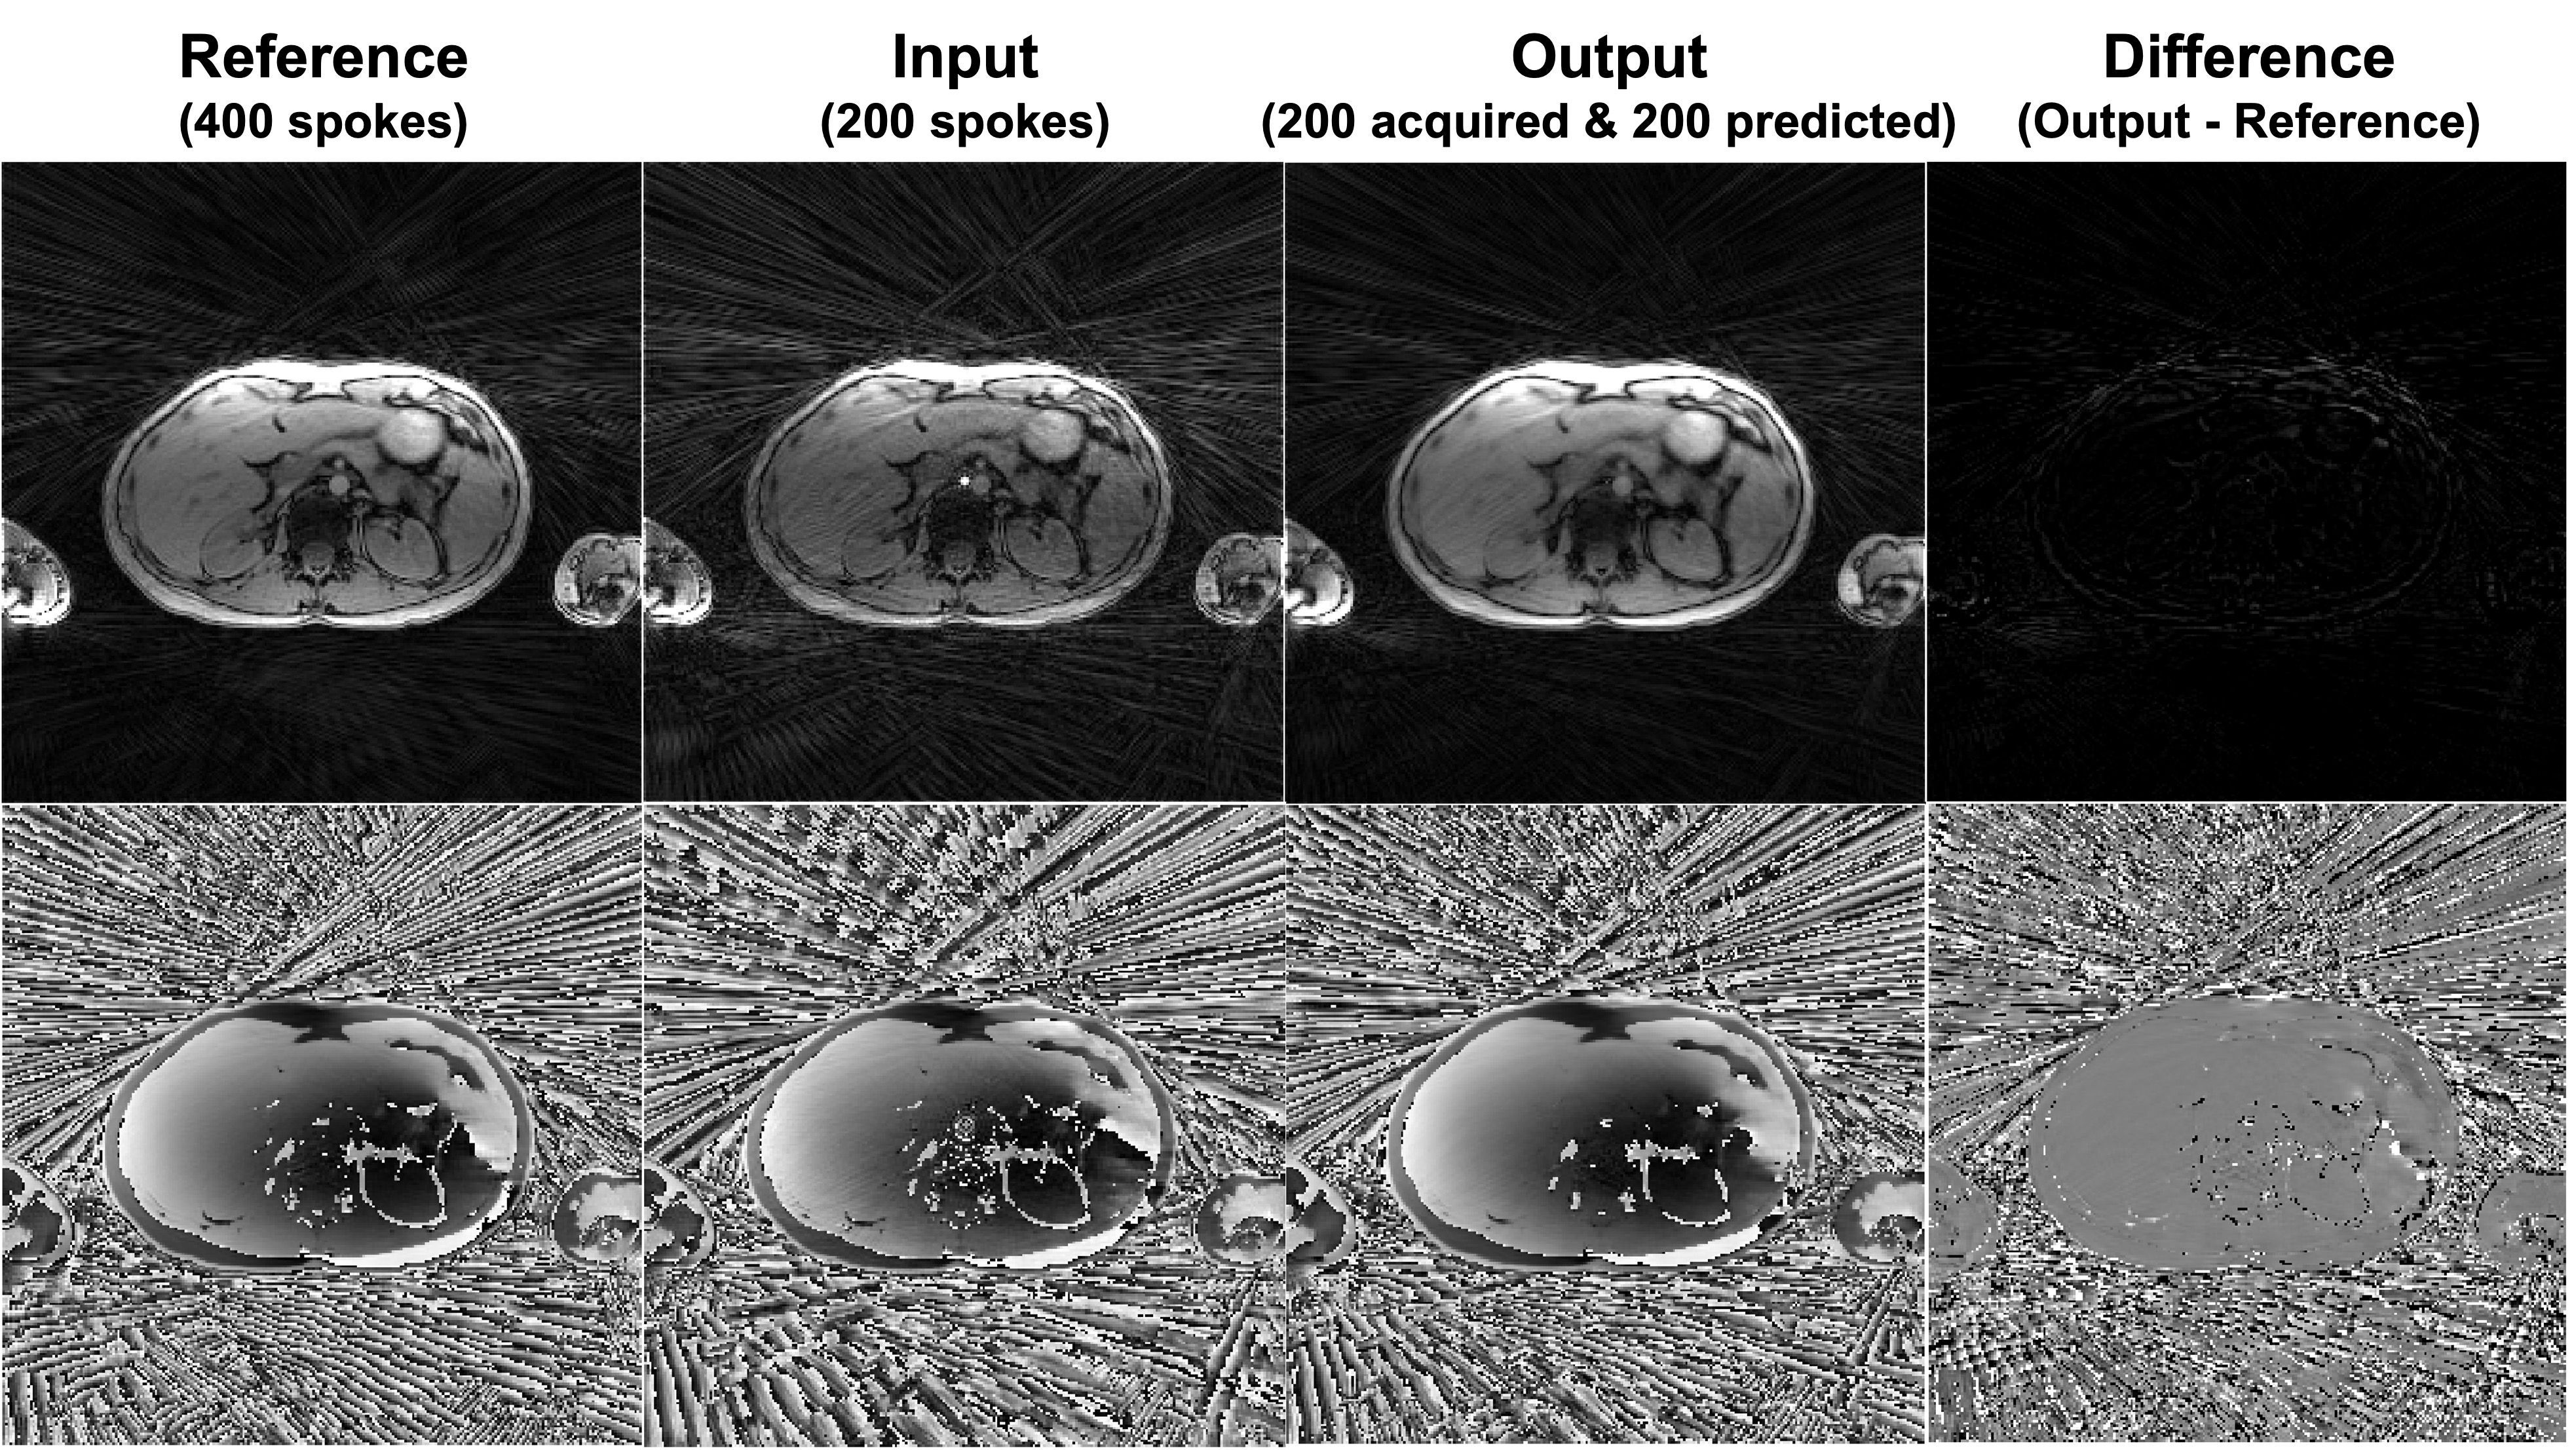
The reference data containing 200 spokes was regarded as the full k-space acquisition and was used to reconstruct the reference standard image. The 100 spokes from the input and the 100 spokes from the output were combined to form a complete k-space to reconstruct the output image. All images were NUFFT reconstructed using the Bart toolbox7 and adaptive coil combination8. Comparison on the k-space data and the reconstructed images were performed by calculating the differences between the output and the reference.
Normalized MSE (NMSE) and structural similarity index (SSIM) were used to quantitatively evaluate the images with respect to the reference. Region-of-interest (ROI) analysis was performed by calculating mean and standard deviation (SD) of two ROIs in three slices in liver dome, mid-liver and inferior liver. Coefficient of variation (CV=SD/mean) was further calculated to evaluate the streaking artifacts.
RESULTS
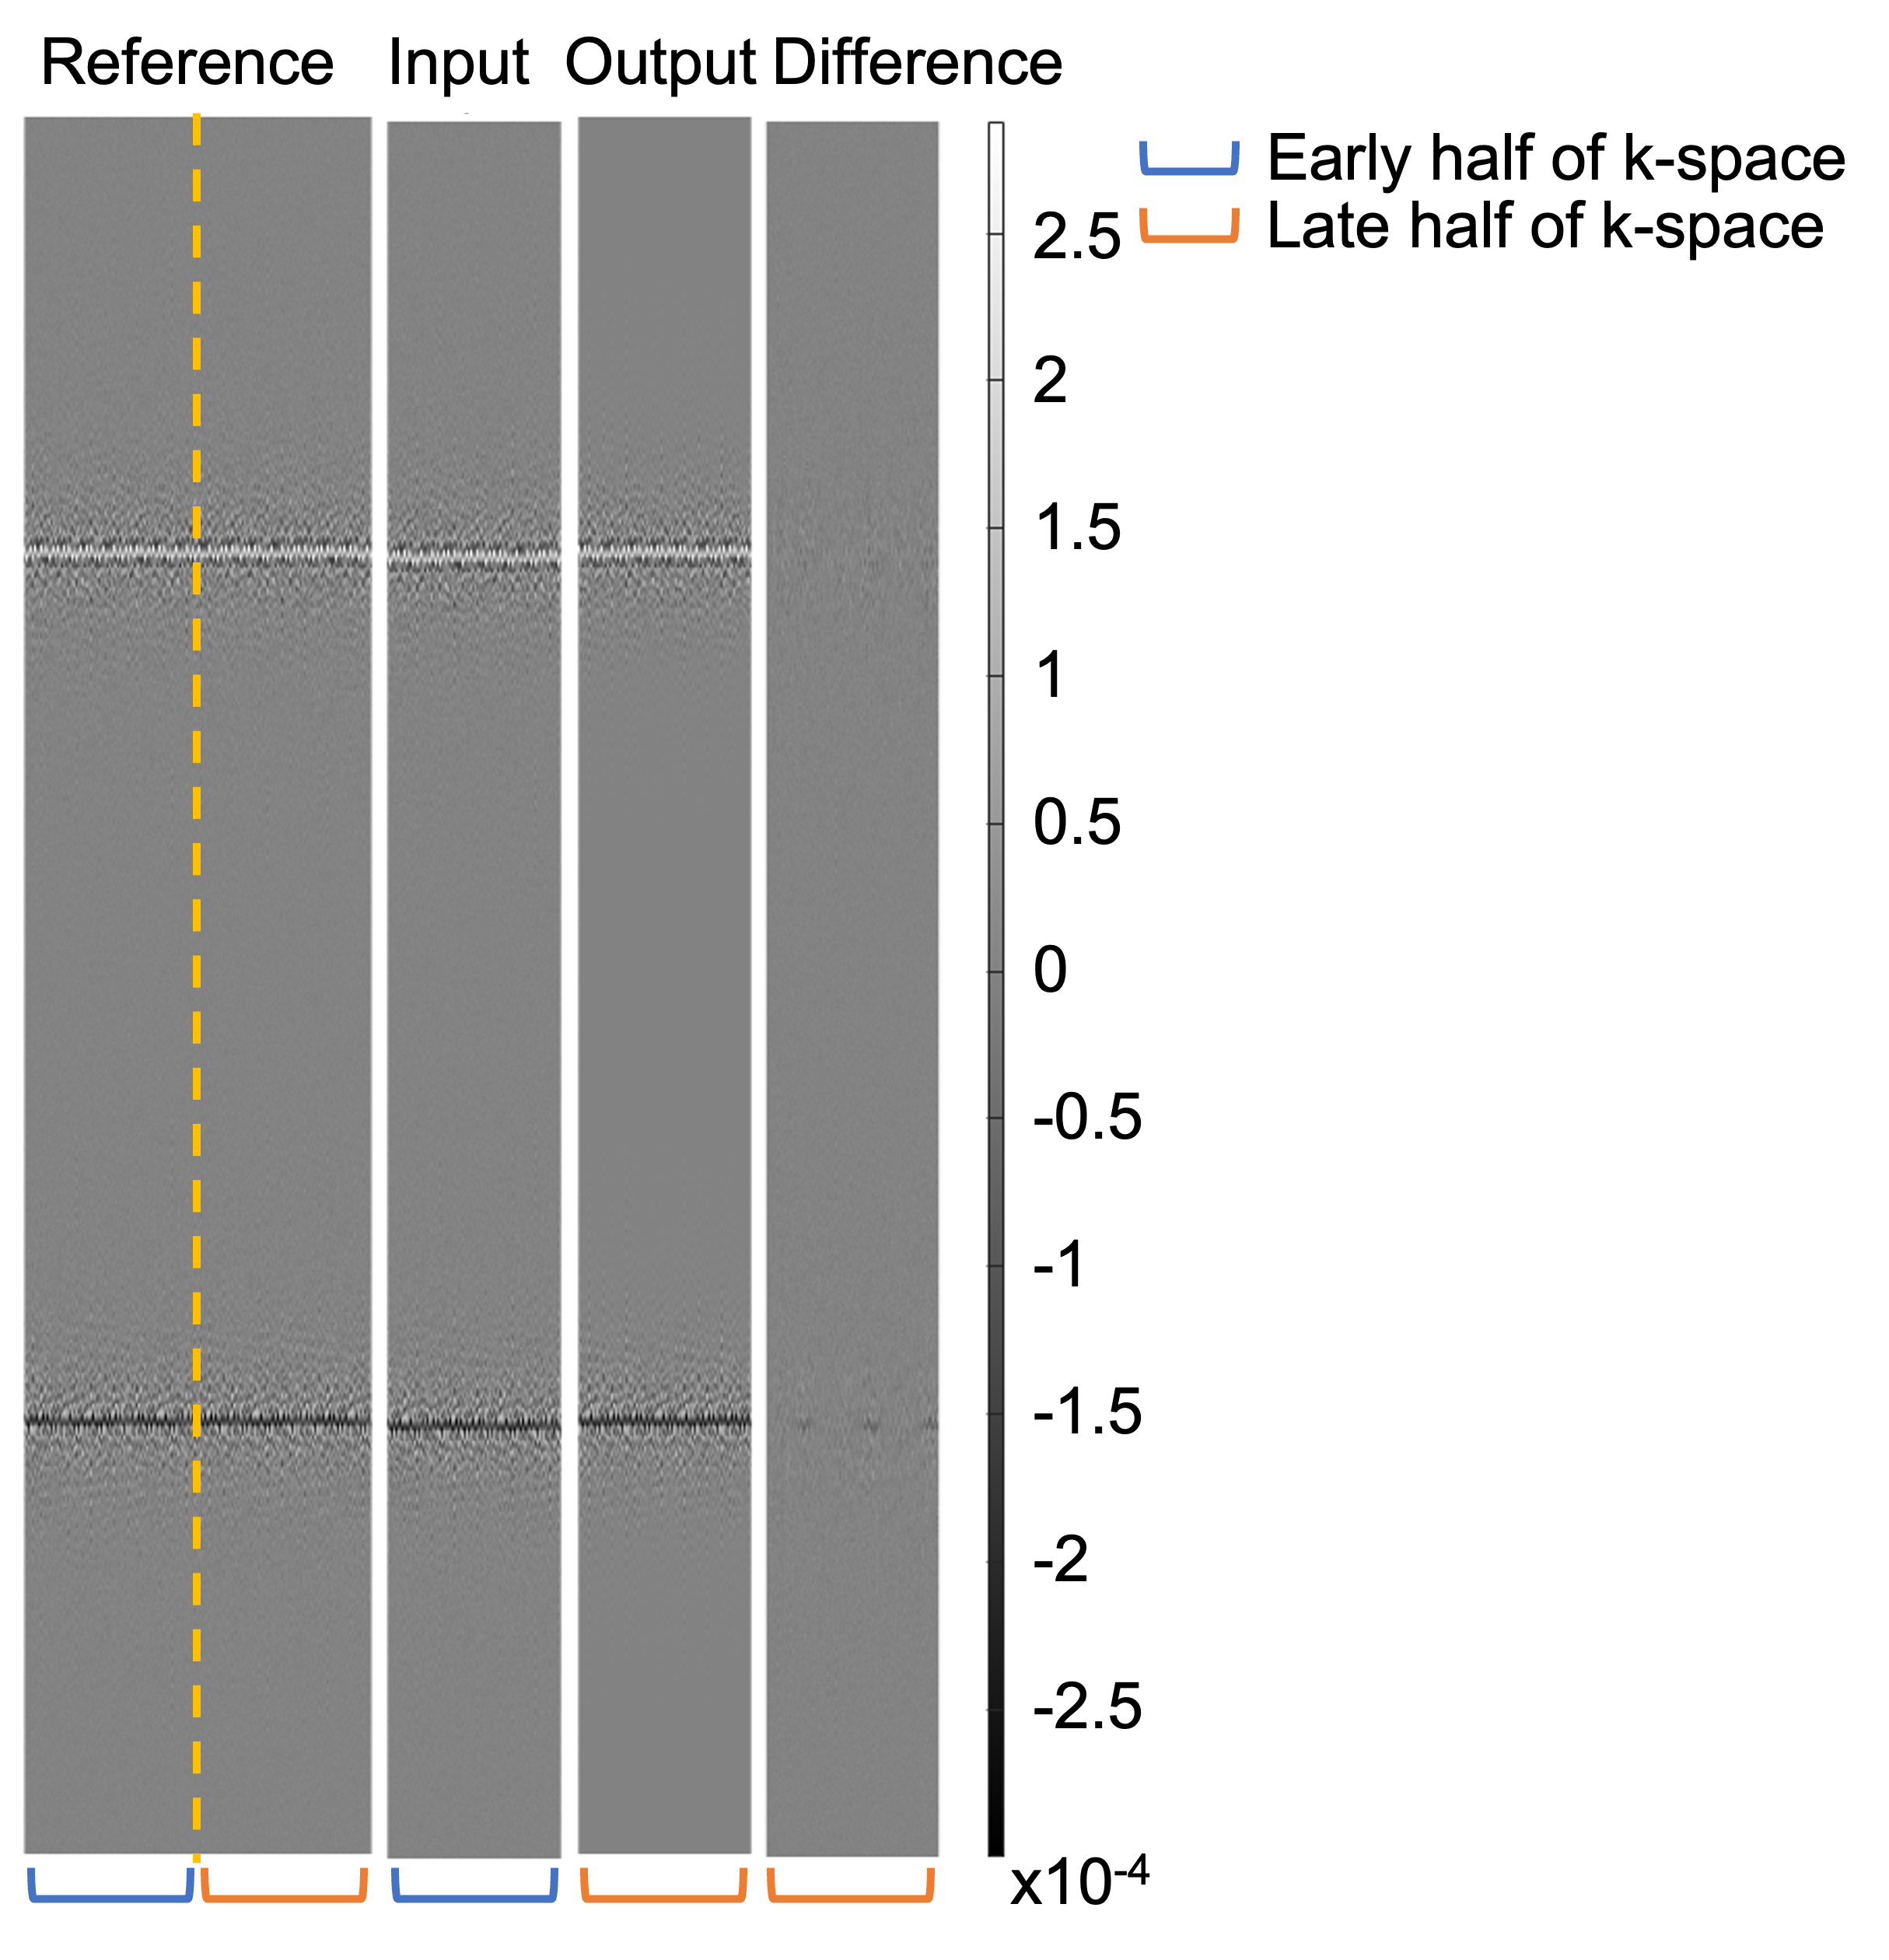
Figure 3 shows an example of the output compared to the reference. The predicted k-space is very similar to the late half of the reference and the difference map shows little error. An example of the images reconstructed with the complete k-space of 200 radial spokes is shown in Figure 4. Another example images with the complete k-space of 400 radial spokes were reconstructed and shown in Figure 5. The images reconstructed by incorporating the predicted k-space greatly reduce the streaking artifacts compared to the input images and achieve similar image appearance to the reference images.The proposed method had lower NMSE values (0.0282±0.0073) than the input (0.2133±0.0079) and higher SSIM values (0.8878±0.0360) than the input (0.7853±0.0434). The input had a lower signal mean in the liver (148.00±31.42) compared to the reference (287.85±63.16), likely due to the lower signal-to-noise ratio (SNR) by fewer radial spokes, and the proposed method increased the mean (288.29±61.01) and was similar to the reference. As a measure of the streaking artifacts, the input had a higher CV in the liver (0.11±0.03) compared to the reference (0.07±0.02) and the proposed method (0.07±0.02) reduced the variation and was similar to the reference.
DISCUSSION AND CONCLUSION
In this study, a radial k-space transformer network was proposed and developed to predict unacquired k-space radial spokes from acquired k-space radial spokes. Preliminary in vivo experiments showed promising results similar to those of the reference images. This proposed network has applications in undersampled radial MRI reconstruction for improved image intensity and reduced streaking artifacts.Acknowledgements
This study was supported in part by Siemens Medical Solutions USA, Inc and the Department of Radiological Sciences at UCLA.References
1. Hyun CM, Kim HP, Lee SM, Lee S, Seo JK. Deep learning for undersampled MRI reconstruction. Physics in Medicine & Biology. 2018 Jun 25;63(13):135007.
2. Yang G, Yu S, Dong H, Slabaugh G, Dragotti PL, Ye X, Liu F, Arridge S, Keegan J, Guo Y, Firmin D. DAGAN: Deep de-aliasing generative adversarial networks for fast compressed sensing MRI reconstruction. IEEE transactions on medical imaging. 2017 Dec 21;37(6):1310-21.
3. Malavé MO, Baron CA, Koundinyan SP, Sandino CM, Ong F, Cheng JY, Nishimura DG. Reconstruction of undersampled 3D non‐Cartesian image‐based navigators for coronary MRA using an unrolled deep learning model. Magnetic resonance in medicine. 2020 Aug;84(2):800-12.
4. Kofler A, Haltmeier M, Schaeffter T, Kolbitsch C. An end‐to‐end‐trainable iterative network architecture for accelerated radial multi‐coil 2D cine MR image reconstruction. Medical Physics. 2021 May;48(5):2412-25.
5. Vaswani A, Shazeer N, Parmar N, Uszkoreit J, Jones L, Gomez AN, Kaiser Ł, Polosukhin I. Attention is all you need. In Advances in neural information processing systems 2017 (pp. 5998-6008).
6. Kingma DP, Ba J. Adam: A method for stochastic optimization. arXiv preprint arXiv:1412.6980. 2014 Dec 22.
7. Uecker M, Tamir JI, Ong F, Lustig M. The BART toolbox for computational magnetic resonance imaging. ISMRM: Concord, CA, USA. 2016.
8. Walsh DO, Gmitro AF, Marcellin MW. Adaptive reconstruction of phased array MR imagery. Magnetic Resonance in Medicine. 2000 May;43(5):682-90.
Figures