3513
Automated Quantification of Ventilation Defects and Heterogeneity in 3D Isotropic 129Xe MRI1School of Biomedical Engineering, The University of Western Ontario, London, ON, Canada, 2Sunnybrook Research Institute, University of Toronto, Toronto, ON, Canada, 3Physics and Astronomy, The University of Western Ontario, London, ON, Canada, 4Physics and Astronomy, Lawson Health Research Institute, London, ON, Canada
Synopsis
Hyperpolarized 129Xe MRI provides a way to investigate and assess pulmonary diseases. To improve the performance of 129Xe MRI in lung imaging, a method for acquiring two VDP calculations using high-resolution 3D static ventilation imaging from FGRE combined with a key-hole method was proposed and demonstrated in participants with ventilation abnormalities. SNR was calculated as well as semi-automated VDP and fully automated VDP, which showed a strong positive linear correlation with a zero intercept and close to unity slop. This study confirms the feasibility of using isotropic-voxel 129Xe MRI acquired in a single breath-hold to study ventilation heterogeneity.
Purpose
It has been shown that inhaled-hyperpolarized-gas MRI is a useful technique in the diagnosis and treatment plan development for many pulmonary-diseases, including COPD,1 asthma,2 and lung-cancer.3 Low SNR of 129Xe images (SNR<5) remains an obstacle for the development of several acquisition techniques, namely, isotropic static-ventilation imaging,4,5 and simultaneous collection of 129Xe gas and 129Xe dissolved in lung tissue/blood.6 Nevertheless, by taking advantage of the recent improvement in xenon-polarization techniques, efforts have been made to overcome the low-image-resolution problem, where isotropic-voxel high-resolution 3D 129Xe static-ventilation images were collected in a single 16sec breath-hold from asthma subjects using FGRE.4 129Xe high-resolution imaging is important as it should permit the better assessment of disease-progression, estimation of the treatment effect, and improvement of our understanding of ventilation heterogeneity. Although, the quantification of the high-resolution datasets can be challenging for a number of reasons. Presently used semi-automated segmentation7 permits to quantify 3D isotropic 129Xe lung images to generate ventilation-defect-percent (VDP). However, this method is not very suitable for isotropic-voxel high-resolution 3D 129Xe MRI analysis, partly due to the large number of slices (~80). Recently, deep learning (DL) methods have demonstrated numerous successes in medical image analysis tasks.8 We hypothesize that DL-based algorithms can be used for accurate calculation of VDP from high-resolution images obtained using a key-hole approach9, and can provide accurate assessment of lung structure and function. In this study, we acquired high-resolution 3D 129Xe data from 10 participants with ventilation defects, using a previously developed key-hole-based method5 and calculated the VDP using a DL-based algorithm in comparison with a semi-automated approach7 as the reference gold standard.Methods
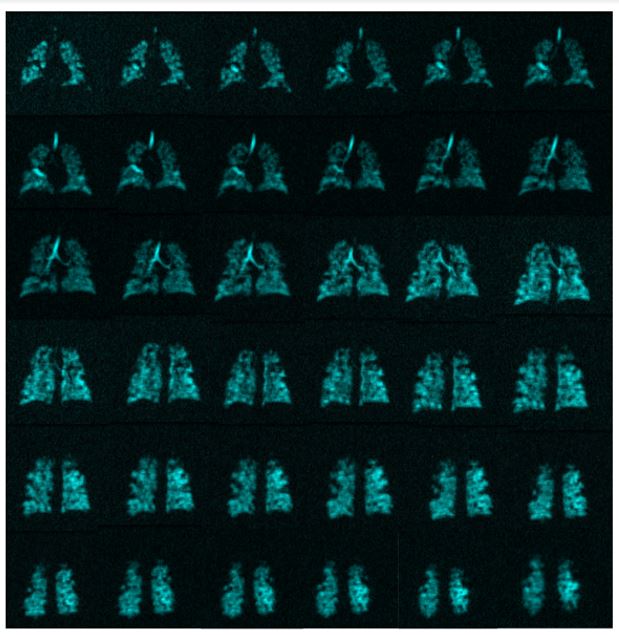
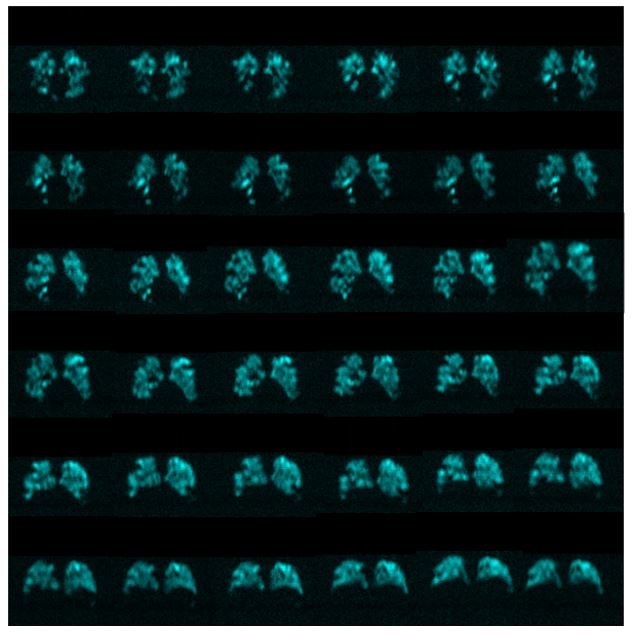
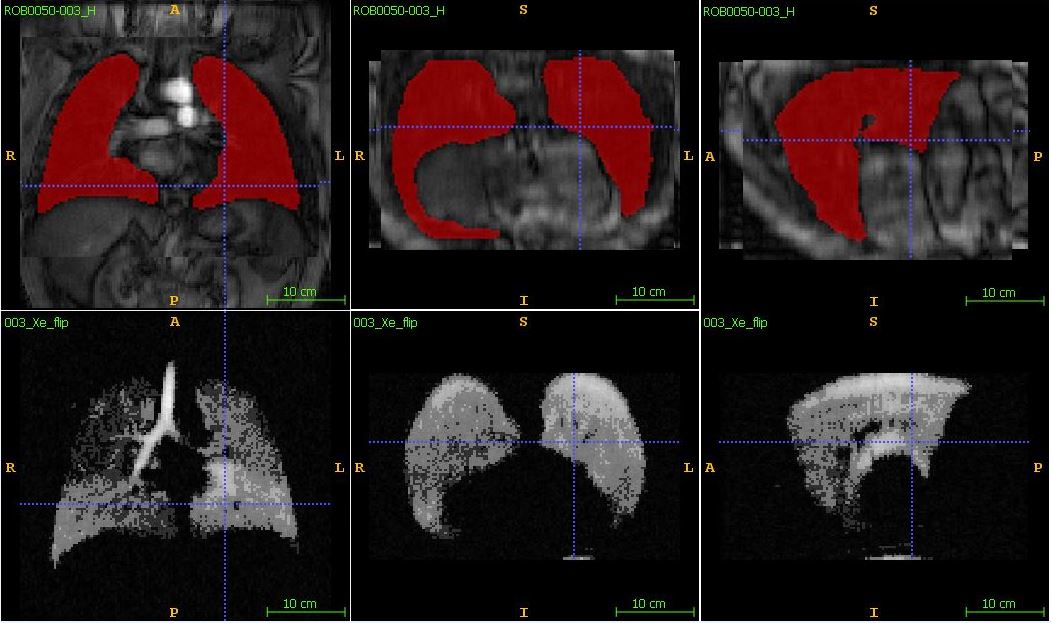
Ten participants with established ventilation heterogeneity provided written informed consent provided to an ethics-board-approved-study-protocol, underwent spirometry and 1H/129Xe MRI scanning. 129Xe imaging was performed at 3.0T (MR750, GEHC, WI) using whole-body-gradients (5G/cm maximum) and a commercial 129Xe quadrature-flex RF coil (MR Solutions, USA).8 Traditional-resolution xenon-static-ventilation images were acquired using a coronal-plane 3D FGRE sequence (TE/TR/initial-flip-angle=1.5ms/5.1ms/1.3o, variable-flip-angle,10 Bandwidth=16kHz, reconstructed-matrix-size=128x128x16, and FOV=40x40x24cm3, voxel-size=3x3x15mm3), as previously described.11 All images were acquired in breath-hold (<16sec) after inspiration of 1.0L of gas (129Xe/4He mixture, 30/70) from functional-residual-capacity. Extra four low-resolution static-ventilation 3D datasets were acquired without a xenon breath-hold to obtain the noise datasets. High-resolution images with 3x3x3mm3 voxel-size were obtained by sandwiching four noise datasets and one xenon signal dataset (number of slice=80) and performing 3D FFT starting with the z-direction following the key-hole technique steps (Fig.1 and 2).9 Hyperpolarized 129Xe (polarization=35%) was obtained from a turn-key, spin-exchange polarizer system (Polarean-9820 129Xe-polarizer).12 1H MRI was performed as previously described.1 129Xe SNR was calculated for three central slices in a coronal-view as previously described.13A U-net++ network14 was trained on 15 isotropic 1H MRI datasets. The trained-network was used to segment the lung in the isotropic proton-lung images for each participant. The 1H MR image was registered to the 129Xe volumes using an affine and a deformable registration method provided by the NiftyReg package (http://cmictig.cs.ucl.ac.uk/wiki/index.php/NiftyReg). The associated lung-segmentation was warped and 129Xe image-signal within the warped-lung-masks (Fig.3 top-panel) were automatically-segmented into 5-clusters using a 3D k-means-clustering-approach (Fig.3 bottom-panel). VDP was calculated by normalizing 129Xe ventilation-defects represented by the 1st cluster to the warped lung-masks.15 The DL-based VDP was compared with a semi-automated-method using Pearson correlation coefficient.4
Results
Table 1 summarizes demographic-information, pulmonary-function-tests, imaging results including SNR for three slices (lowest SNR>5), and two VDP calculations of the participant dataset. The largest disagreement between two VDP estimates was found for P7, showing the smallest SNR values. Fig.4 shows a relationship for the semi-automated-based VDP values with the DL-based fully automated VDP values obtained from nine participants (intercept=-0.06±0.18, slop=0.88±0.09, R=0.92). Plot demonstrates a strong linear correlation between two types of VDP.Discussion & Conclusion
The semi-automated-lung-segmentation-method7 is widely used for hyperpolarized-gas lung image segmentation and the VDP calculation. However, the high-resolution data requires a significant observer time (~45min per 80slices). On the other hand, the fully automated DL-based method permits to generate the accurate VDP-estimations with high agreement/correlation with the reference method. The mean VDP values from both method are comparable to the values reported in the literature obtained with asthma4 patients. The result suggests that both segmentation-methods require SNR>>5, to provide the accurate VDP estimates. Isotropic-voxel coronal SNR-values were consistent with values reported in the literature.11 A rigid and homogenous coil16 combined with a phased-receive-array17 could substantially improve isotropic-voxel image-quality. We demonstrated that the isotropic-voxel 129Xe static-ventilation dataset obtained from participants can be analyzed by using DL-based method to generate accurate biomarkers. The result of this proof-of-concept study suggests that 129Xe MRI coupled with the DL-based lung-segmentation can be used to rapidly evaluate ventilation heterogeneity across a wide range of disease. This is important in the light of the FDA approval16 for 129Xe MRI. Furthermore, this increases the opportunity for clinical translation of using 129Xe lung MRI as a tool for better treatment of patients with acute and chronic lung disease.Acknowledgements
We acknowledge the support of the Natural Sciences and Engineering Research Council of Canada, R5942A04, and a Western University Research Catalyst Grant.References
1 Kirby, M., Pike, D., Coxson, H. O., McCormack, D. G. & Parraga, G. Hyperpolarized (3)He ventilation defects used to predict pulmonary exacerbations in mild to moderate chronic obstructive pulmonary disease. Radiology 273, 887-896, doi:10.1148/radiol.14140161 (2014).
2 Svenningsen, S. et al. Sputum Eosinophilia and MRI Ventilation Heterogeneity in Severe Asthma. Am J Respir Crit Care Med, doi:10.1164/rccm.201709-1948OC (2018).
3 Hoover, D. A. et al. Functional lung avoidance for individualized radiotherapy (FLAIR): study protocol for a randomized, double-blind clinical trial. BMC Cancer 14, 934, doi:10.1186/1471-2407-14-934 (2014).
4 Barker, A. L. et al. Feasibility of Single Breath-hold Isotropic Voxel 129Xe MRI in Patients [abstract]. ISMRM 19th Annual Meeting, Paris, France, 4142 (2019).
5 Ranota, T. K., Serrai, H., McCormack, D. G., Parraga, G. & Ouriadov, A. Feasbility of Single Breath-hold Isotropic Voxel 129Xe MRI in COVID-19 Survivors using a Key-Hole Method [abstract]. ISMRM 30th Annual Meeting (2021).
6 Kaushik, S. S. et al. Single-breath clinical imaging of hyperpolarized (129)Xe in the airspaces, barrier, and red blood cells using an interleaved 3D radial 1-point Dixon acquisition. Magn Reson Med 75, 1434-1443, doi:10.1002/mrm.25675 (2016).
7 Kirby, M. et al. Hyperpolarized 3He magnetic resonance functional imaging semiautomated segmentation. Acad Radiol 19, 141-152, doi:10.1016/j.acra.2011.10.007 (2012).
8 Litjens, G. et al. A survey on deep learning in medical image analysis. Med Image Anal 42, 60-88, doi:10.1016/j.media.2017.07.005 (2017).
9 Niedbalski, P. J. et al. Mapping and correcting hyperpolarized magnetization decay with radial keyhole imaging. Magn Reson Med 82, 367-376, doi:10.1002/mrm.27721 (2019).
10 Ouriadov, A. V., Lam, W. W. & Santyr, G. E. Rapid 3-D mapping of hyperpolarized 3He spin-lattice relaxation times using variable flip angle gradient echo imaging with application to alveolar oxygen partial pressure measurement in rat lungs. MAGMA 22, 309-318, doi:10.1007/s10334-009-0181-3 (2009).
11 Svenningsen, S. et al. Hyperpolarized (3) He and (129) Xe MRI: differences in asthma before bronchodilation. J Magn Reson Imaging 38, 1521-1530, doi:10.1002/jmri.24111 (2013). 12 Kaushik, S. S. et al. Diffusion-weighted hyperpolarized 129Xe MRI in healthy volunteers and subjects with chronic obstructive pulmonary disease. Magn Reson Med 65, 1154-1165, doi:10.1002/mrm.22697 (2011).
13 Dominguez-Viqueira, W., Ouriadov, A., O'Halloran, R., Fain, S. B. & Santyr, G. E. Signal-to-noise ratio for hyperpolarized (3)He MR imaging of human lungs: a 1.5 T and 3 T comparison. Magn Reson Med 66, 1400-1404, doi:10.1002/mrm.22920 (2011).
14 Zhou, Z., Siddiquee, M. M. R., Tajbakhsh, N. & Liang, J. UNet++: Redesigning Skip Connections to Exploit Multiscale Features in Image Segmentation. IEEE Trans Med Imaging 39, 1856-1867, doi:10.1109/TMI.2019.2959609 (2020).
15 Guo, F. et al. Thoracic CT-MRI coregistration for regional pulmonary structure-function measurements of obstructive lung disease. Med Phys 44, 1718-1733, doi:10.1002/mp.12160 (2017).
16 Farag A, Wang J, Ouriadov A, Parraga G & G., S. Unshielded and asymmetric RF transmit coil for hyperpolarized 129Xe human lung imaging at 3.0 T. In Proceedings of the 20th Annual Meeting of ISMRM, Melbourne, Australia, 1233 (2012).
17 Chang, Y. V., Quirk, J. D. & Yablonskiy, D. A. In vivo lung morphometry with accelerated hyperpolarized (3) He diffusion MRI: a preliminary study. Magn Reson Med 73, 1609-1614, doi:10.1002/mrm.25284 (2015).
Figures

Table 1: Demographics and 129Xe MRI results.
P=participant; BMI=body mass index; FEV1=forced expiratory volume in 1 second; FVC=forced vital capacity; RV=residual volume; DLCO=diffusing capacity for carbon monoxide; 129Xe MRI-based VDP=ventilation defect percent, SNR=signal to noise ratio, SA= Semi-Automated, DL=Deep Learning.