3510
Measurements of cell size and density using temporal diffusion spectroscopy distinguish hepatocellular carcinoma1Vanderbilt University Institute of Imaging Science, nashville, TN, United States, 2Department of Radiology and Radiological Sciences, Vanderbilt University Institute of Imaging Science, nashville, TN, United States, 3Department of Radiology and Radiological Sciences, Vanderbilt University Medical Center, nashville, TN, United States, 4Department of Radiology and Radiological Sciences, Vanderbilt University Medical Center, Nashville, TN, United States
Synopsis
There is an unmet need to develop a non-invasive and reliable method for detecting hepatocellular carcinoma (HCC) at early stages in high-risk patients (e.g., patients with cirrhosis). We hypothesized that temporal diffusion spectroscopy (TDS), which reports histopathological information such as mean cell size in vivo, can improve current Liver Imaging Reporting and Data System (LI-RADS) criteria for assessment of HCC and reduce the need for biopsies. To test this hypothesis, we applied TDS to distinguish cell sizes and densities in HCC and other liver conditions, such as benign/dysplastic nodules, fibrosis, and cholangiocarcinoma (iCCA), in ex vivo studies.
Introduction
Accurate diagnosis of hepatocellular carcinoma (HCC) at an early stage is crucial for increasing survival. In at-risk patients (e.g., patients with cirrhosis) with abnormal surveillance ultrasound or high alpha fetoprotein (AFP), dynamic contrast-enhanced CT/MRI is recommended for initial diagnostic testing. However, there is overlap in presentations between HCC and other non-HCC entities, such as dysplastic/benign nodules and cholangiocarcinoma (iCCA), on multiphase CT/MR presentations. Either biopsy or repeated imaging tests are recommended for all lesions without confirmatory diagnoses to establish the exact pathology for optimal treatment options. However, biopsy is an invasive procedure with several adverse effects. The current wait-and-watch approach usually waits 3-6 months for another diagnostic imaging test, which causes undesirable treatment delays. Therefore, we propose temporal diffusion spectroscopy (TDS), a technique that reports histopathological information such as mean cell size in vivo1,2, as a potential tool to overcome this clinical challenge. Decreased cell sizes and increased cellularity compared with surroundings have been considered as key diagnostic features of HCC3,4. HCC consists of tumor cells with size ranging from 8-12 µm, which are significantly smaller than the average cell sizes (~15-25 µm) in normal parenchyma, benign nodules, and dysplastic nodules, which, mainly consist of hepatocytes5. Intrahepatic cholangiocarcinoma (iCCA) is characterized by a dense, reactive desmoplastic stroma marked by a dramatic accumulation of extracellular matrix (ECM)6. These cytological differences suggest TDS could be an imaging biomarker for the diagnosis of HCC. Here, we characterized HCC and potentially confounding pathologies including benign/dysplastic nodules, fibrosis, and iCCA, using TDS imaging ex vivo. TDS-derived cell sizes and cellularities were validated with histology and a diagnostic metric was developed to differentiate HCC.Theory
Within the framework of TDS, we have previously developed a multi-compartment diffusion-based IMPULSED method7-9 for quantification of microstructural parameters in solid tissues, including mean cell size d, intracellular volume fraction vin, intra/extra cellular diffusion coefficients Din/Dex from a limited number of diffusion measurements with varying diffusion times. We have further improved IMPULSED by including the diffusion time dependent influence of water exchange on IMPULSED10. For short tdiff (e.g., 5 ms), the water exchange is ignored and the signal model is the same as the IMPULSED analysis7. For long tdiff (e.g., ≥ 30 ms), we adapted the modified Kӓrger model11 that includes both restricted diffusion and exchange between pools. This model assumes short gradient pulses (i.e., δ ≪ Δ) so that diffusion is considered only during two short gradient pulses, while relaxation and exchange effects occur throughout the pulse sequence. Using this joint model, we improve the accuracy of IMPULSED-derived cell size d, and vin. In practice, a combination of acquisitions of both oscillating gradients as in OGSE (oscillating gradient spin echo) for short tdiff and bipolar gradients as in PGSE (pulsed gradient spin echo) or STEAM (stimulated echo acquisition mode) for relatively long tdiff provides sufficient coverage for characterizations of tumor cell sizes and cellularities. Details of the signal model have been published previously2,12. Data fitting was performed using an in-house developed software package (https://github.com/jzxu0622/mati.git).Methods
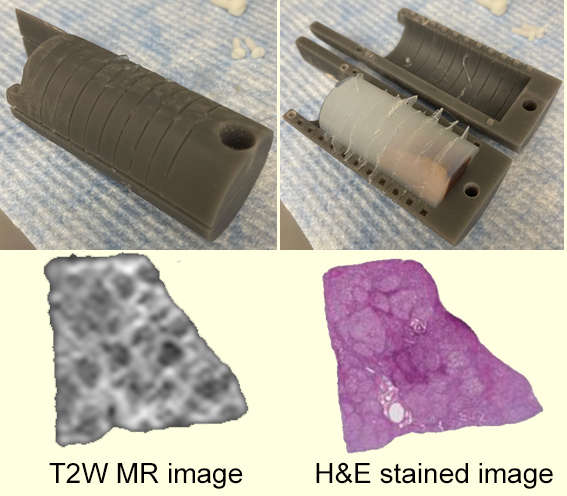
Human liver specimens were fixed with 10% neutral buffered formalin for 48 hours, and then transferred to PBS solution for 24 hours. Specimens were embedded in a 3D-printed holder (Figure 1) with 4% agarose. The specially designed tissue holder has evenly spaced gaps with a gap width of 0.5 mm (the width of a blade) and 5 mm between gaps, which allows accurate registration between histology and TDS results. TDS acquisitions were performed using a 4.7T scanner. For PGSE experiments, diffusion gradient duration/separation δ/Δ = 3/11 ms. The OGSE acquisitions used frequencies at 50 with δ / Δ = 20/25 ms. For STEAM experiments, diffusion gradient duration/separation δ/Δ = 3/71 ms. Five b-values spaced at equal logarithmic intervals from 0 to either 1000 s/mm2 or the allowed maximum b value (limited by the maximum gradient strength of 360 mT/m in a single direction) were used to allow estimates of the diffusion coefficient at each diffusion time.Results
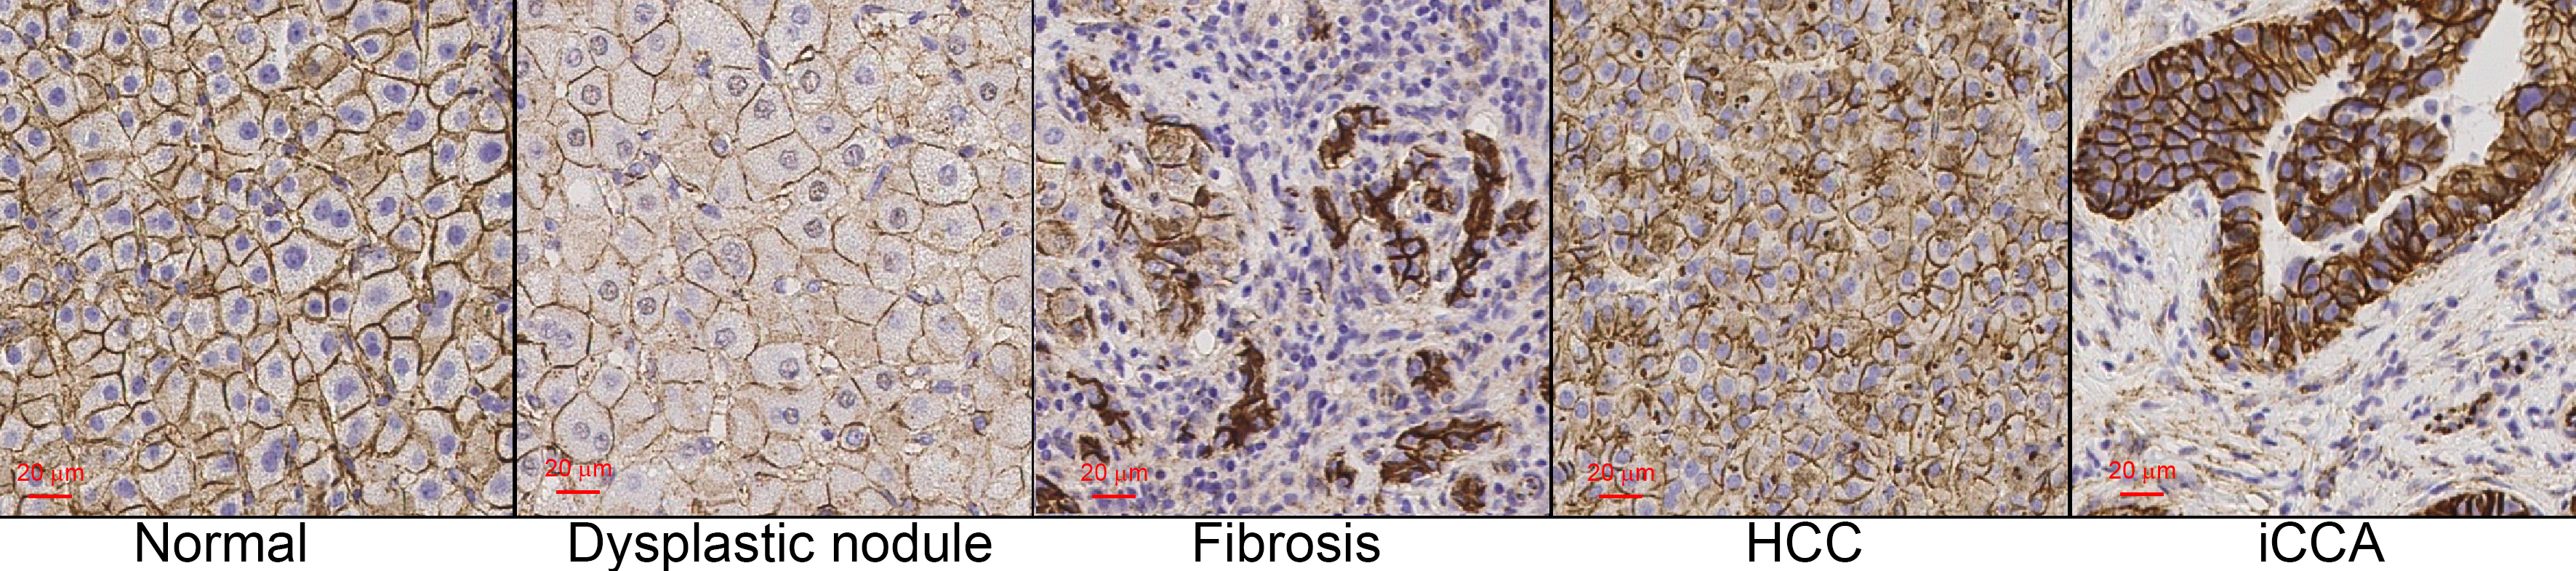
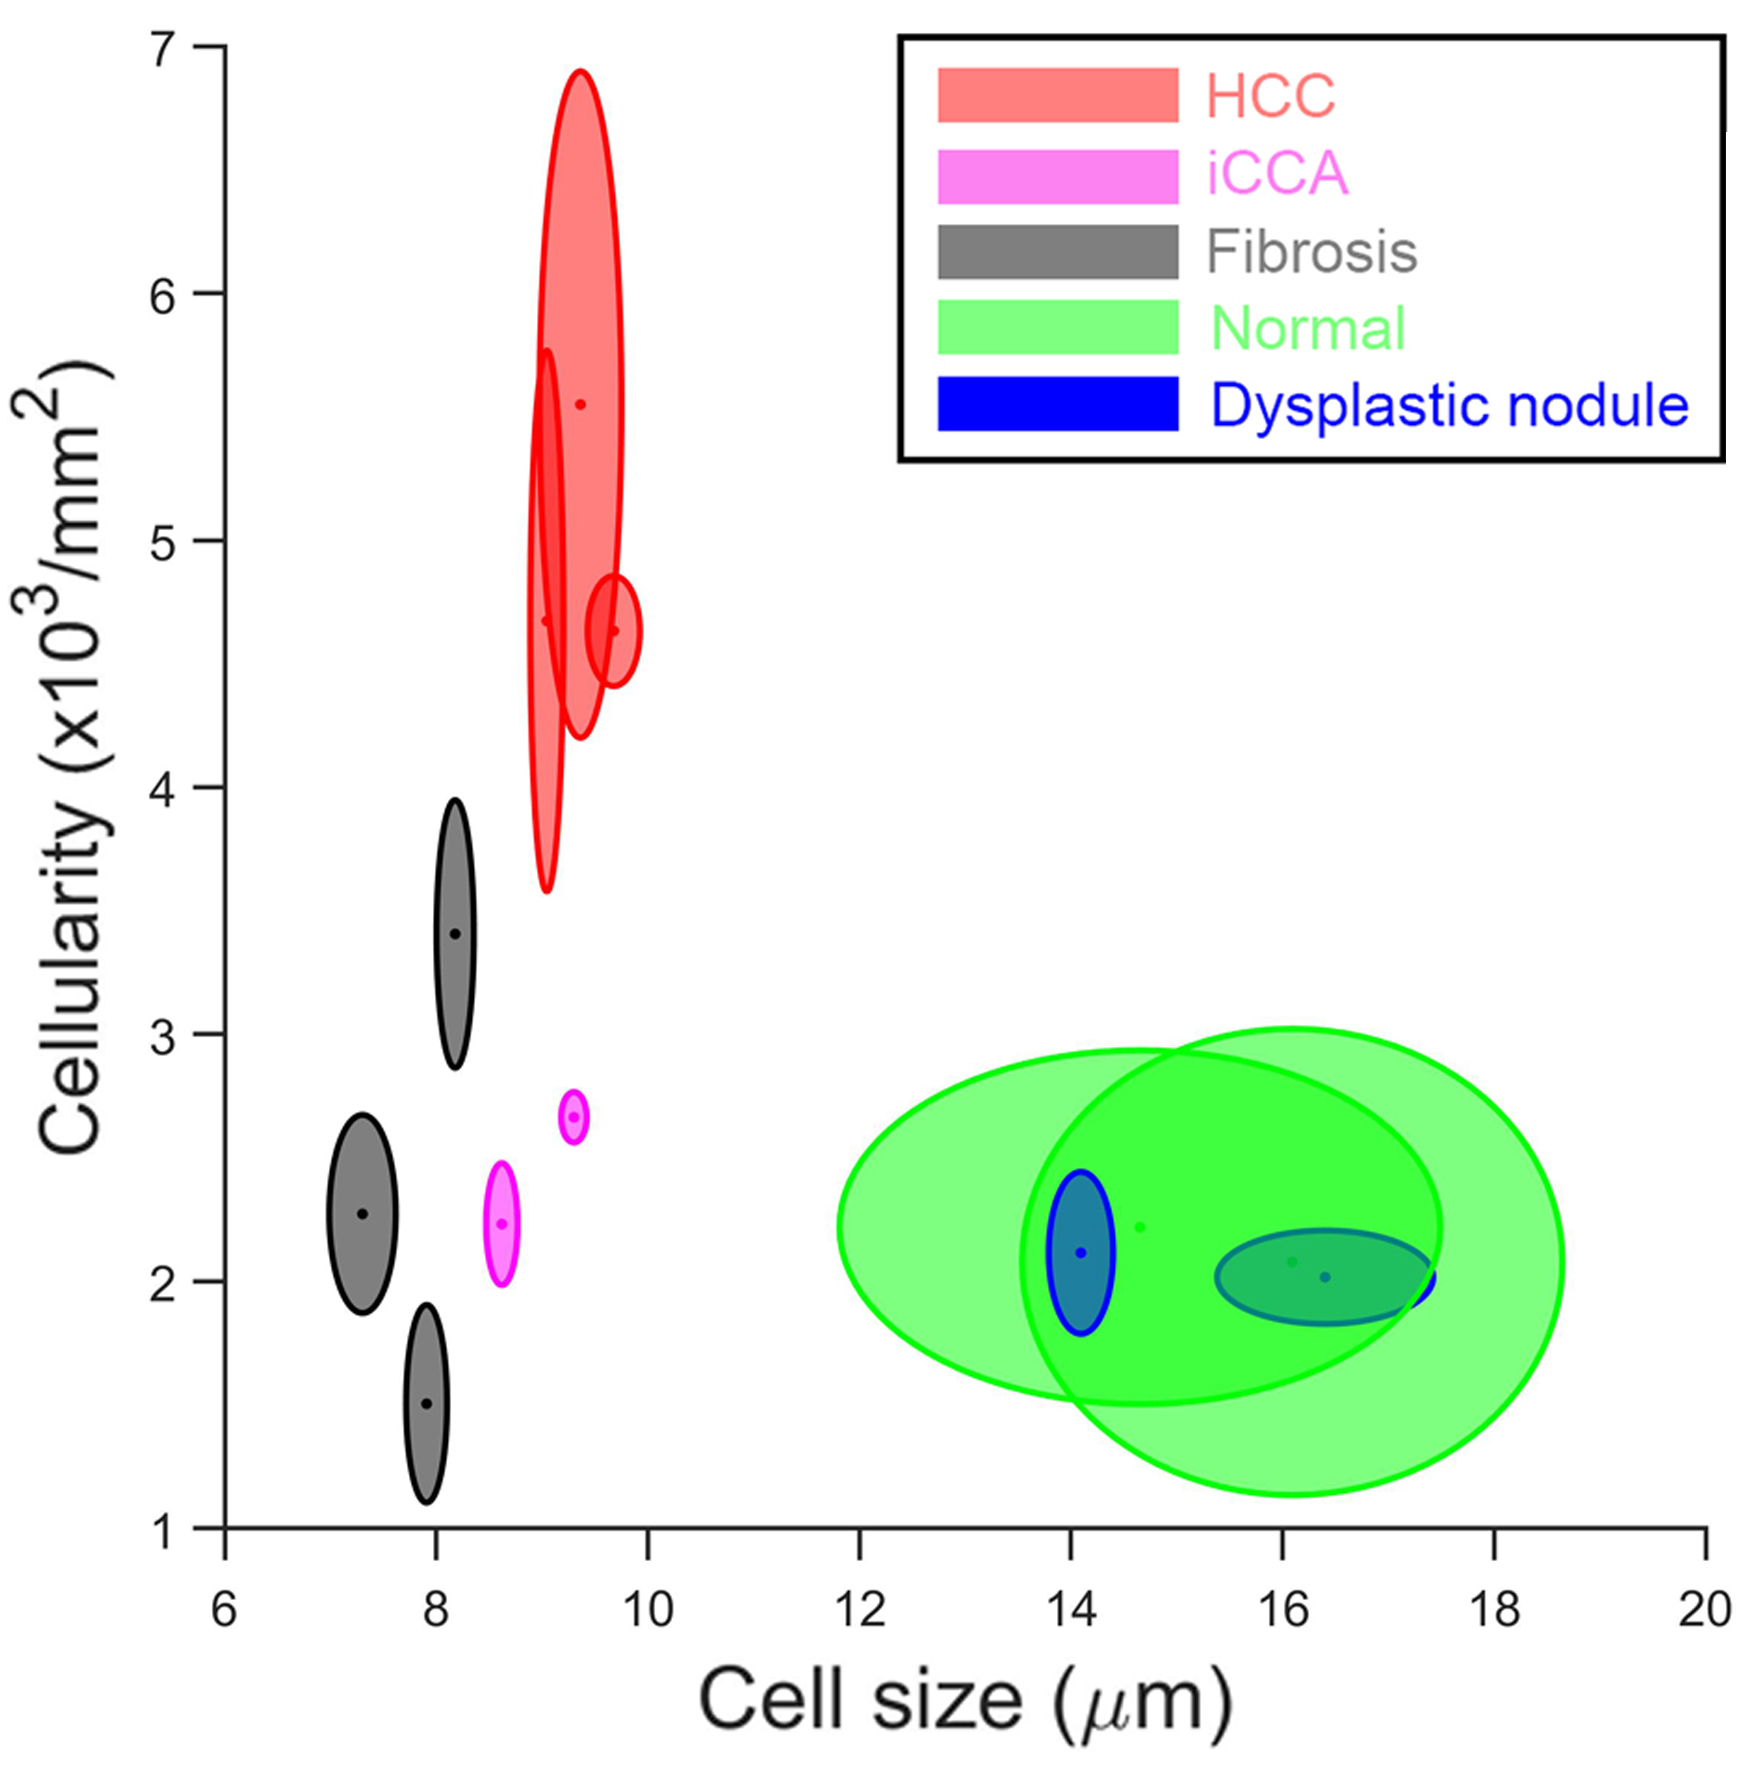
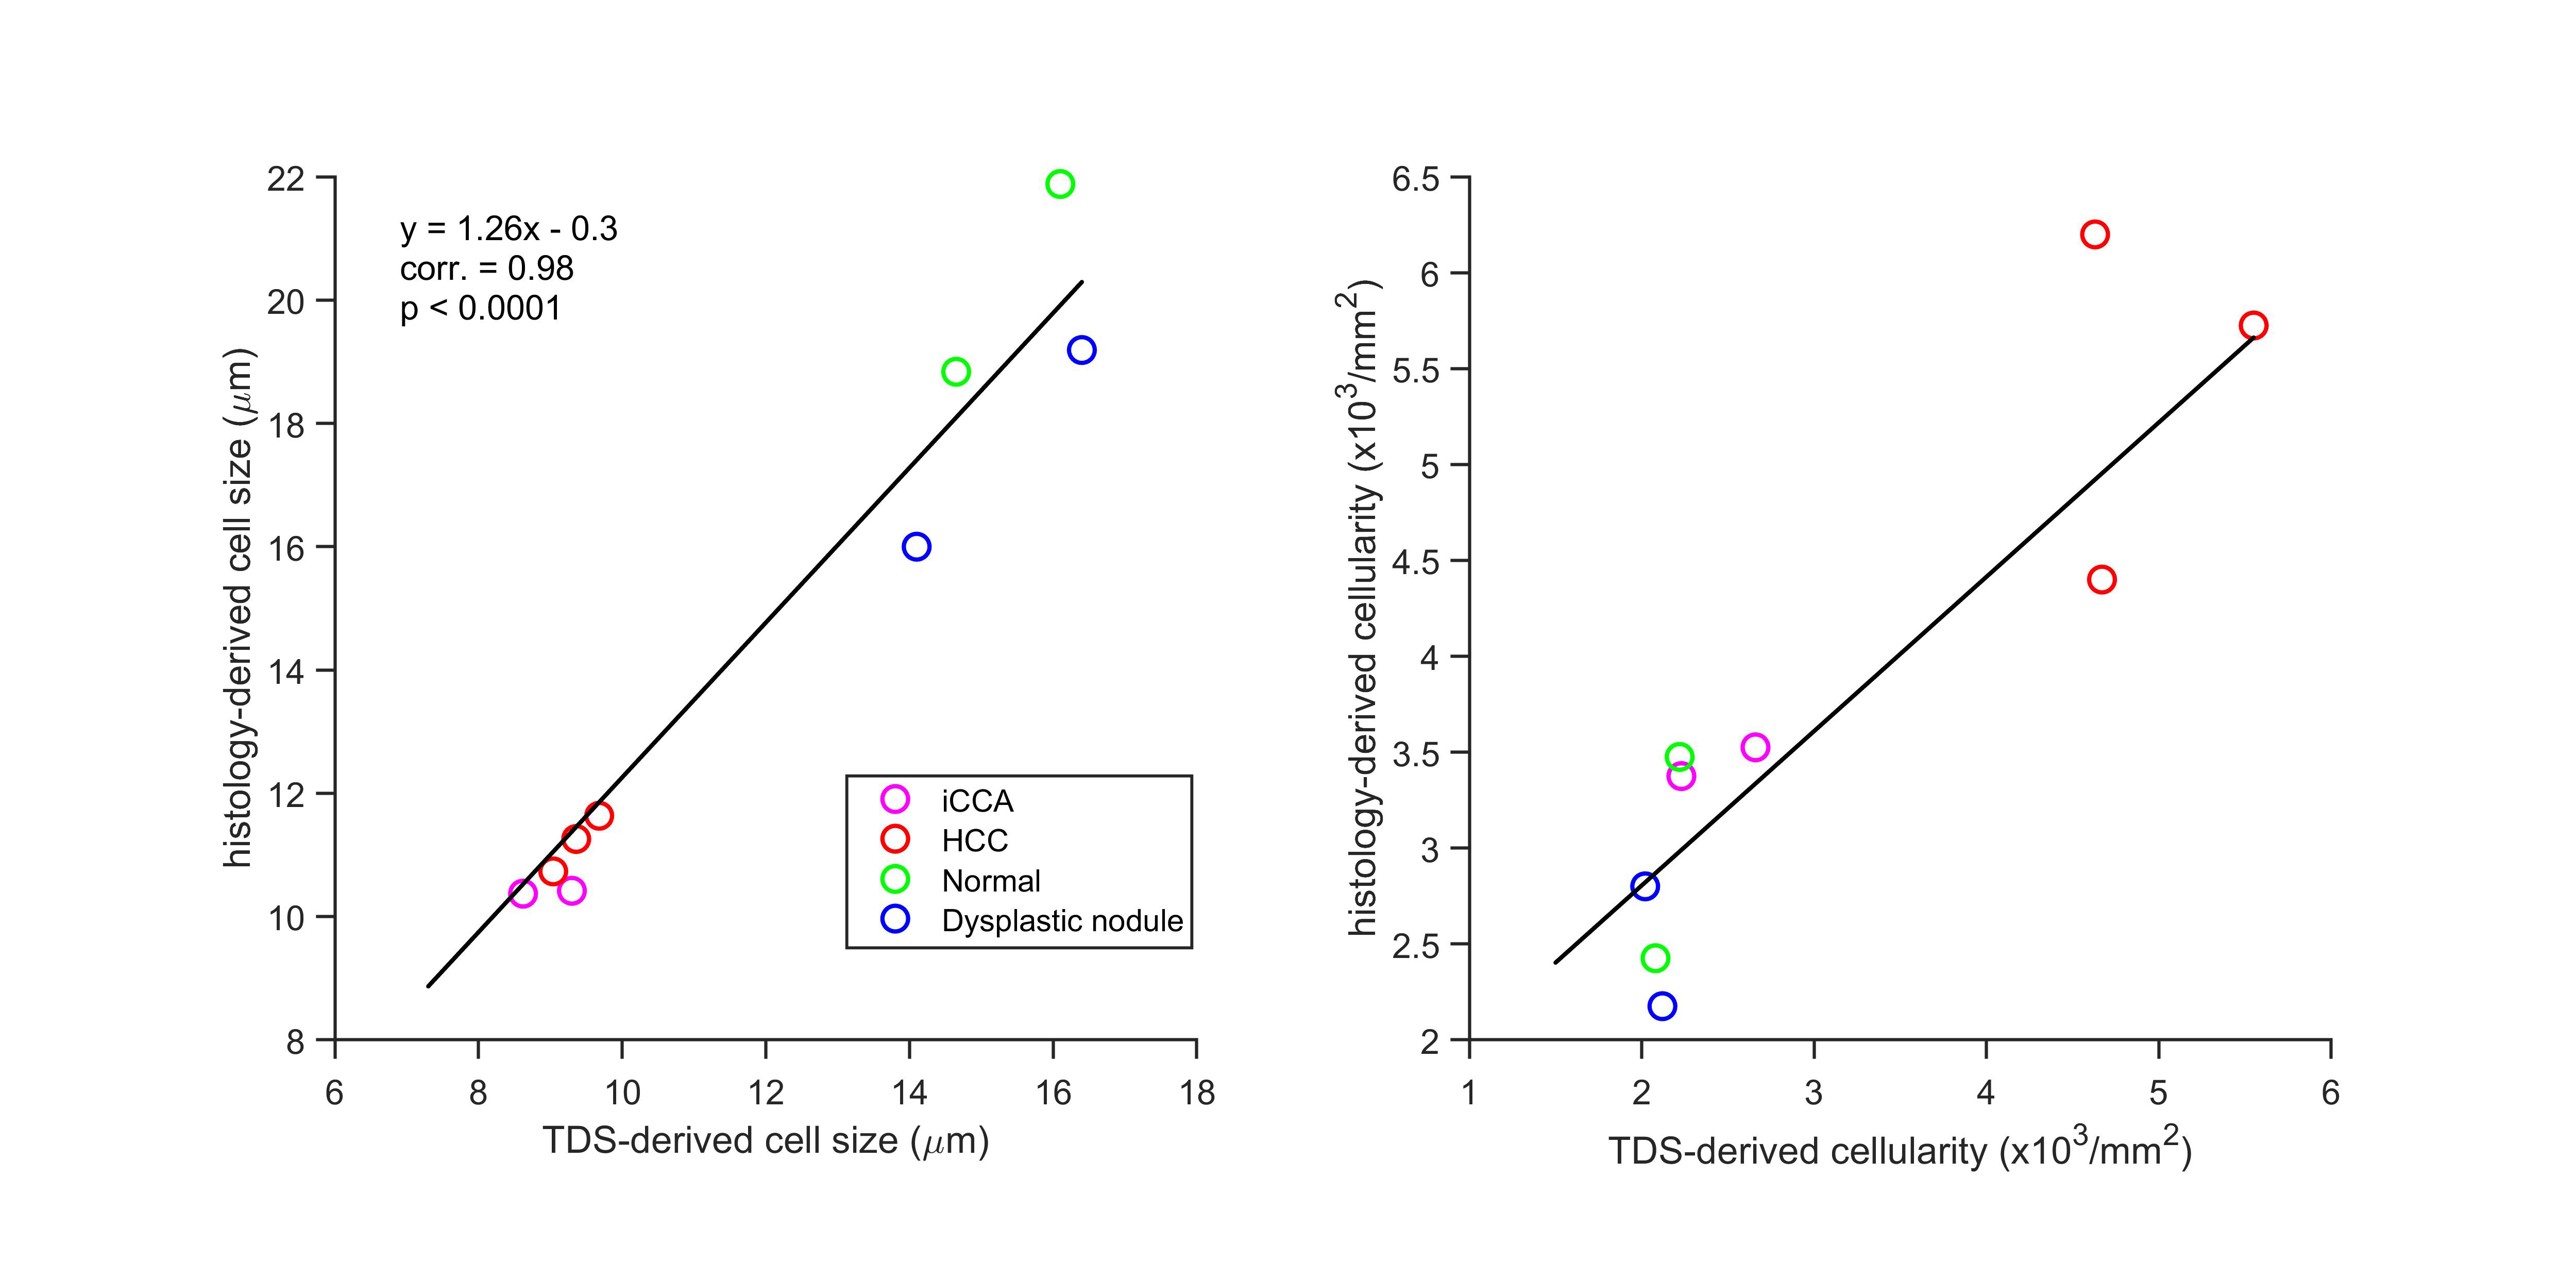
Strong membranous β-catenin staining showed significant morphological differences between HCC and other confounding conditions (Figure 2). The average cell sizes and cellularities quantified by histology and TDS for normal and diseased liver specimens were strongly correlated (Figure 4). A combination of high cellularity (e.g., >4x10³/mm2) and cell size ranging from 8-10 µm is suggested to differentiate HCC from other confounding conditions (Figure 3).Discussion and Conclusion
For fibrotic tissues, TDS-derived cell sizes and cellularities were not compared with histology-derived values because β-catenin does not stain membranes of hepatic stellate cells (HSC), which are the major cells in fibrosis (only nuclei of HSCs are visible as shown in Figure 2), and thus we could not estimate the average cell size for fibrotic tissues from histological pictures. Also, HSCs are spindle-shaped which is different from our model assumption of spherical cell shapes. Efforts to visualize HSCs and investigate effects of different cell shapes on TDS-derived cell sizes are ongoing. In conclusion, this ex vivo study demonstrated the feasibility to measure cell size and cellularity simultaneously using TDS imaging accurately. The combination of both metrics can significantly improve the specificity to differentiate HCC from other confounding conditions in human livers.Acknowledgements
No acknowledgement found.References
1 Gore, J. C. et al. Characterization of tissue structure at varying length scales using temporal diffusion spectroscopy. NMR in biomedicine 23, 745-756, doi:10.1002/nbm.1531 (2010).
2 Jiang, X., Li, H., Devan, S. P., Gore, J. C. & Xu, J. MR cell size imaging with temporal diffusion spectroscopy. Magnetic resonance imaging 77, 109-123, doi:10.1016/j.mri.2020.12.010 (2021).
3 Park, Y. N. Update on Precursor and Early Lesions of Hepatocellular Carcinomas. Arch Pathol Lab Med 135, 704-715 (2011).
4 Chang, O. et al. The cytological characteristics of small cell change of dysplasia in small hepatic nodules. Oncology reports 23, 1229-1232, doi:10.3892/or_00000754 (2010).
5 Kondo, F., Wada, K. & Kondo, Y. Morphometric analysis of hepatocellular carcinoma. Virchows Archiv. A, Pathological anatomy and histopathology 413, 425-430, doi:10.1007/bf00716991 (1988). 6 Carpino, G. et al. Matrisome analysis of intrahepatic cholangiocarcinoma unveils a peculiar cancer-associated extracellular matrix structure. Clinical proteomics 16, 37, doi:10.1186/s12014-019-9257-x (2019).
7 Jiang, X. et al. Quantification of cell size using temporal diffusion spectroscopy. Magnetic resonance in medicine 75, 1076-1085, doi:10.1002/mrm.25684 (2016).
8 Jiang, X. et al. In vivo imaging of cancer cell size and cellularity using temporal diffusion spectroscopy. Magnetic resonance in medicine 78, 156-164, doi:10.1002/mrm.26356 (2017).
9 Xu, J. et al. Magnetic resonance imaging of mean cell size in human breast tumors. Magnetic resonance in medicine 83, 2002-2014, doi:10.1002/mrm.28056 (2020).
10 Li, H. et al. Time-Dependent Influence of Cell Membrane Permeability on MR Diffusion Measurements. Magnetic resonance in medicine 75, 1927-1934, doi:10.1002/mrm.25724 (2016).
11 Stanisz, G. J., Li, J. G., Wright, G. A. & Henkelman, R. M. Water dynamics in human blood via combined measurements of T2 relaxation and diffusion in the presence of gadolinium. Magnetic resonance in medicine 39, 223-233, doi:10.1002/mrm.1910390209 (1998).
12 Jiang, X., Xu, J. & Gore, J. C. Mapping hepatocyte size in vivo using temporal diffusion spectroscopy MRI. Magnetic resonance in medicine, doi:10.1002/mrm.28299 (2020).
Figures