3504
Deblurring for Spiral Imaging with Intra-Voxel Dephasing Modeling1Department of Radiology, Mayo Clinic, Rochester, MN, United States
Synopsis
Advantages of spiral imaging include fast imaging speed, high scan efficiency and low sensitivity to motion. However, spiral imaging remains challenging in regions where the field map Δf0 changes rapidly in space, especially with long spiral readouts. The goal of this work is to address this issue by modeling the signal decay in deblurring procedure. Volunteer data demonstrated that image quality can be improved by the proposed method.
Introduction
One of the major advantages of spiral imaging is the high scan efficiency, especially with long spiral readouts. This method has been used for high-resolution imaging utilizing novel spiral water-fat separation and deblurring techniques1. However, imaging with long readout times remains challenging in regions where the field map Δf0 changes rapidly in space. In particular, the through-plane gradient of Δf0 in 2D slices can cause significant intra-voxel dephasing and magnitude decay of the signal during acquisition. A method based a piecewise linear field map model has recently been proposed for spiral off-resonance correction2. In this study, we propose to model the dephasing with a single decay in k-space to improve the image quality of deblurring.Theory
The blurring process can be described as1$$B^HBf = B^Hg.\; \; \;(1)$$
For spiral water-fat imaging, g represents the blurred TE images and f represents the underlying water and fat images. B describes the procedure of the blurring, while BH is conjugate transpose of B. The desired f is estimated by iteratively solving Equation (1). A minor modification of equation (1) gives
$$(LB)^H(LB)f = (LB)^HLg,\; \; \;(2)$$
where L is a low-pass filter3. Equation (2) can be solved similarly to (1), except that B and g are replaced by LB and Lg respectively. The processes B and BH can be computed by spatially varying image-space convolution using blurring and deblurring kernels, respectively1. The kernels corresponding to LB are the low-pass filtered version of kernels corresponding to B.
Previously, only the phase accumulation caused by Δf0 is considered in the kernel calculation for B. In this work, we propose to incorporate the magnitude decay in the k-space, due to through-plane gradient of Δf0, in the kernel calculation. Two models of the intra-voxel dephasing were investigated. The first model is based on a commonly used relationship4 between T2 and T2*,
$${1 \over {T2^*}}= {1 \over T2} + {1 \over {T2_i}},$$
where T2i is the time constant of exponential signal decay caused by field inhomogeneity. This exponential decay model can be written as
$$m(t) = e^{-t|G_{Δf0}|},\; \; \;(3)$$
in which m(t) is the signal magnitude in k-space and $$$|G_{Δf0}|$$$ is the magnitude of gradient of Δf0. The second model assumes that slice profile is an ideal rectangle, and that the through-plane gradient of Δf0 is linear. Then the signal decay of the k-space caused by the through-plane Δf0 is a sinc function . $$m(t) = {sin(πt|G_{Δf0}|) \over πt|G_{Δf0}|}.\; \; \;(4)$$
Materials and Methods
Data acquisitionVolunteer brain images were acquired on a 3T Philips scanners (Ingenia Elition, Philips Healthcare, Best, The Netherlands). Data were acquired with a 2D spiral spin-echo (SE) sequence and a 2D gradient recalled echo (GRE) sequence with spiral-out readouts for T2 and T2*- weighted (T2W and T2*W) images. The in-plane resolution was 1 mm by 1 mm with slice thickness ranging from 2 to 5 mm. The spiral readout length was 43.4-47.0 ms. Data at two TEs with ΔTE = 1.15 ms were collected for water-fat separation. The first TE is 50 ms and 16.11 ms for T2 and T2* imaging, respectively. The maps of Δf0 were obtained from separate low-resolution scans.
Reconstruction
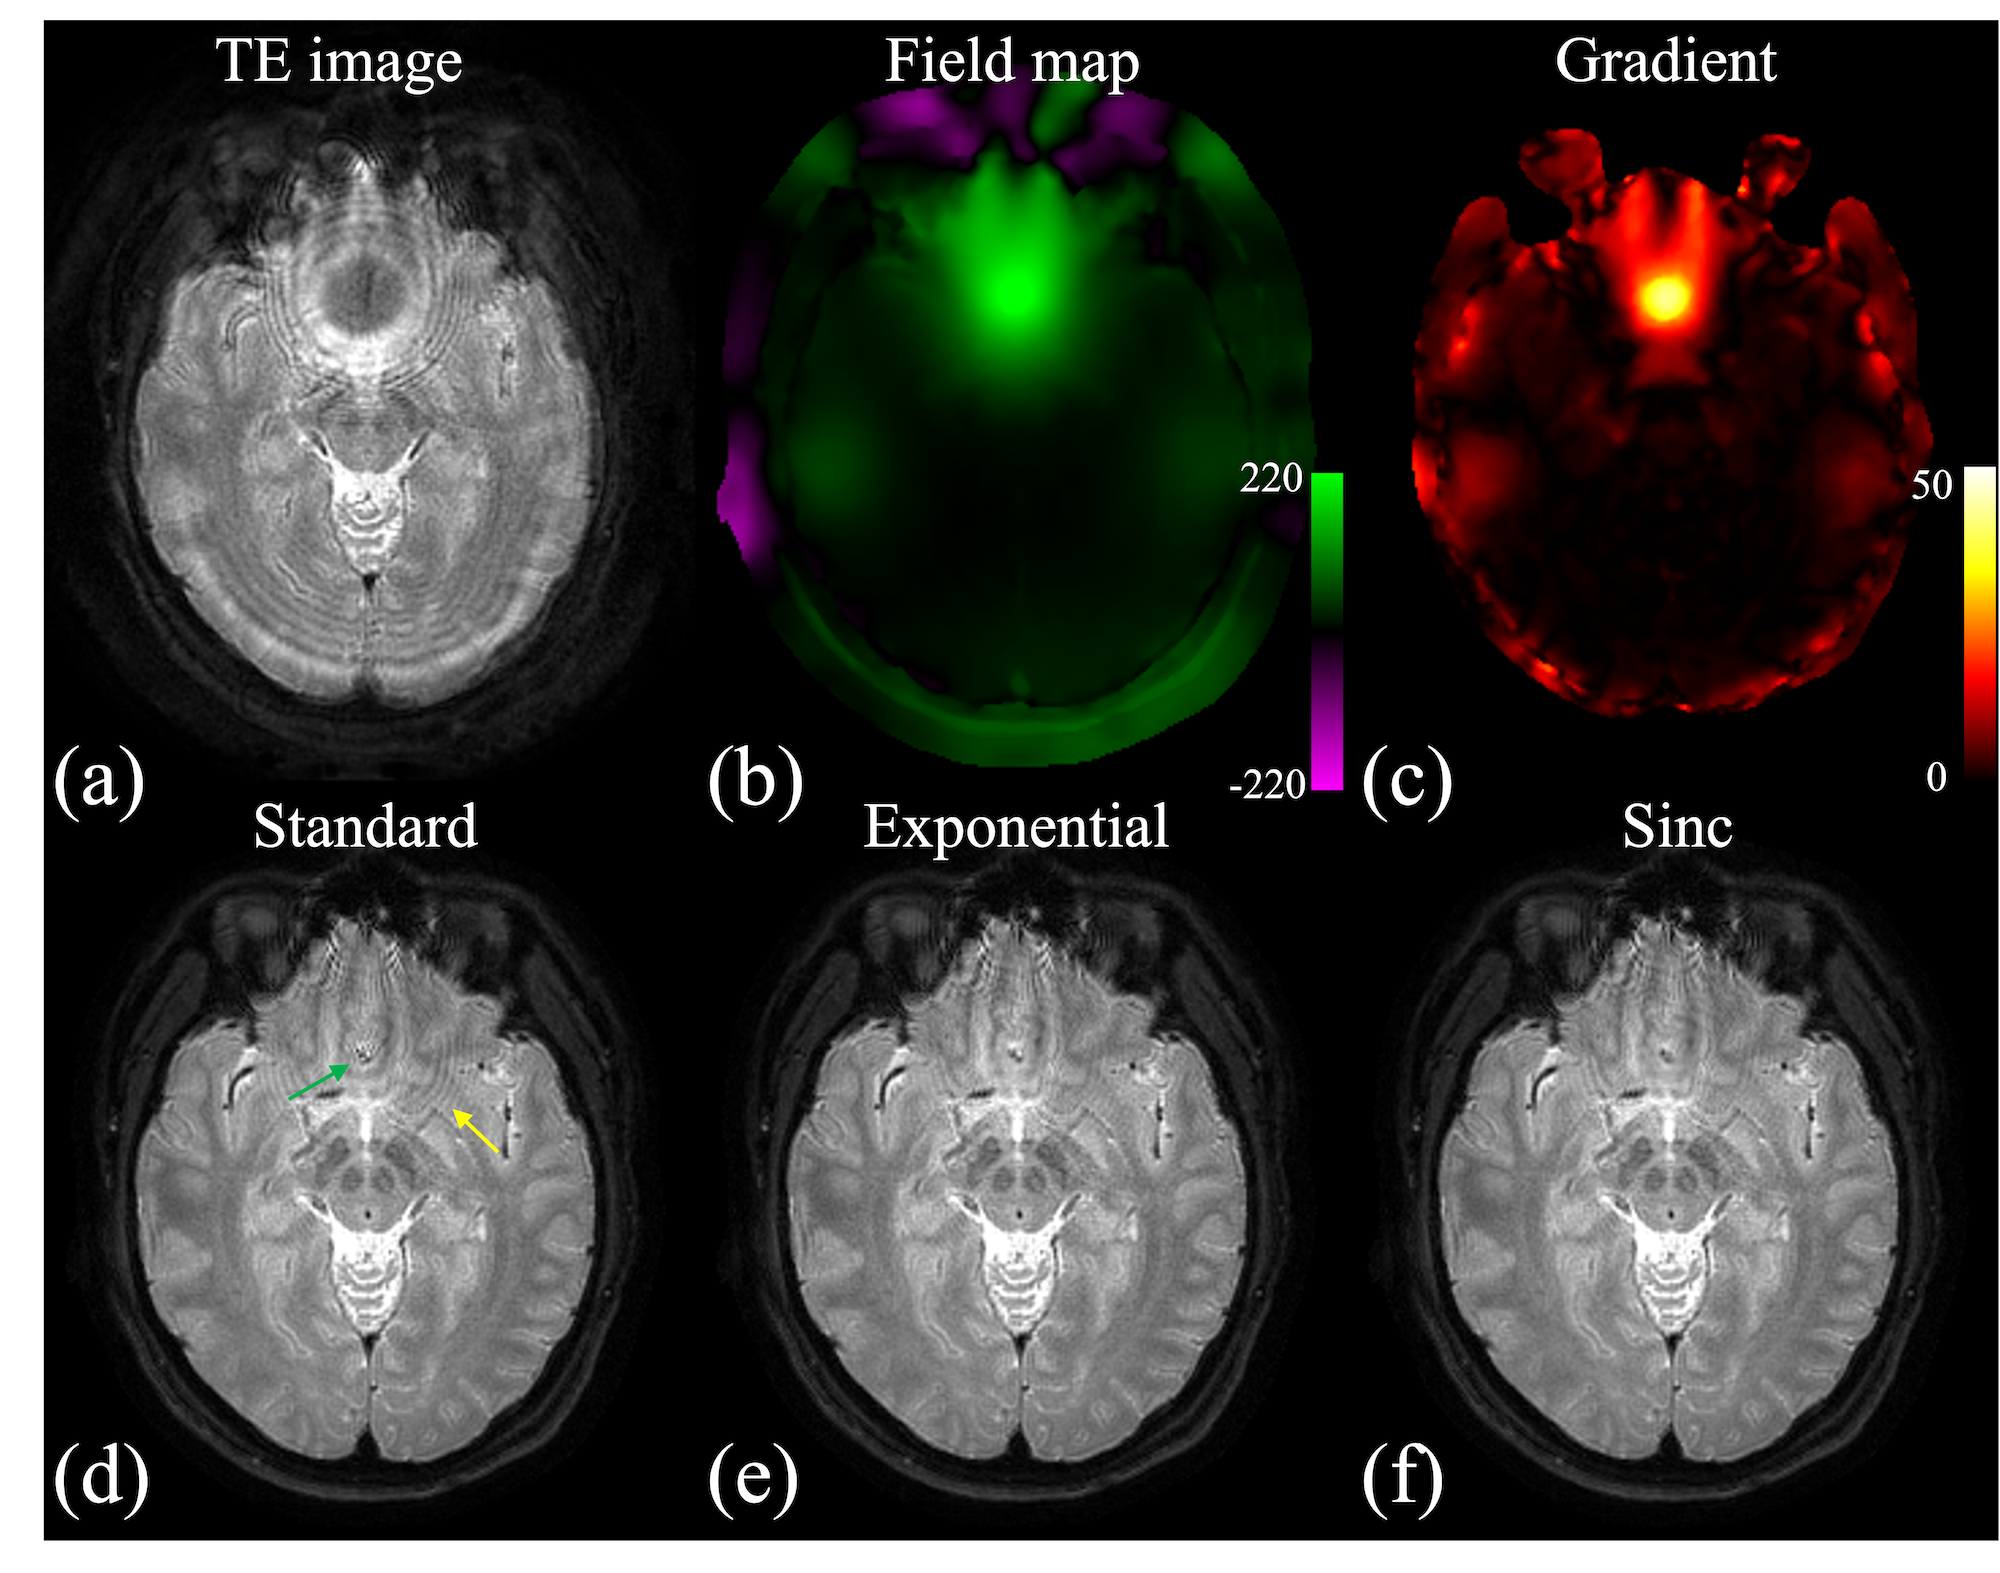
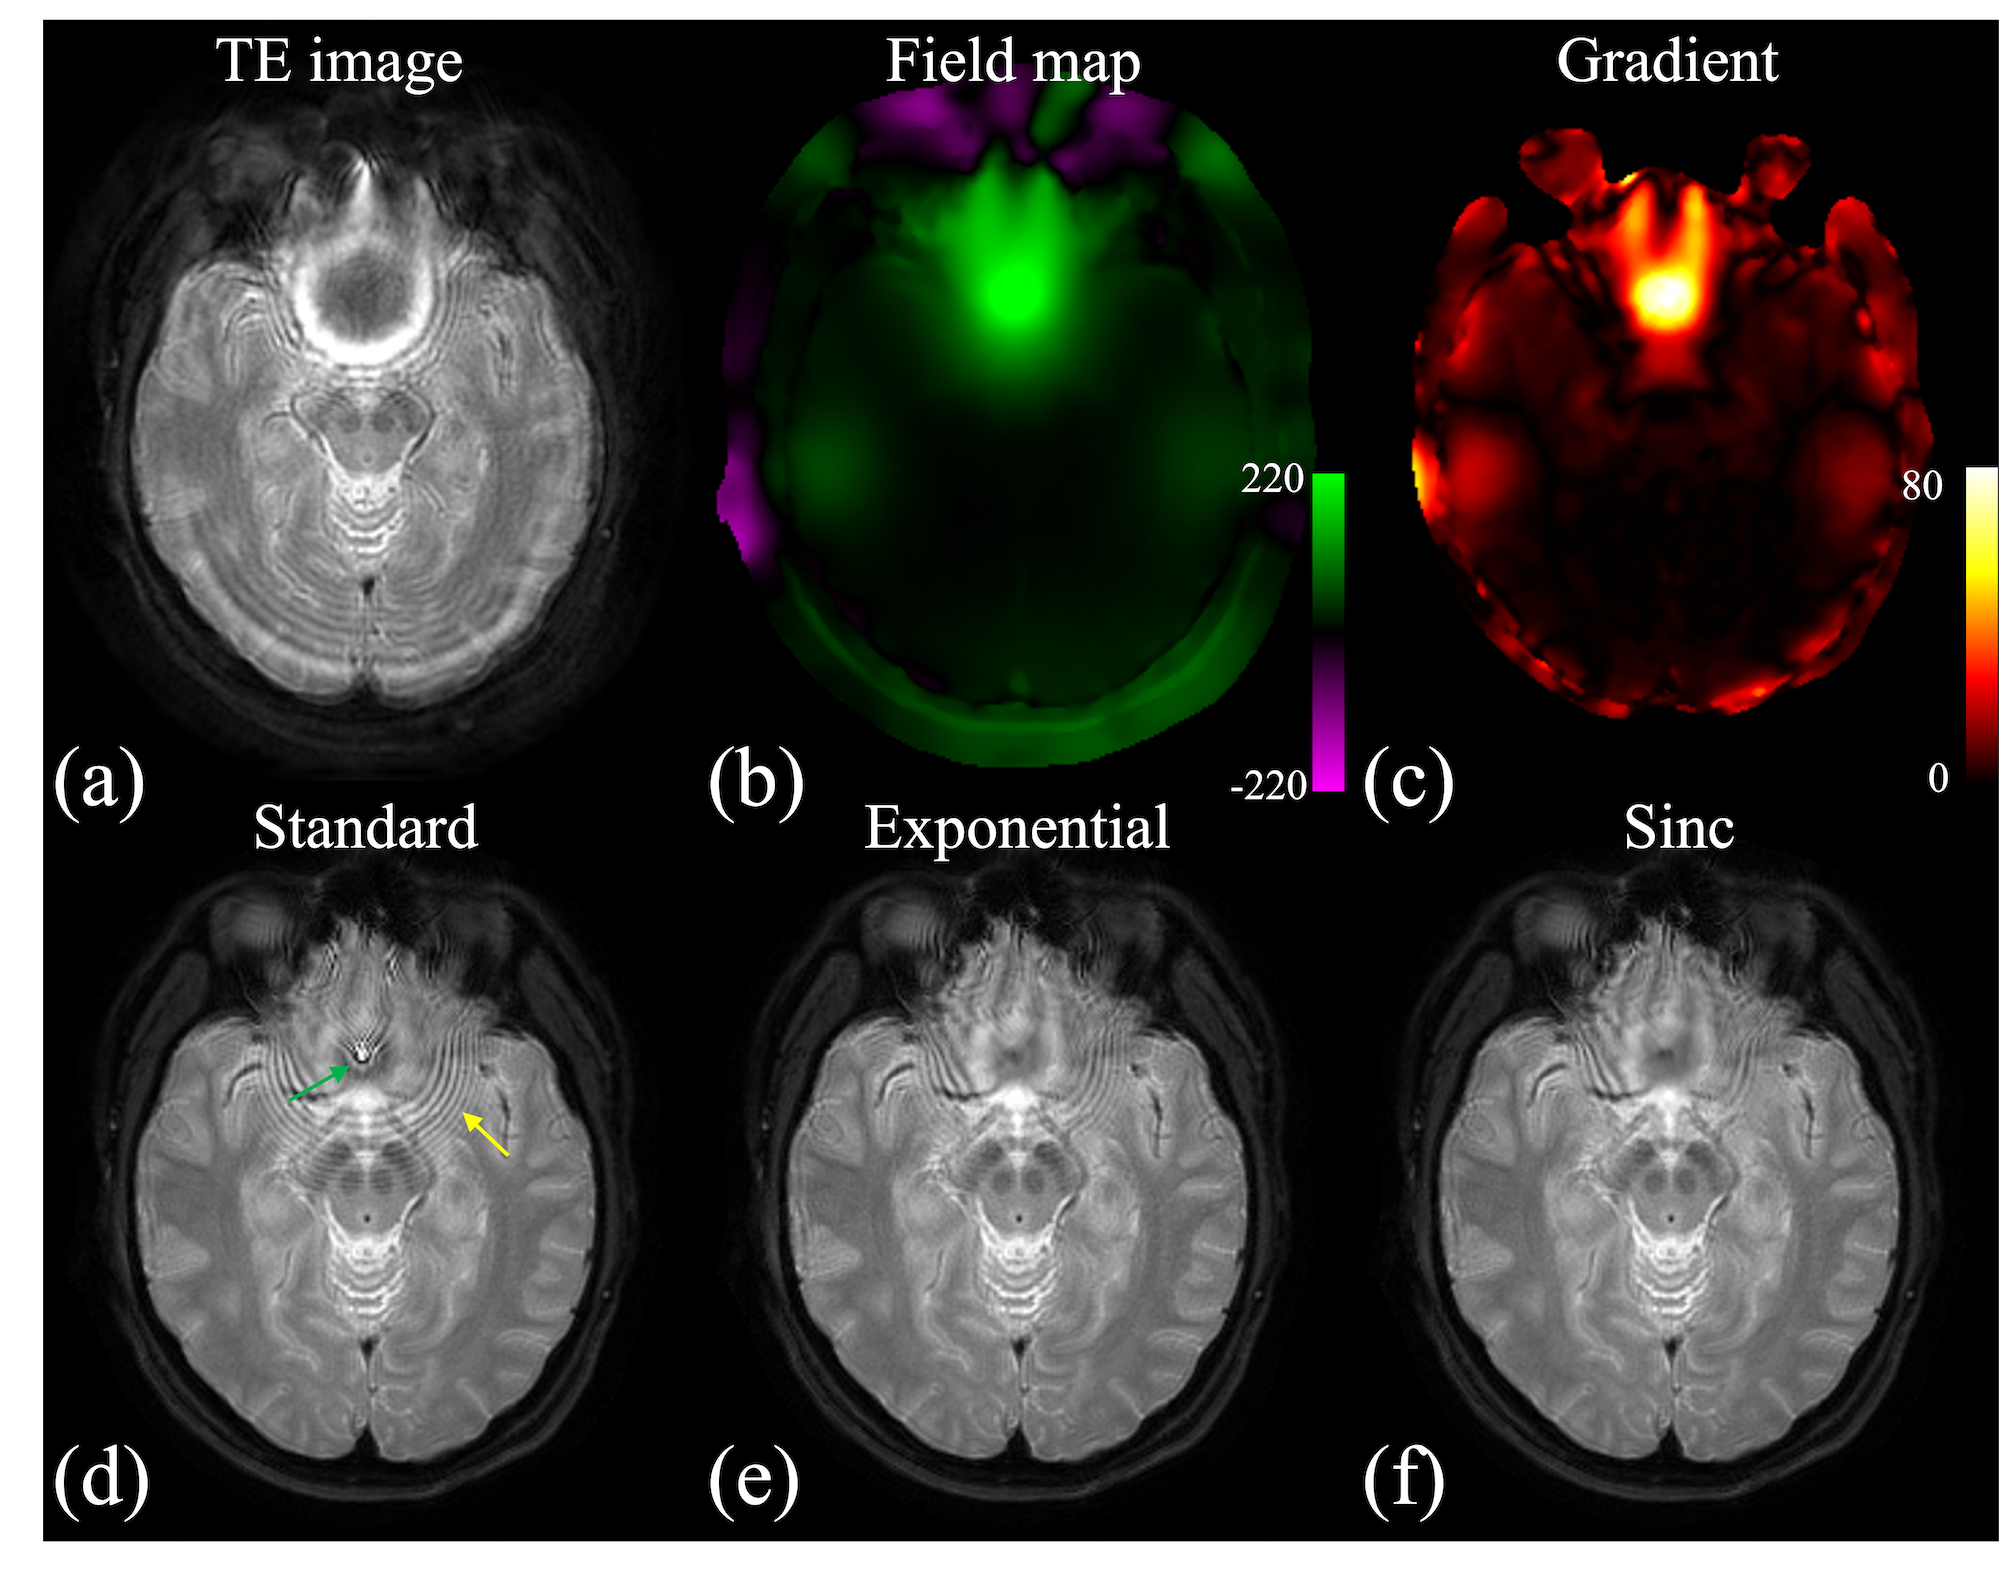
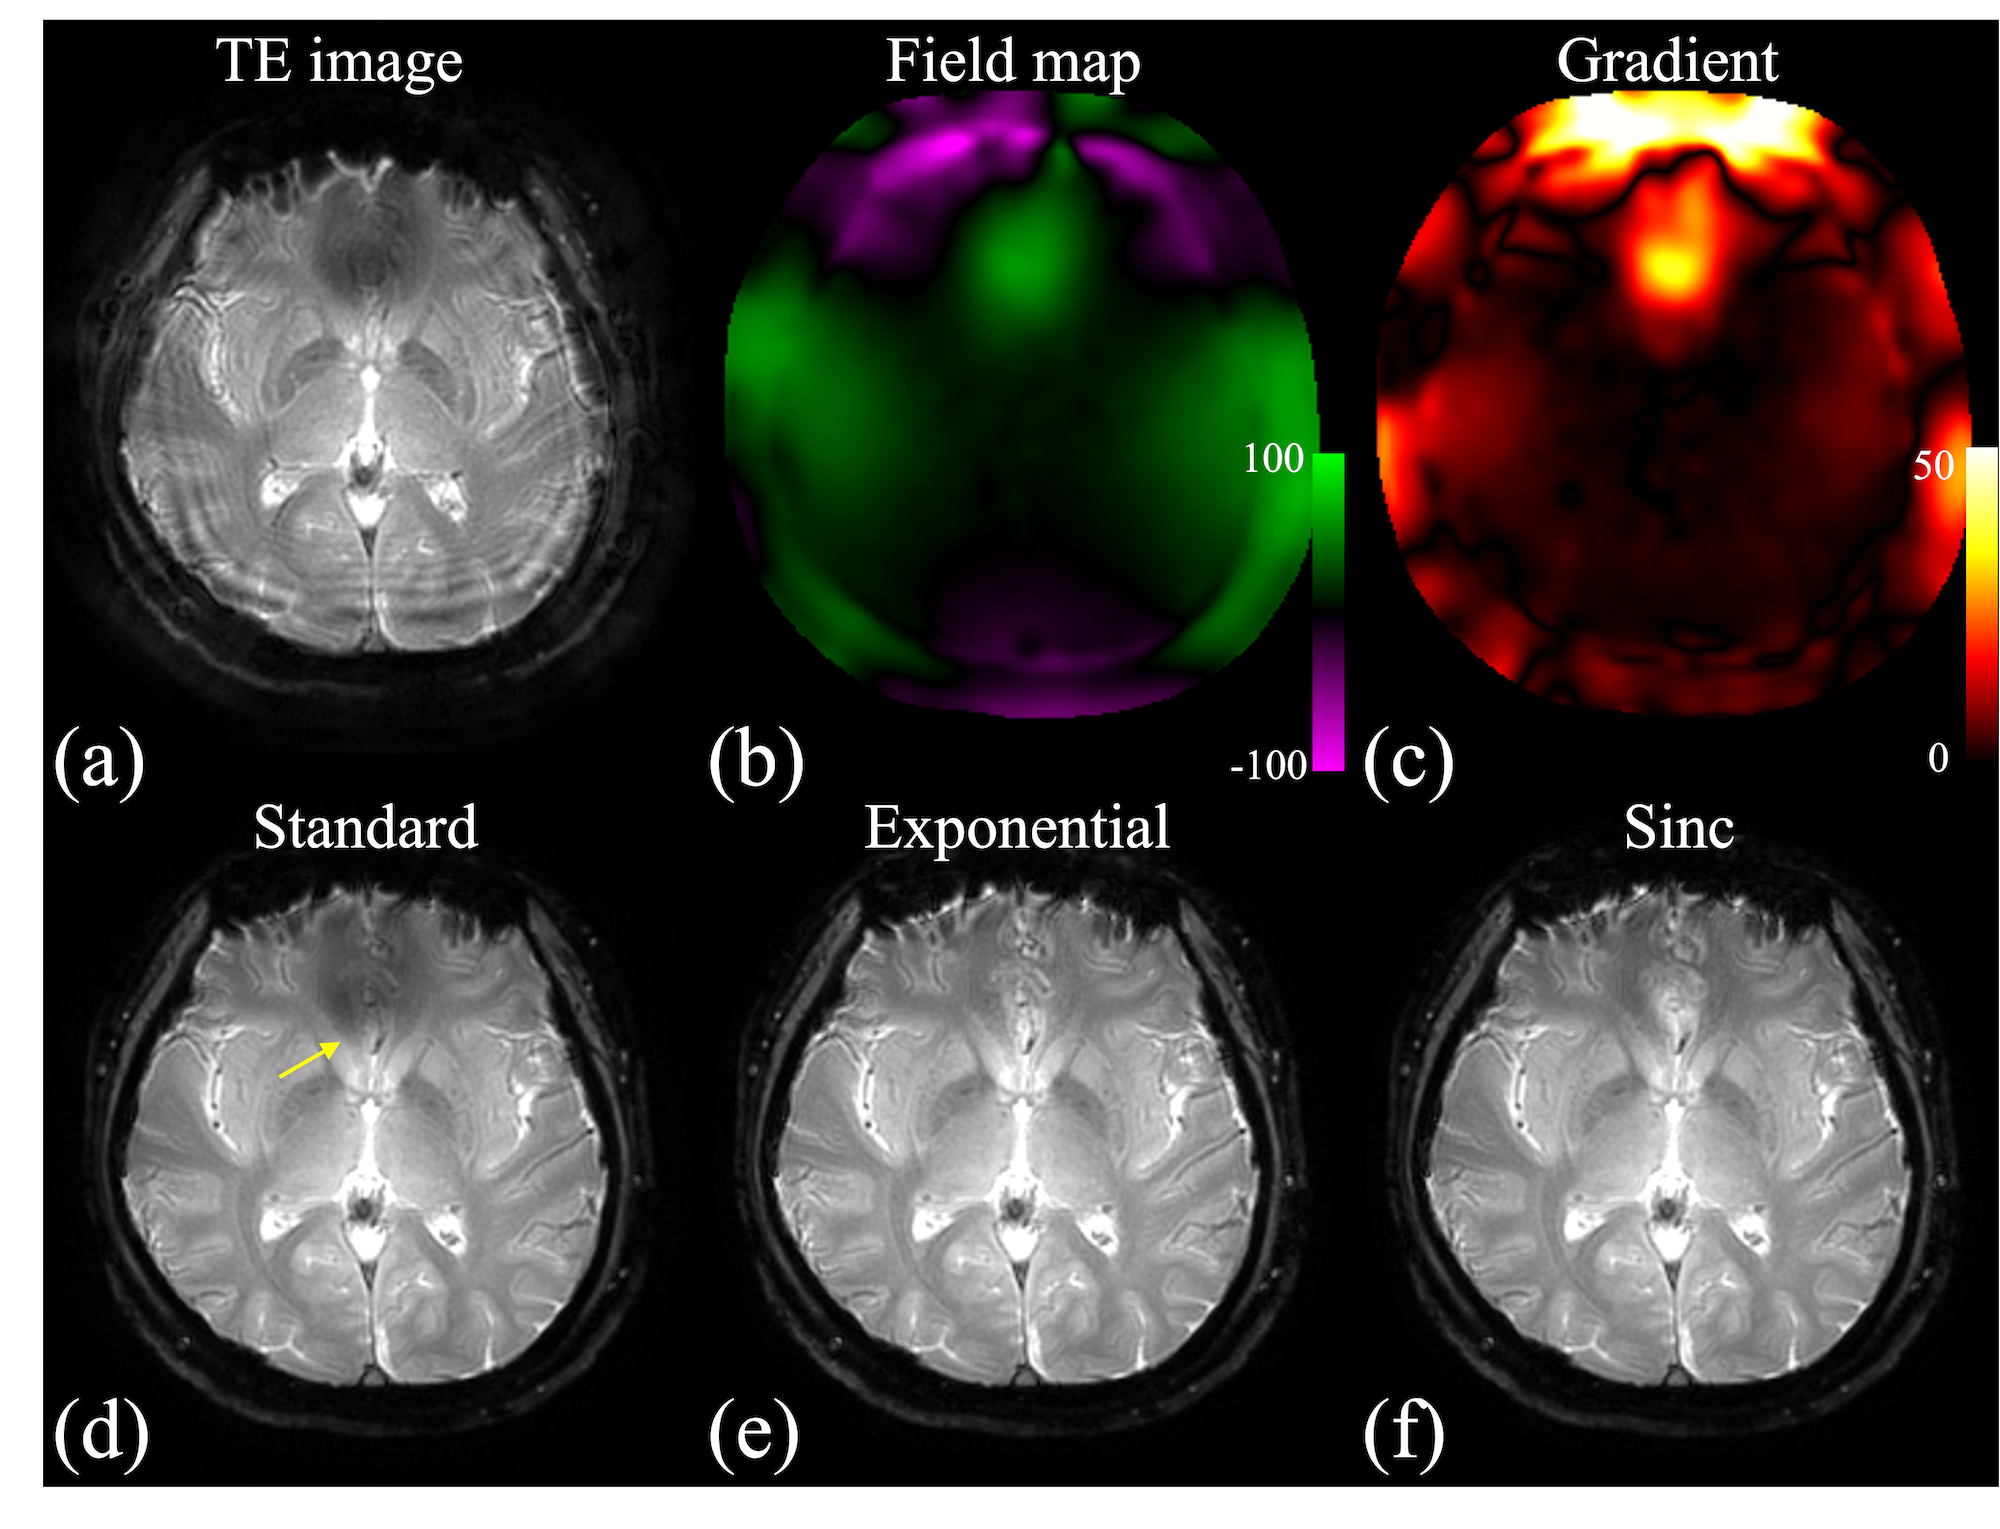
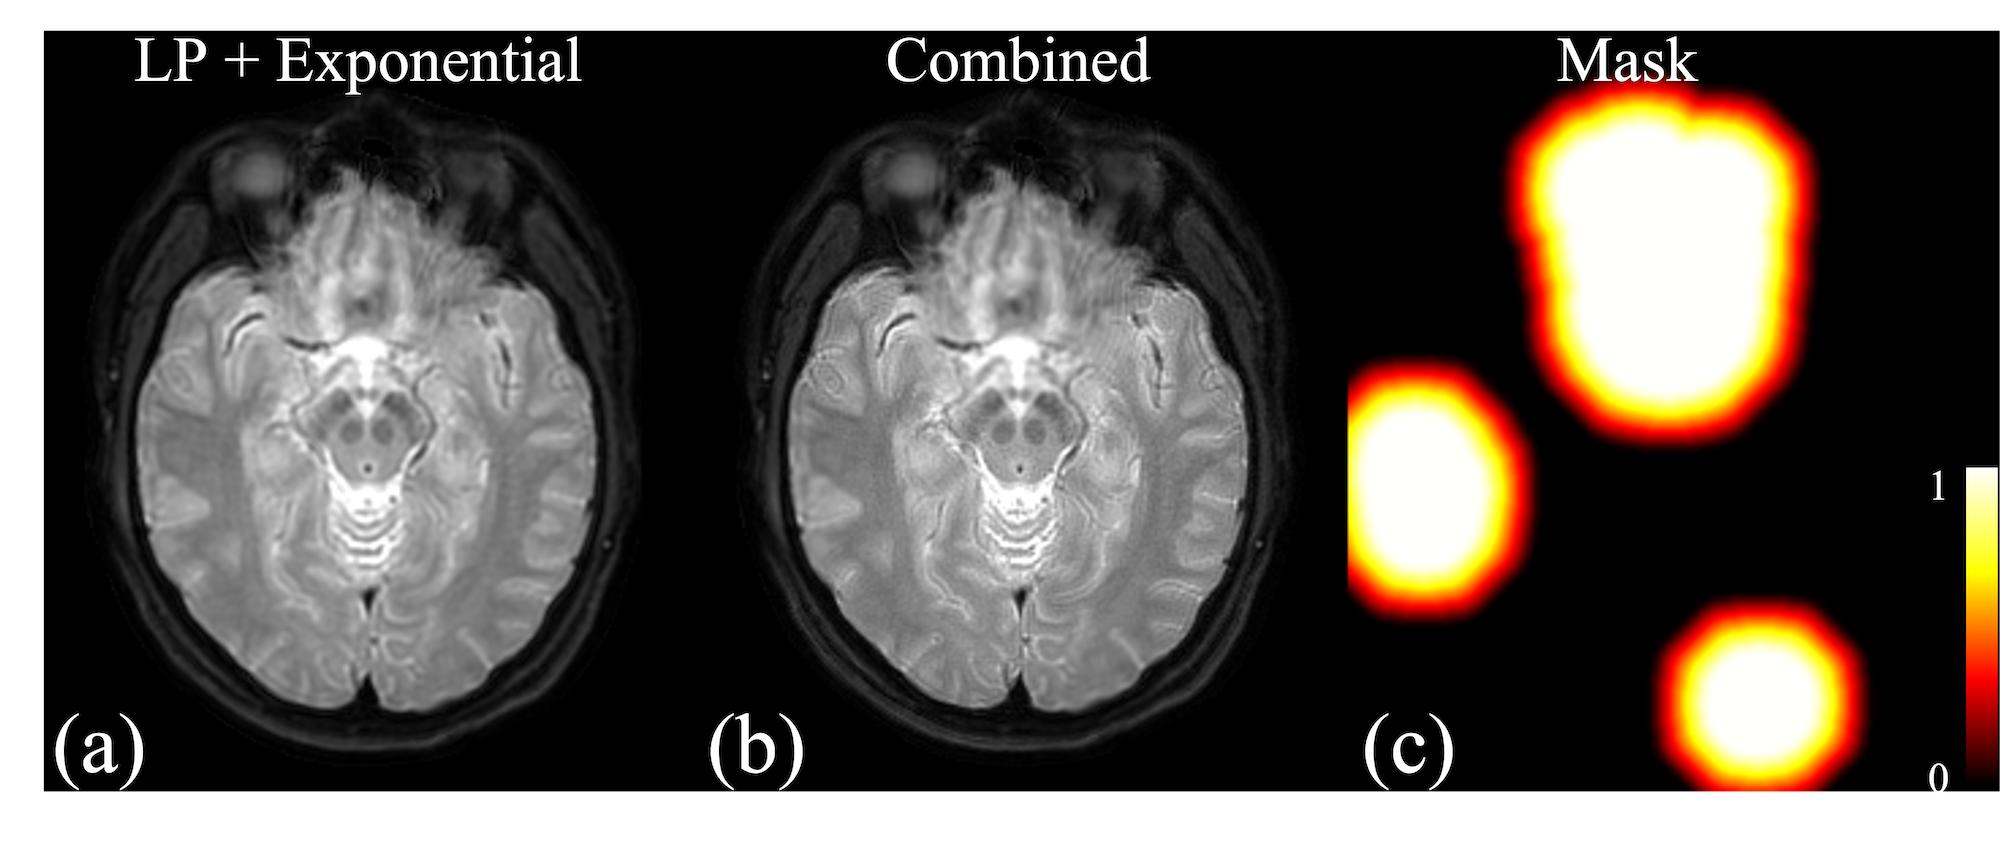
After the blurred TE images were reconstructed, the deblurred images were computed by solving Eq. (1) with blurring/deblurring kernels without magnitude decay (standard), with the exponential decay model (3), and with the sinc decay model (4). For the 2D data used in this study, the total through-plane gradient is usually much larger than the in-plane gradient. Only the through-plane gradient is included in the calculation. The exponential decay model were also incorporated with deblurring using equation (2) (LP + Exponential). The deblurred images resulting from equation (1) and equation (2) were combined using masks computed based on the product of the magnitude of the gradient of Δf0 and the spiral readout length. Spiral data were sampled at twice the Nyquist rate, so that images from odd and even samples were subsequently subtracted to evaluate noise5.
Results and Discussion
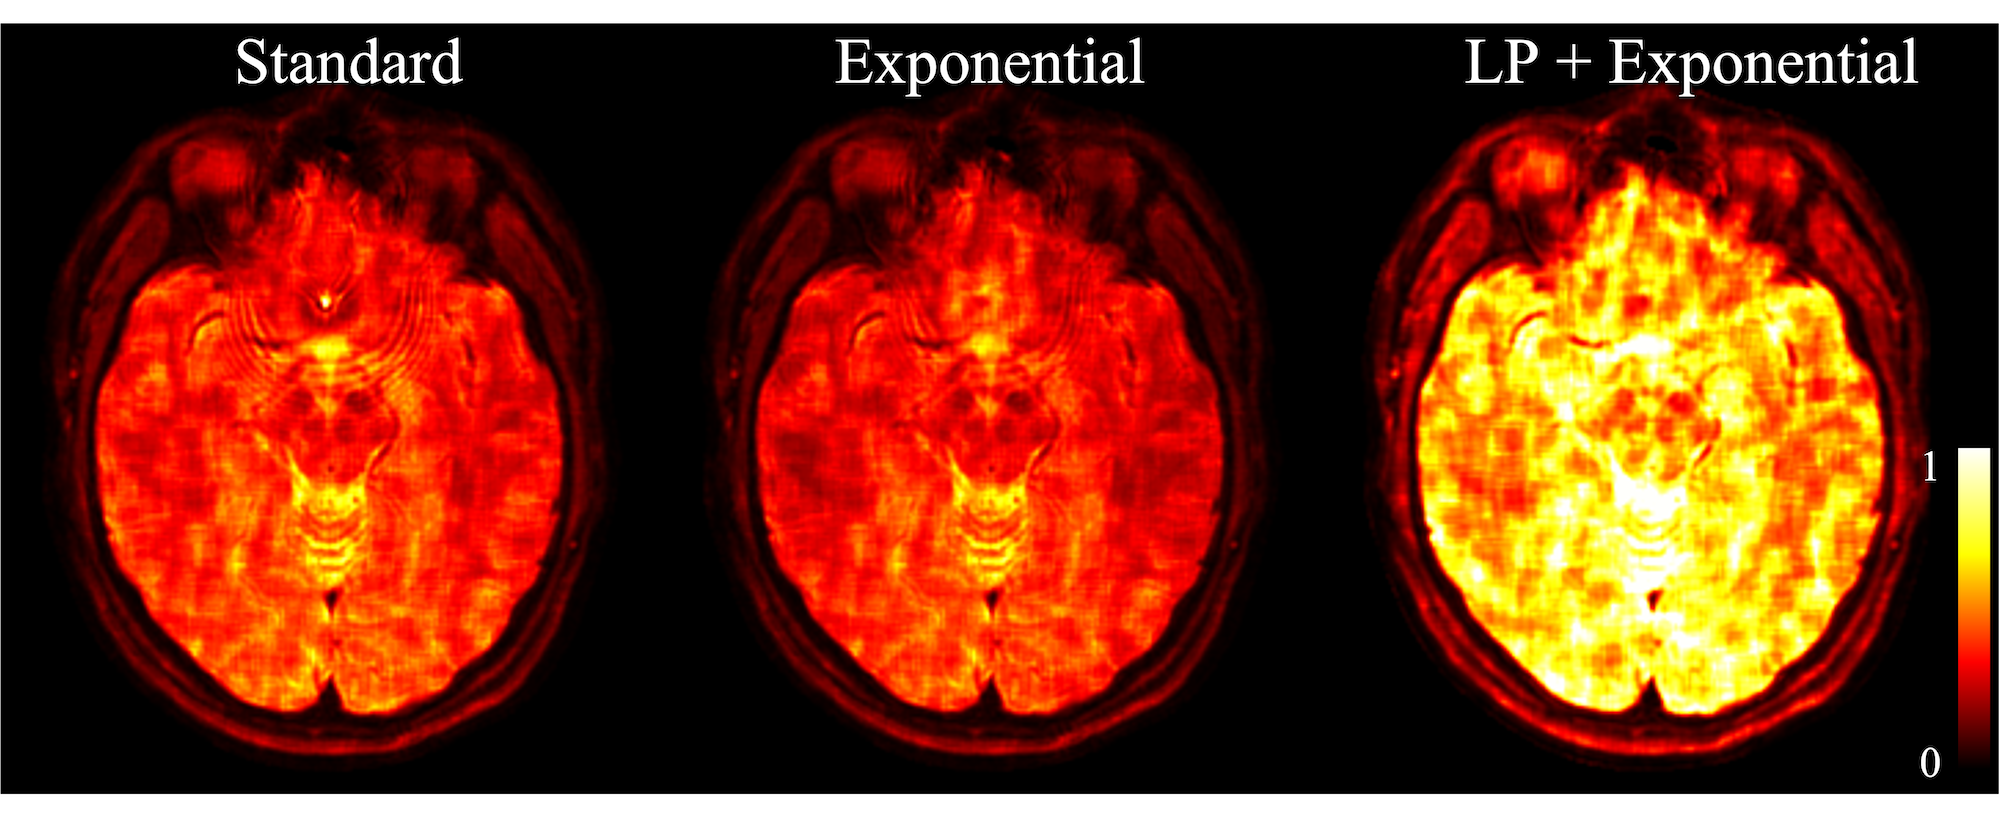
In T2W spiral SE imaging, t in equations (3) and (4) starts from the spin echo, i.e. it is 0 and 1.15 ms for the two TE points respectively. The arrows in Fig. 1 point to areas where subtle ringing artifacts can be seen at a 2 mm thick slice. The ringing artifacts are more pronounced in Fig. 2, due to a much higher through-plane gradient across the 4 mm thick slice. In both cases, the ringing artifacts are partially mitigated using magnitude decay models. The decay time t stars from 16.11 and 17.26 ms in T2*W images shown in Fig. 3. In this case, the exponential model performs substantially better in the area pointed by the arrow. The residual ringing artifacts can be further reduced by incorporating the signal decay model with equation (2)(Fig 4) at a cost of slightly reduced resolution. The overall resolution for most regions can be reserved by combining the results (Fig 4b). Relative SNRs using different deblurring models are compared in Fig. 5. In this example, the overall SNR roughly decreases by 10% using the exponential model and increases by 87% when equation (2) is used for deblurring.Acknowledgements
This work was funded by Philips Healthcare.References
1. Wang D, Zwart NR, Pipe JG. Joint water-fat separation and deblurring for spiral imaging. Magn Reson Med. 2018;79:3218-3228.
2. Ngo G, Cerjanic A, Sutton BP, Improved image quality for long readout imaging using piecewise linear field map model. in proceeding of the 28th Science Meeting of ISMRM, Paris, France, 2018. Abstract 175.
3. Wang, D and Pipe JG. Ring artifacts reduction with low-pass filtered debarring kernels. in proceedings of the 30th Science Meeting of ISMRM, 2021. Abstract 3536.
4. Chavhan GB, Babyn PS, Thomas B et al. Principles, techniques, and applications of T2*-based MR imaging and its special applications. Radiographics 2009;29:1433-1449.
5. Ragunathan S, Wang D, Li Z, Pipe JG. Noise Estimation in spiral imaging, in proceeding of the 22rd Science Meeting of ISMRM, Milan, Italy, 2014. Abstract 1716.
Figures