3498
Magnetic Resonance Spectroscopy Spectral Registration with Deep Learning1Department of Biomedical Engineering, Columbia University, New York, NY, United States, 2Department of Psychiatry, Columbia University, New York, NY, United States, 3Department of Neurology, Columbia University, New York, NY, United States, 4Taub Institute Research on Alzheimer's Disease and the Aging Brain, Columbia University, New York, NY, United States, 5Mortimer B. Zuckerman Mind Brain Behavior Institute, Columbia University, New York, NY, United States
Synopsis
Deep learning is an effective image processing approach that has been enthusiastically adopted in Magnetic Resonance Spectroscopy (MRS). Methods such as multilayer perceptrons (MLP) and convolutional neural networks (CNN) have been applied to frequency and phase correction (FPC) to help resolve frequency and phase shifts that arise in MRS. However, both methods need to be trained separately with frequency and phase offsets to perform FPC. In this study, we aim to introduce a spectrum registration technique using CNNs that perform simultaneous correction of both frequency and phase shifts of single voxel MEGA-PRESS MRS simulated data.
Introduction
Magnetic Resonance Spectroscopy (MRS) is a widely available approach for research and for routine clinical applications, which provides noninvasive, quantitative metabolite profiles of tissue. However MR is highly sensitive to scanner instabilities such as frequency drift and subject motion, which can result in frequency, phase, and intensity shifts that affect data analysis. Thus, frequency-and-phase correction (FPC) is an important technique that needs to be addressed for MRS. Deep learning is an effective image processing approach that has been adopted in MR imaging but thus far has had a more modest impact on MRS1,2. Recently, a multilayer perceptron (MLP) model and Convolutional neural network (CNN) has been applied to address FPC3,4. Although both of these approaches demonstrate quick and output well-predicted results, these current approaches need to be trained and be used to correct frequency and phase shifts separately. In the present study, we aim to investigate the feasibility and utility of simultaneous correction of both frequency and phase offsets of single voxel MEGA-PRESS MRS simulated data.Material and Methods
2.1 Simulated DatasetThe MEGA-PRESS transients were simulated using the FID-A toolbox3,5,6. From a dataset of 40,000 OFF+ON, a train-validation-test split of 8-1-1 (Training set: 32000 transients; Validation set: 4000 transients; Test set: 4000 transients) was conducted for model training and evaluation. Furthermore, additional spectra were created with lower SNRs (10 and 2.5) by adding random Gaussian noise to the published simulated dataset respectively.
2.2. Network architecture
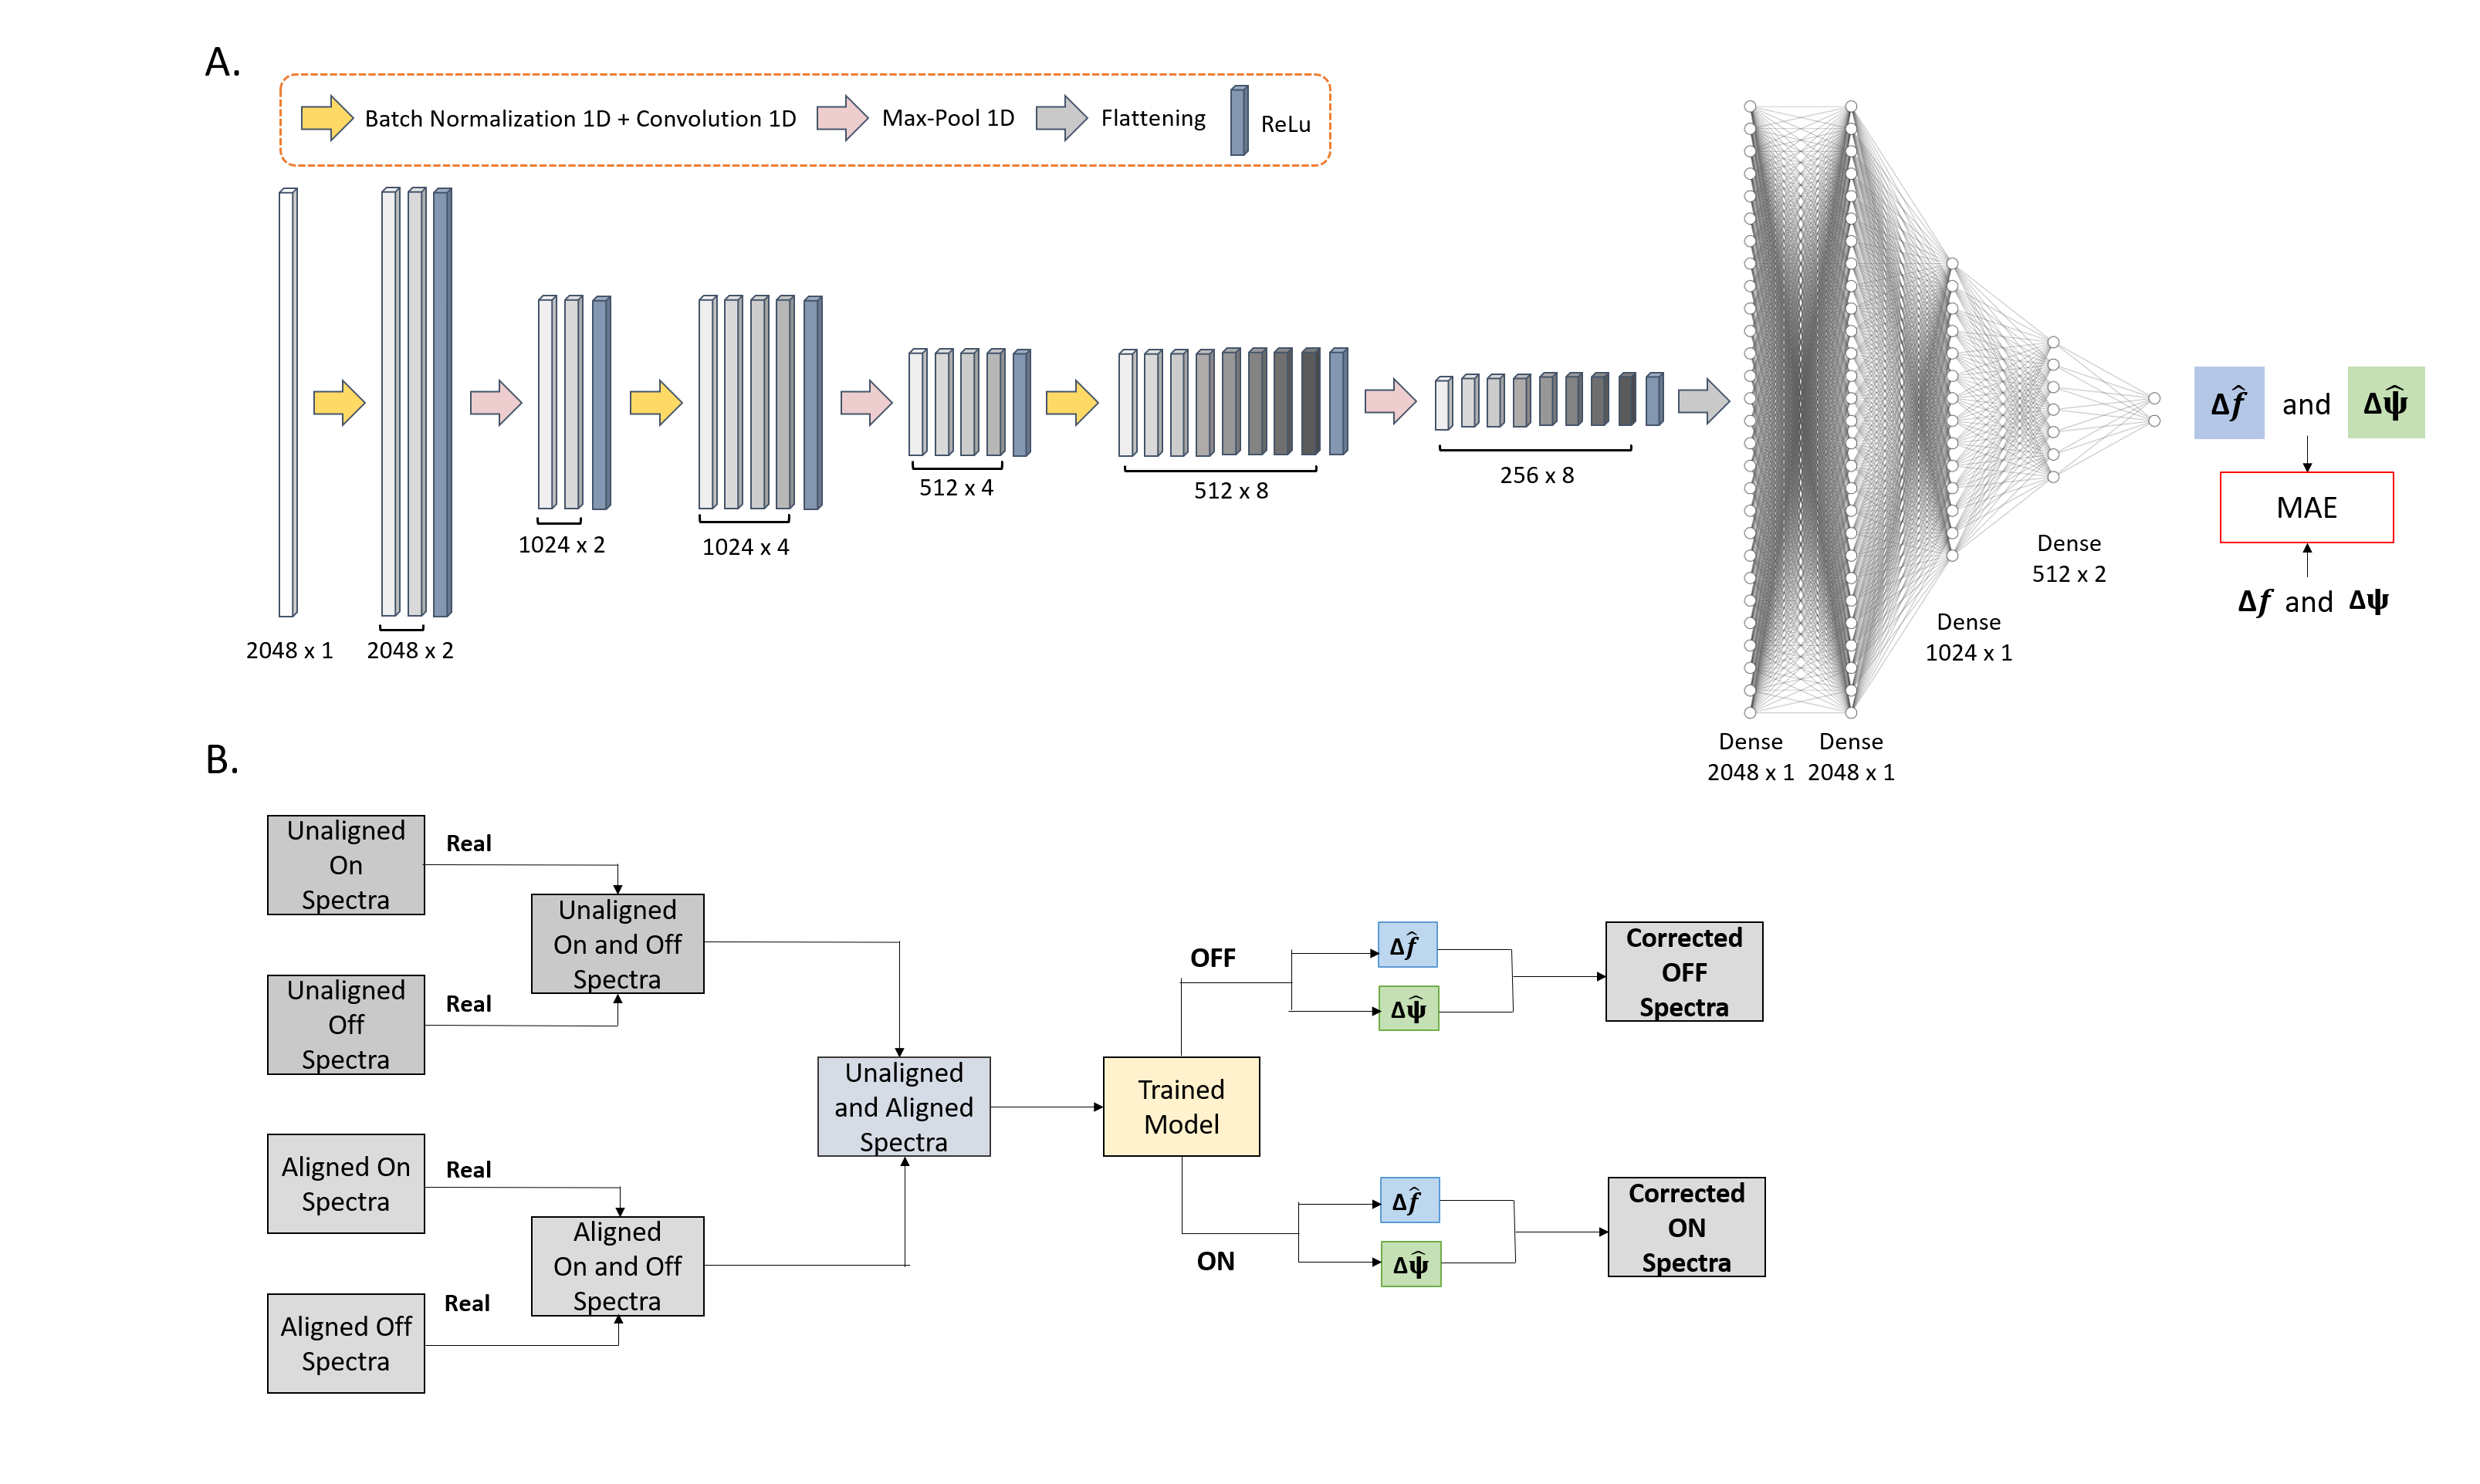
A backbone CNN model was used and evaluated to compare its accuracy in frequency and phase offset prediction (Figure 1A). The model architecture was developed with components of convolution, batch normalization, pooling, dense and Rectified Linear Unit (ReLU). The concatenation of the real unaligned and aligned spectrum was used as input for the model. The output of the model is the estimated frequency and phase offset. An Adam optimizer was used to train the neural network with a 0.0001 learning rate7. Each model was trained for 500 epochs with a batch size of 32, and the mean absolute error was used as the loss function. More information about the model architecture is shown in Figure 1B.
2.3 Performance Measurement
For the dataset, the artificial offsets (frequency and phase) were set as the ground truth, and the summed mean absolute errors between the ground truths and predicted frequency and phase offsets were used as the criteria to measure the network's performance.
Results
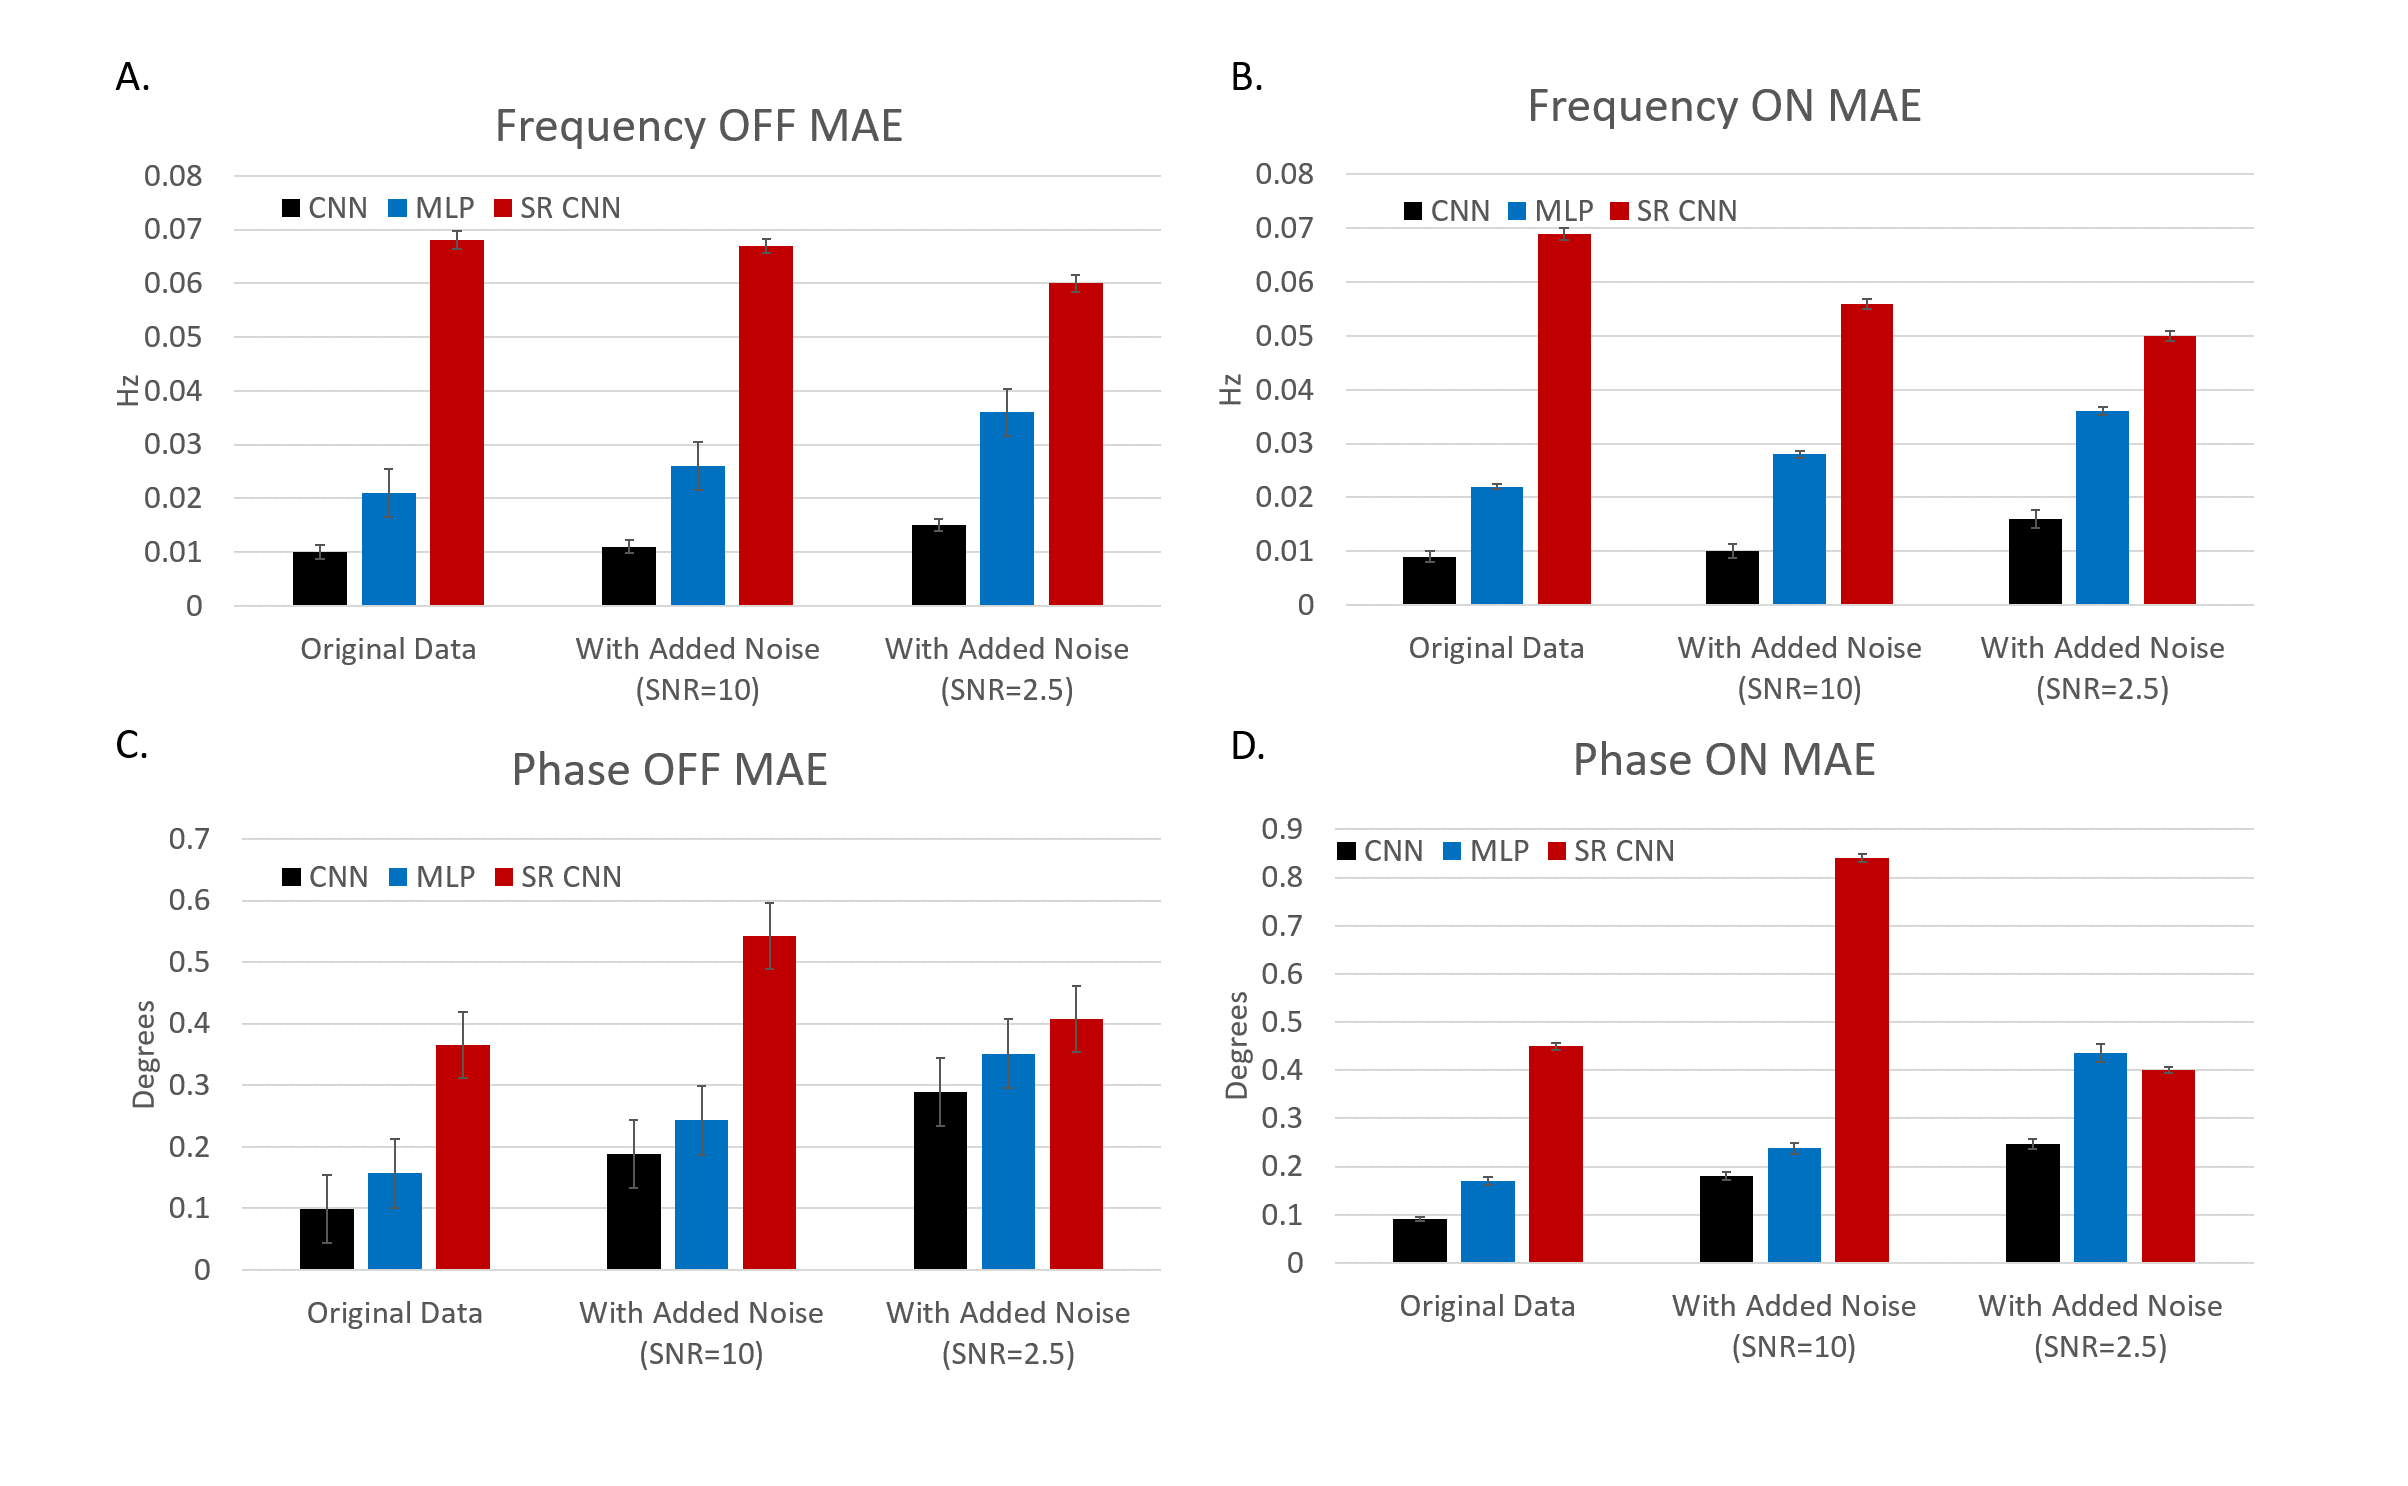
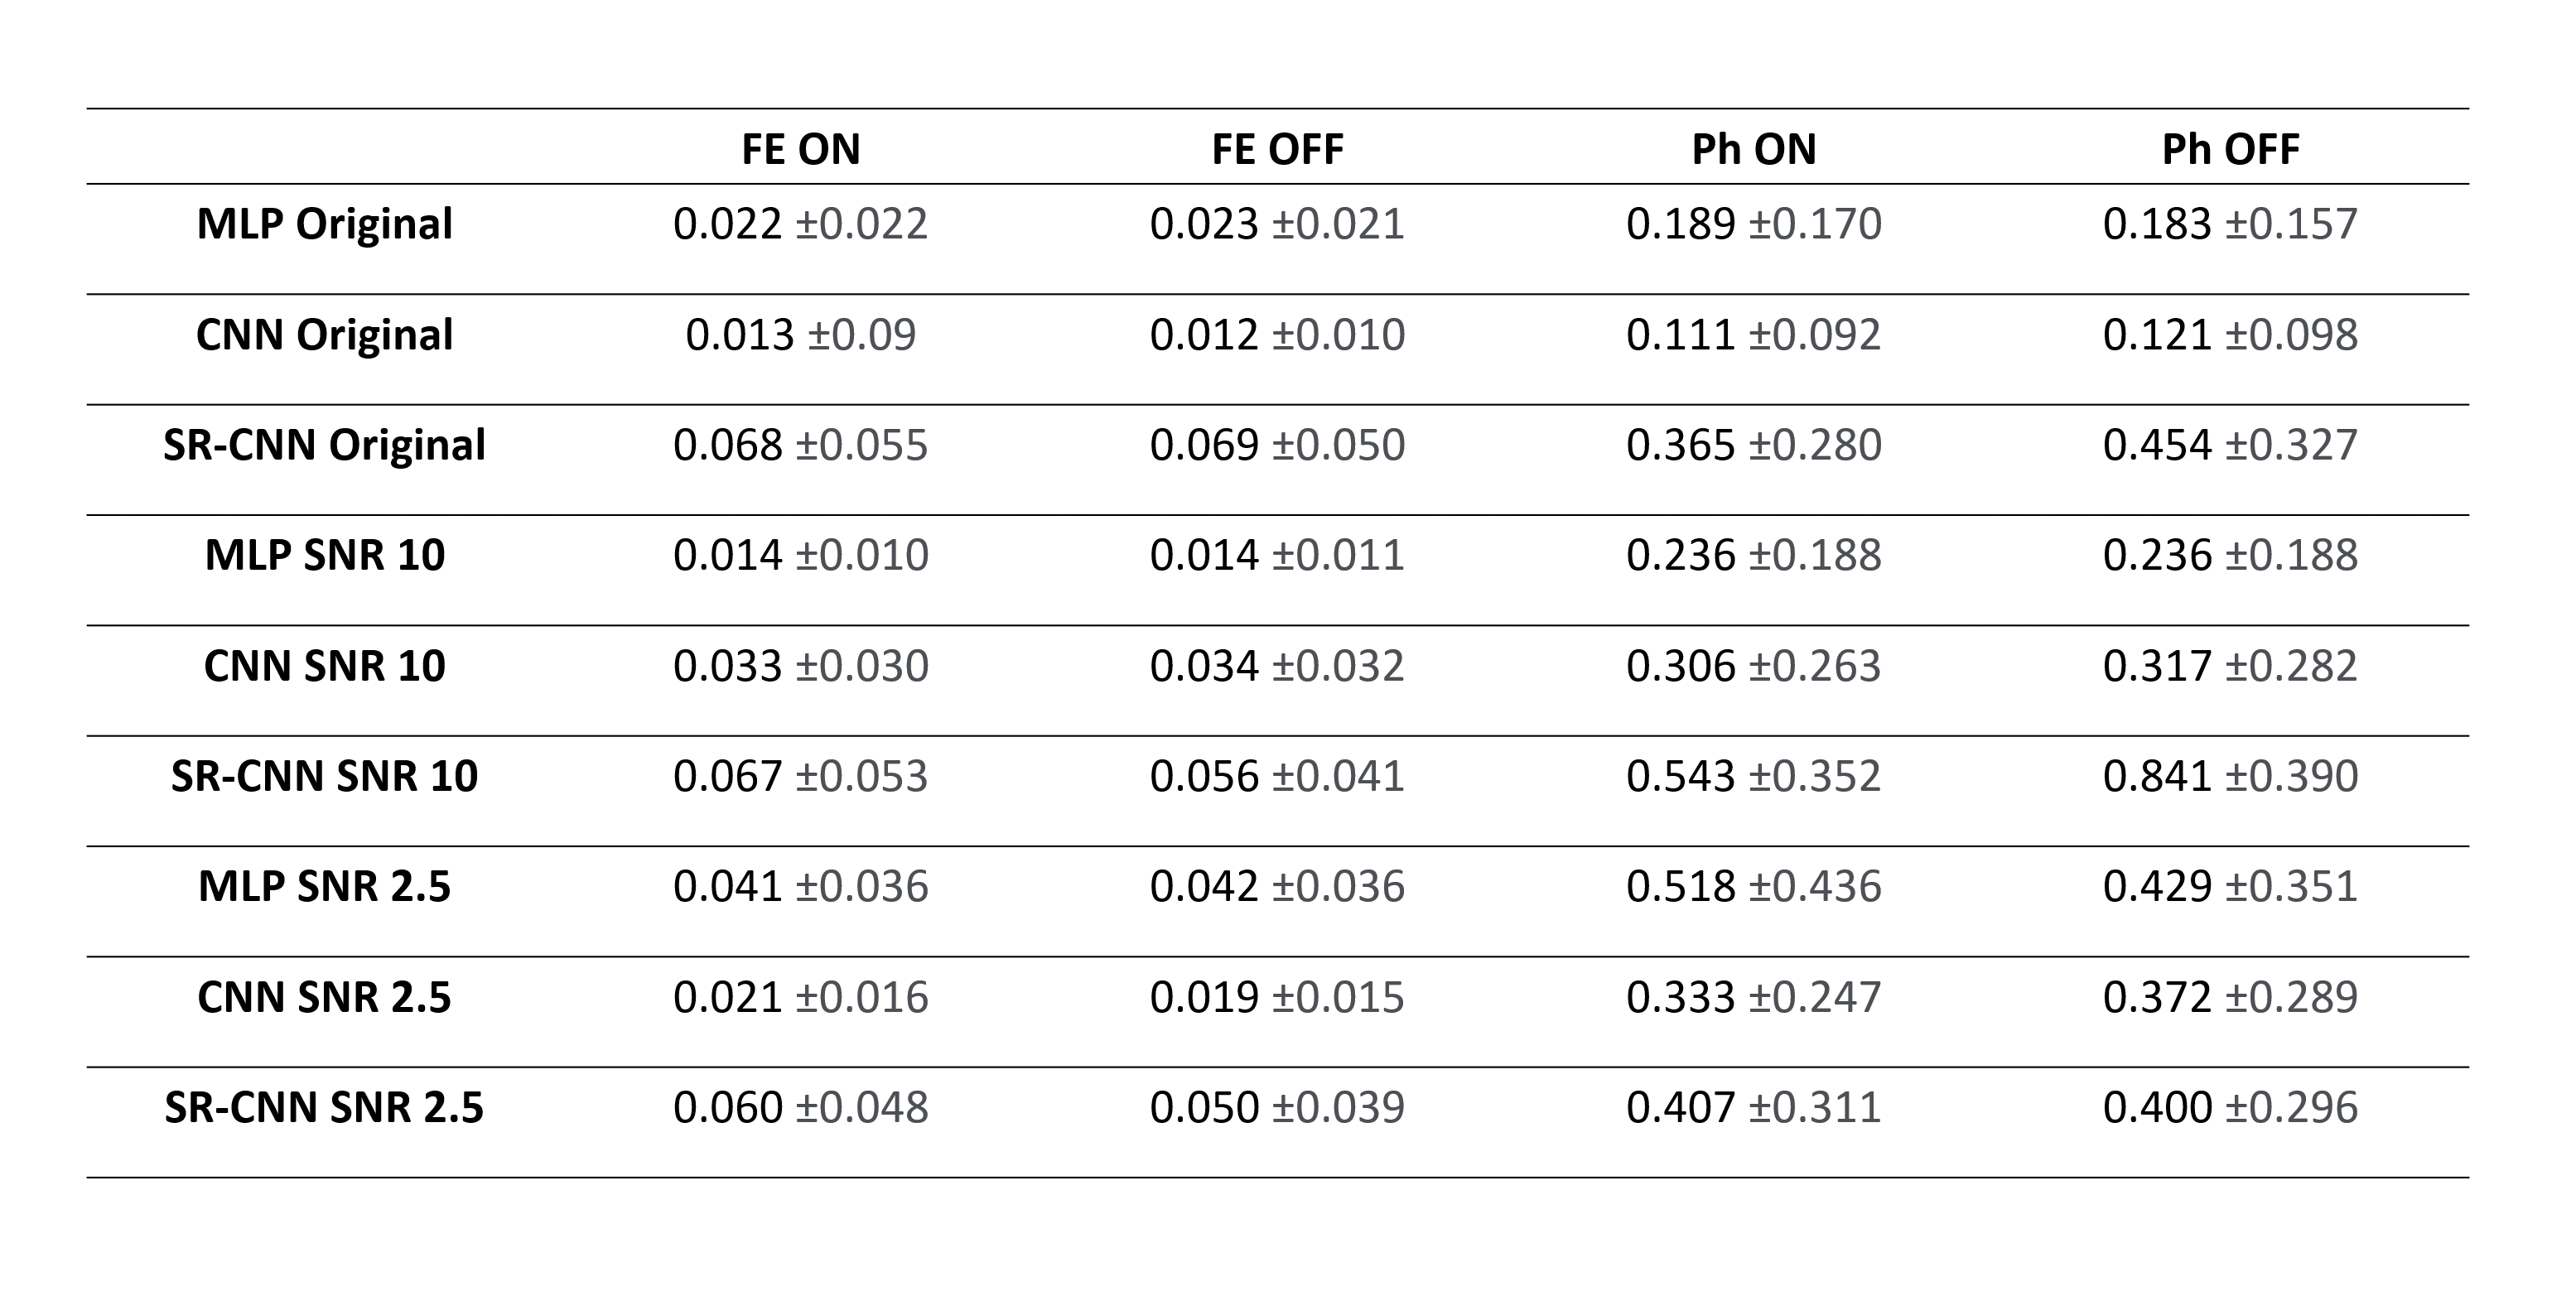
The spectral registration CNN (SR-CNN) model had larger frequency and phase offset estimation errors for both OFF and ON data when compared to the other published models. With the original dataset, the SR-CNN model had a frequency prediction error of 0.068 ±0.055 Hz (On) and 0.069 ±0.050 Hz (Off). Furthermore, the SR-CNN model had a frequency prediction error of 0.060 ±0.048 Hz (On) and 0.050 ±0.039 Hz (Off) with the dataset of SNR 2.5. Although in both cases, the model performance is worse than the MLP and CNN model, it can be seen that our model does not decrease in performance on a noisier dataset whereas the other models do. The same conclusion can be drawn from the phase estimation errors. While other models such as CNN had an increase in prediction errors with more noisy data (ex. On spectra phase error from original to SNR 2.5 dataset: 0.111 ±0.092° to 0.333 ±0.247°), the SR-CNN model showed consistent predictions where the error is approximately the same (0.365 ±0.280° to 0.407 ±0.311°). The standard deviation of the errors also decreased for our model as well when the datasets got noisier for the majority of the analysis (ex. Off spectra phase error from original to SNR 2.5: 0.454 ±0.327° to 0.400 ±0.296°). These results can be observed in Figure 2 and 3.Discussion and Conclusion
Simultaneous correction of frequency and phase offsets were firstly introduced using our spectral registration CNN model. The results came short when compared to the published MLP and CNN model for the majority of the analysis but it was found that with more random noise, the performance either was constant or improved. This shows that our model is more robust to noise. We believe that eventually with even noisier data, the performance may be better than the published CNN model. Furthermore, the backbone of our model was a CNN and we have yet to try other models such as transformers to perform the analysis. All in all, there are many parameters that can still be tuned. In addition, in vivo data has not been quantified with our model. For future work, we plan to further tune the model by finding the optimal input and assess the performance with wider ranges of noise. We also plan to use the same in vivo dataset which the MLP and CNN model has been evaluated to confirm our model’s utility for spectral registration.Acknowledgements
This study was performed at the Zuckerman Mind Brain Behavior Institute at Columbia University and Columbia MR Research Center site.References
1. Gurbani SS, Schreibmann E, Maudsley AA, et al. A convolutional neural network to filter artifacts in spectroscopic MRI. Magn Reson Med. 2018;80(5):1765-1775. doi:10.1002/mrm.27166
2. Chandler, M.; Jenkins, C.; Shermer, S.M.; Langbein, F.C. MRSNet: Metabolite quantification from edited magnetic resonance spectra with convolutional neural networks. arXiv 2019, arXiv:1909.03836.
3. Tapper S, Mikkelsen M, Dewey BE, Zöllner HJ, Hui SCN, Oeltzschner G, Edden RAE. Frequency and phase correction of J-difference edited MR spectra using deep learning. Magn Reson Med. 2021 Apr;85(4):1755-1765. doi: 10.1002/mrm.28525. Epub 2020 Nov 18. PMID: 33210342.
4. Ma, D.J., Le, H.A-M., Ye, Y., Laine, A.F., Lieberman, J.A., Rothman.D.L., Small. S.A., Guo, J. Magnetic Resonance Spectroscopy Frequency and Phase Correction Using Convolutional Neural Networks. bioRxiv 2021, bioRxiv: 0529.446254
5. Mullins PG, McGonigle DJ, O’Gorman RL, et al. Current practice in the use of MEGA-PRESS spectroscopy for the detection of GABA. Neuroimage 2014;86:43–52.
6. Near J, Edden R, Evans CJ, Paquin R, Harris A, Jezzard P. Frequency and phase drift correction of magnetic resonance spectroscopy data by spectral registration in the time domain. Magn Reson Med. 2015;73:44-50.
7. D. Kingma and J. Ba. Adam: A method for stochastic optimization”. arXiv 2014, arXiv:1412.6980.
Figures